1. Introduction
In this paper we develop an “yield-macro” model using the three yield curves (nominal, real and implied inflation spot rates) and two macroeconomic variables (annual realised inflation and annual real GDP growth) following the benchmark model proposed by Şahin et al. (Reference Şahin, Cairns, Kleinow and Wilkie2014).
The previous studies on macro-finance models mostly start with a basic “yield-only” model as a model of just the yield curve without macroeconomic variables. Then they incorporate macroeconomic variables and estimate an yield-macro model. The stated aim is to examine the nature of the linkage between the factors driving the yield curve and macroeconomic fundamentals.
Şahin et al. (Reference Şahin, Cairns, Kleinow and Wilkie2014) developed a term structure model for actuarial applications by considering the three term structures simultaneously, using the UK data. The model is called yield-only model due to excluding the effect of the macroeconomic factors. This paper takes the UK term structure modelling one step further and includes annual realised inflation and annual real GDP growth as macroeconomic variables. Therefore, the model proposed in this paper is called yield-macro model.
We use the hybrid data (Bank of England data and fitted spot rates for the missing values) obtained in Şahin et al. (Reference Şahin, Cairns, Kleinow and Wilkie2014) by fitting the Cairns model (Cairns, Reference Cairns1998) as a descriptive yield curve model to fill in the gaps in the term structures data provided by the Bank of England. The Carins model and the process of obtaining the full set of data is given in Şahin et al. (Reference Şahin, Cairns, Kleinow and Wilkie2014) in detail.
As we already have all available maturities we develop an yield-macro model by introducing the principal components (PCs) obtained from the hybrid data and macroeconomic variables. We examine the correlations between the variables and fit a vector autoregressive (VAR) model. Then we analyse the performance of the VAR model with respect to the random walk (RW) and autoregressive order one process (AR(1)), calculate the one-quarter ahead forecasts and check whether the Fisher relation holds for the forecasts. The paper extends the model developed by Şahin et al. (Reference Şahin, Cairns, Kleinow and Wilkie2014) by adding the macroeconomic variables for a better estimation of the yield curves. The main contribution of this paper is to improve modelling of the UK nominal, real and implied inflation term structures by considering the bidirectional relation between the yield curves and macroeconomic variables such as realised inflation and real GDP growth.
After constructing an yield-macro model we compare it with the Wilkie model in both structural and empirical ways. Owing to incorporating different input variables, the models have different structures and the nature of the relations between these variables is also different. Since the two models were developed based on different periods of data we use the neutral initial conditions of the yield-macro model for the Wilkie model and we adjust the mean parameters of the inflation and interest rates models of Wilkie according to these initial conditions. Therefore, we have made the two models exactly comparable. Then we simulate the zero-coupon (ZC) bond yields and examine the empirical distribution functions. We have also calculated the asset values and annuity payoffs for the two models under a hypothetical pension scheme.
The remainder of the paper is organised as follows. Section 2 presents a brief literature review on yield curve modelling and the effects of the macroeconomic factors. Section 3 introduces the yield-macro model, and we discuss the term structure data and macroeconomic variables used, correlations between these variables, VAR model fitted to the data, comparison of the VAR model with the RW model and AR(1) process, forecasting and the Fisher relation check. Section 4 compares the yield-macro model with the Wilkie model in two ways: philosophical and empirical. Finally, section 5 concludes.
2. Literature Review
Short-term interest rates have different meanings from a macroeconomic perspective and a finance perspective. From a macroeconomic perspective, the short-term interest rate is a policy instrument directly controlled by the central bank to achieve its economic stabilisation goals. From a finance perspective, the short rate is a fundamental building block for yields of other maturities, which are just risk-adjusted averages of expected future short rates. Much recent research has pointed out that a joint macro-finance modelling strategy would provide the most comprehensive understanding of the term structure of interest rates (Diebold et al., Reference Diebold, Piazzesi and Rudebusch2004).
Ang & Piazzesi (Reference Ang and Piazzesi2001, Reference Ang and Piazzesi2003) is one of the earliest works that describes joint dynamics of bond yields and macroeconomic variables. They investigate how macro variables affect bond prices and the dynamics of the yield curve using a term structure model with inflation and economic growth factors, together with latent variables. They use both observed macro factors and unobserved yield variables in a vector autoregression with a no arbitrage restriction.
Ang & Piazzesi (Reference Ang and Piazzesi2001, Reference Ang and Piazzesi2003) use Taylor (Reference Taylor1993) policy rulesFootnote 1 to model the short-term yields. Movements in the short rate r t are traced to movements in observed macro variables  $$f_{t}^{o} $$
and a component that is not explained by macro variables, an orthogonal shock v t:
 $$r_{t} =a_{0} {\plus}a_{{1}}' f_{t}^{o} {\plus}v_{t} $$
Taylor’s original specification uses two macro variables as factors in  $$f_{t}^{o} $$
. The first variable is an annual inflation rate and the second variable is the output gap. Another type of policy rule that has been proposed by Clarida et al. (Reference Clarida, Gali and Gertler2000) is a forward-looking version of the Taylor rule. According to this rule, the central bank reacts to expected inflation and the expected output gap. This implies that any variable that forecasts inflation or output will enter the right-hand side of equation (1). Thus, Ang & Piazzesi (Reference Ang and Piazzesi2001, Reference Ang and Piazzesi2003) specify the short rate as affine functions of factors:
 $$r_{t} =\delta _{0} {\plus}\delta _{{11}} 'X_{t}^{o} {\plus}\delta _{{12}} 'X_{t}^{u} $$
Their approach is to specify the latent factors  $$X_{t}^{u} $$
(the superscript u stands for unobserved) as orthogonal to the macro factors
 $$X_{t}^{o} $$
(the superscript o stands for observed). In this case, the short rate dynamics of the term structure model can be interpreted as a version of the Taylor rule with the errors
 $$v_{t} =\delta _{{12}} 'X_{t}^{u} $$
being unobserved factors. They use the restrictions from no arbitrage to separately identify latent factors.
They estimate three models: the estimation based on the current values of the macro variables is called macro model. The version with the full lagged Taylor rule is denoted as the macro lag model. The estimation without any macro variables is called the yields-only model. They find that the forecasting performance of a VAR improves with the no arbitrage restrictions and macro factors. Variance decompositions show that macro factors explain up to 85% of the variation in bond yields. Macro factors primarily explain movements at the short end and middle of the yield curve while unobservable factors still account for most of the movement at the long end of the yield curve.
Evans & Marshall (Reference Evans and Marshall2001) looked at different types of macroeconomic impulses on the nominal yield curve. They use a variety of vector autoregression approaches. They start with an atheoretical empirical exercise that simply asks whether the level, slope and curvature of the yield curve is significantly affected by the block of macroeconomic variables. The only restriction they impose is to assume (following Ang & Piazzesi, Reference Ang and Piazzesi2001, Reference Ang and Piazzesi2003) that the three yields do not feed back to the macro variables. They confirm Ang & Piazzesi’s (Reference Ang and Piazzesi2001, Reference Ang and Piazzesi2003) result that a substantial portion of the variability of short- and medium-term yields is driven by macroeconomic factors. Unlike those authors, they find that most of the long-run variability of long-term rates is driven by macro impulses and that the level of the yield curve responds strongly to macro factors. The strongest responses come from innovations that induce output and inflation responses in the same direction. Then they employ a structural VAR model to identify macroeconomic impulses.
Evans & Marshall (Reference Evans and Marshall2001) find that macroeconomic factors have a substantial, persistent and statistically significant effect on the level of the term structure. This finding stands in contrast to Ang & Piazzesi (Reference Ang and Piazzesi2001, Reference Ang and Piazzesi2003), who find that the level of the yield curve is driven only by latent variables orthogonal to their macro factors.
Ang & Bekaert (Reference Ang and Bekaert2003) develop a term structure model with regime switches, time varying prices of risk and inflation to identify the real interest rate and expected inflation components of the nominal yield curve. They find that expected inflation drives about 80% of the variation of nominal yields at both short and long maturities, but during normal times, all of the variation of nominal term spreads is due to expected inflation and inflation risk.
Rudebusch & Wu (Reference Rudebusch and Wu2008) describe the economic underpinnings of the yield curve by constructing and estimating a combined macro-finance framework. They characterise the relationships between the no arbitrage latent-term structure factors and various macroeconomic variables. The level factor is given an interpretation as the perceived medium-term central bank inflation target. The slope factor is related to cyclical variation in inflation and output gaps. In particular, the slope factor varies as the central bank moves the short end of the yield curve up and down in order to achieve its macroeconomic policy goals. In their work, Rudebusch & Wu modelled macro factors as completely exogenous to the yield curve.
Dewachter & Lyrio (Reference Dewachter and Lyrio2006) model consistently long-run inflation expectations simultaneously with the term structure and show the importance of long-run inflation expectations in the modelling of long-term bond yields. Their paper also provides a macroeconomic interpretation for the latent factors found in standard finance models of the yield curve: the “level” factor represents the long-run inflation expectation of agents; the “slope” factor captures temporary business cycle conditions; and the “curvature” factor expresses a clear independent monetary-policy factor. Their method improves on the approach taken in the literature to use long-run expectations of macroeconomic variables in order to fit the yield curve. A two-step approach is used where long-run expectations are first filtered from the data using some statistical procedure, and then subsequently used to fit the term structure. A drawback of this method is that not all available information is used to filter the long-run expectations since only a subset of the data series is used.
Diebold & Li (Reference Diebold and Li2006) use variations on the Nelson-Siegel (Reference Nelson and Siegel1987) exponential components framework to model the entire yield curve as a three-dimensional parameter evolving dynamically. They show that the three time varying parameters may be interpreted as factors corresponding to level, slope and curvature, and they can be estimated with high efficiency. They propose and estimate autoregressive models for the factors to produce term structure forecasts at both short and long horizons.
Diebold et al. (Reference Diebold, Rudebusch and Aruoba2006) estimated a model that summarises the yield curve using latent factors (level, slope and curvature) and also includes observable macroeconomic variables (real activity, inflation and the monetary-policy instrument). While previous works only consider a unidirectional macro linkage, because inflation and output are assumed to be determined independently of the shape of the yield curve, but not vice versa, Diebold et al. (Reference Diebold, Rudebusch and Aruoba2006) are particularly interested in analysing the potential bidirectional feedback from the yield curve to the economy and back again.
They also compare their approach with others that have been used in the literature such as an unrestricted VAR model for a set of yields (Evans & Marshall (Reference Evans and Marshall1998, Reference Evans and Marshall2001)). They indicate one potential drawback of such a representation as the results may depend on the particular set of yields chosen. A factor representation, as above, can aggregate information from a large set of yields. Such an approach restricts the factors to be orthogonal to each other but does not restrict the factor loadings at all. In contrast, their model allows correlated factors but restricts the factor loadings through limitations on the set of admissible yield curves. For example, the Nelson-Siegel form guarantees positive forward rates at all horizons and a discount factor that approaches zero as maturity increases. Alternative restrictions such as no arbitrage could also be imposed.
Given the ability of the level, slope and curvature factors to provide a good representation of the yield curve, Diebold et al. (Reference Diebold, Rudebusch and Aruoba2006) relate them to macroeconomic variables and construct an yield-macro model. They use an expanded version of the above state–space model and estimate the parameters of the new model. Their measures of the economy include three key variables: manufacturing capacity utilisation, the federal fund rates and annual price inflation. These three variables represent, respectively, the level of real economic activity relative to potential, the monetary-policy instrument and the inflation rate, which are widely considered to be the minimum set of fundamentals needed to capture basic macroeconomic dynamics. The measurement errors associated with the yields-macro model are essentially identical to those of the yields-only model. They find strong evidence of macroeconomic effects on the future yield curve and somewhat weaker evidence of yield curve effects on future macroeconomic developments. Hence, although bidirectional causalty is likely to be present, effects in the tradition of Ang & Piazzesi (Reference Ang and Piazzesi2001) seem more important. They also relate their yield curve modelling approach to a traditional macroeconomic approach based on the expectations hypothesis. The results indicate that the expectation hypothesisFootnote 2 may hold reasonably well during certain periods, but that it does not hold across the entire sample.
Lildholdt et al. (Reference Lildholdt, Panigirtzoglou and Peacock2007) estimate yield curve models for the United Kingdom, where the underlying determinants have a macroeconomic interpretation. The first factor is an unobserved inflation target, the second factor is annual inflation and the third factor is a “Taylor rule residual”, which among other things, captures the effects of the output gap and monetary-policy surprises in the Taylor rule. They find that the long end of the yield curve is primarily driven by changes in the unobserved inflation target. At shorter maturities, yield curve movements reflect short-run inflation and the Taylor rule residual including the output gap effect.
Ang et al. (Reference Ang, Piazzesi and Wei2006) build a dynamic model for GDP growth and yields that completely characterises expectations of GDP that does not permit arbitrage. Contrary to previous findings, they predict that the short rate has more predictive power than any term spread.
3. Yield-Macro Model
3.1. Data
To construct the yield-macro model, we use quarterly UK nominal government spot rates, real spot rates and implied inflation spot rates provided by the Bank of England (2012). As for the macroeconomic variables we use annual realised inflation obtained from retail price index (RPI) and annual real GDP growth provided by OECD (2013). The early version of this work (Sahin, Reference Sahin2010) includes the output gap data as one of the macroeconomic variables but the analyses have been made for shorter terms (52 quarters). Since the latest estimate of the output gap provided by the OECD is available only until the last quarter of 2007 we could not update the data and use in this paper.
We use the quarterly data for the period March 1995 to March 2012. For more information about the data see Şahin et al. (Reference Şahin, Cairns, Kleinow and Wilkie2014).
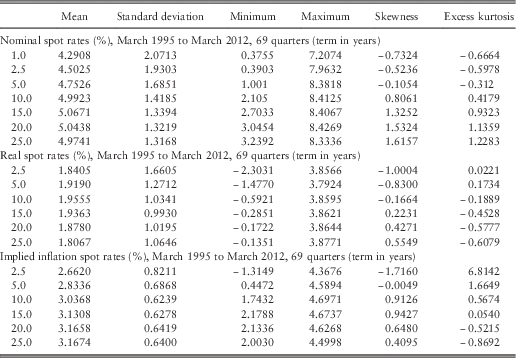
Table 1 presents the summary statistics for the quarterly nominal, real and implied inflation spot rates at representative maturities (in years). The means of the yield curves for different maturities are quite close to each other. Considering the standard deviations, although they do not change significantly, the volatility decreases as the maturities get longer. One possible reason is that the short end of the yield curves can be affected more by the economic conditions than the long end because short-term interest rates are used as monetory policy instruments. The short maturities are slighltly left skewed and the medium and long maturities are slightly right skewed. Excess kurtosis coefficients are small except for the shortest maturity of the implied inflation spot rates.
Descriptive statistics for the full range of terms.

3.2. Correlations between the quarterly yield curve factors and the macroeconomic variables
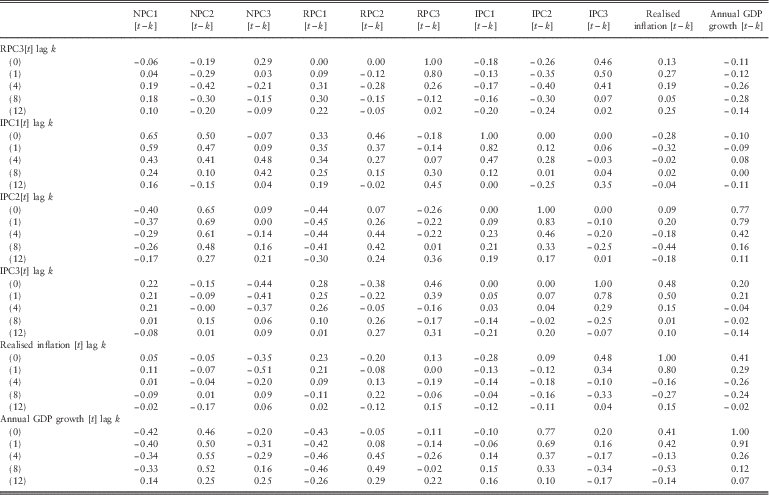
Following Şahin et al. (Reference Şahin, Cairns, Kleinow and Wilkie2014) we used hybrid data (Bank of England data and fitted spot rates for the missing values) to apply the PC analysis to extract uncorrelated yield curve factors to construct the yield-macro model. Tables 2 and 3 show the lagged correlations between the PCs of the three yield curves and the macroeconomic variables, annual realised inflation and annual GDP growth. The lag k value in the tables is the correlation between x[t] and y[t−k] where x[t] is the variable whose autocorrelation function has been printed in red and y[t−k] represents all the other variables. We use N, R and I as the abbreviations for the nominal, real and implied inflation spot rates, respectively. PC represents the PC. We assume that all the variables are stationary. Although we try to explain what the correlations between the variables mean economically, it is important to emphasise that the short period of available data might prevent us to make some clear interpretation about the relations between the yield curves and macro variables.
Lagged correlations between the quarterly yield curves and macro variables.
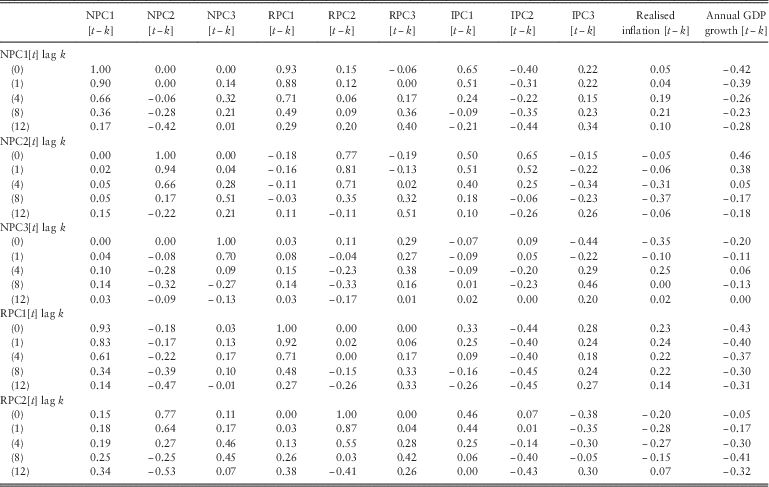
Lagged correlations between the quarterly yield curves and macro variables.
As we use quarterly data to construct the model, we have 69 observations and the standard error of the estimated coefficients is equal to  $$1/\sqrt {69} =0.12$$
. We assume that the coefficients that are greater or less than three standard errors (i.e. 3×0.12=0.36) are significant.
The level component of the nominal interest rates as a first variable in the tables shows a very high autocorrelation that decreases exponentionally. Thus, the level of the nominal interest rates highly depends on the value of the previous quarters. It has high simultaneous and lagged correlations with the levels of the real and implied inflation spot rates too. As the nominal interest rates can be decomposed into two parts containing the expected future inflation (implied inflation) and real interest rates, the high inflation expectations or high real interest rates lead to high nominal interest rates. Although we would expect a significant lagged correlation between the levels of the nominal interest rates and the realised, inflation because the level of the nominal yields is supposed to embody the inflation expectations, we could not find any significant correlations among these two variables. Both the frequency and the short period of data along with the relatively stable inflation rates might be the reasons for this. Looking at the correlation between the level of the nominal rates and real GDP growth, we see negative simultaneous and lagged correlations. These correlations can be explained considering the equilibrium in the goods market, which implies that an increase in the interest rate leads to a decrease in output (IS relation).
The slope factor of the nominal spot rates has positive simultaneous and lagged correlations with the slope factors of the real and implied inflation spot rates. The previous studies mostly connect the slope factor of the nominal rates with the GDP growth or output gap as we present in section 2. Although they find a negative correlation between these variables and explain the relation with the effect of the GDP growth on short-term interest rates (an increase in GDP growth increases the short-term interest rates by much larger amounts than the long-term interest rates, so that the yield curve becomes less steep and its slope decreases) our analysis show that the slope factor of the nominal rates and even the nominal spot rates themselves have positive correlation with the GDP growth. The positive correlation between the slope of the nominal rates and the GDP growth indicates that the increase in the GDP growth increases the nominal slope factor. Our empirical results are consistent with the findings of Chen (Reference Chen1991), Estrella & Hardouvelis (Reference Estrella and Hardouvelis1991), Harvey (Reference Harvey1988) and Hardouvelis & Malliaropulos (Reference Hardouvelis and Malliaropulos2004). These studies suggest that an increase in the nominal long-term relative to the nominal short-term interest rate is associated with an increase in real economic activity in the next four to six quarters into the future (see Hardouvelis & Malliaropulos, Reference Hardouvelis and Malliaropulos2004 for more references). The empirical findings of Hardouvelis & Malliaropulos (Reference Hardouvelis and Malliaropulos2004) using US data (the yield spread and the real GDP growth) suggest not only that the yield spreads (similar to the slope factors) are positively correlatated with the 1-year ahead GDP growth but also they are negatively correlated with 1-year ahead inflation. Tables 2 and 3 present similar results for the slope factor of the UK nominal yield curve with different time lags. Estrella & Hardouvelis (Reference Estrella and Hardouvelis1991) interpret the positive correlation between the yield spread and future output growth as arising from market expectations of future shifts in investment opportunities and/or consumption. Hardouvelis & Malliaropulos (Reference Hardouvelis and Malliaropulos2004) also discuss some empirical literature on the consumption-based capital asset pricing models that discuss the positive association between the nominal yield spread and output (consumption).
The slope factor of the implied inflation spot rates have significant positive simultaneous and lagged correlations with the annual real GDP growth. Realised inflation has significant simultaneous or lagged correlations with the nominal and implied inflation curvature factors and GDP growth. An increase in the nominal curvature factor, which means that the medium-term interest rates increased more than the short and long ends, causes a decrease in the realised inflation. However, an increase in the implied inflation curvature factor decreases the realised inflation.
3.3. Fitting a VAR model
After examining the correlations between the yield curves and macro variables we construct a VAR model for the series. We start with including the first two lags of each variable and eliminate the insignificant ones to obtain the best model. Furthermore, we avoid including simultaneous explanatory variables into the models because in forecasting we do not want to deal with additional uncertainty rooted by the simultaneous correlations.
To construct the yield-macro model, we use quarterly nominal spot rates, implied inflation spot rates, real spot rates, annual realised inflation and annual real GDP growth over the period March 1995 to March 2012.
Before introducing the models we describe how we obtain the PCs of the yield curves as time series in formulas.
Let X Q be the matrix of quarterly yield curve data where X QN implied nominal spot rates (69×49), X QR implied real spot rates (69×46) and X QI implied inflation spot rates (69×46).
The first three PCs can be obtained by decomposing the covariance matrix into the eigenvectors and eigenvalues. This decomposition can be shown for the nominal spot rates as below:
 $$U_{N}^{t} C_{N} U_{N} =L_{N} $$
where C N is the covariance matrix of the nominal spot rates (49×49), U N the matrix of eigenvector of C N (49×3) and L N the eigenvalues of C N (3×3) (diagonal matrix).
The eigenvectors extracted using equation (3) are called the loadings of the PCs. Using first three loadings that explain more than 99% of the variability in the data and the nominal yield curve data we obtain the first three PCs for the nominal rates:
 $$Q_{N} =X_{{Q_{N} }} U_{N} $$
where Q N is the PC of the quarterly nominal spot rates (69×3).
Let Q be the matrix of quarterly PCs and macroeconomic variables where Q NL is the level component of the nominal spot rates (69×1),  $$Q_{{N_{S} }} $$
the slope component of the nominal spot rates (69×1),
 $$Q_{{N_{C} }} $$
the curvature component of the nominal spot rates (69×1),
 $$Q_{{R_{L} }} $$
the level component of the real spot rates (69×1),
 $$Q_{{R_{S} }} $$
the slope component of the real spot rates (69×1),
 $$Q_{{R_{C} }} $$
the curvature component of the real spot rates (69×1),
 $$Q_{{I_{L} }} $$
the level component of the implied inflation spot rates (69×1),
 $$Q_{{I_{S} }} $$
the slope component of the implied inflation spot rates (69×1),
 $$Q_{{I_{C} }} $$
the curvature component of the implied inflation spot rates (69×1), Q RI the realised inflation (69×1) and Q GDP the real GDP growth (69×1).
The VAR structure of the quarterly model is:
 $$Q\left[ t \right]\,{\minus}\,\mu _{Q} =B_{1} \left( {Q\left[ {t\,{\minus}\,1} \right]\,{\minus}\,\mu _{Q} } \right){\plus}B_{2} \left( {Q\left[ {t\,{\minus}\,2} \right]\,{\minus}\,\mu _{Q} } \right){\plus}\epsilon_{Q} \left[ t \right]$$
where  $$\mu _{Q} $$
is the vector of long-run means of the variables, B 1 and B 2 the coefficient matrices for the first and second lags of the explanatory variables, respectively, and
 $$\epsilon_{Q} \left[ t \right]\,\sim\,\left( {0,\Sigma _{Q} } \right)$$
, i.e., residuals with zero mean and
 $$\Sigma _{Q} $$
variance–covariance matrix:
 $$Q=\left[ {\matrix{ {Q_{{N_{L} }} } & {Q_{{N_{S} }} } & {Q_{{N_{C} }} } & {Q_{{R_{L} }} \;\matrix{ {Q_{{R_{S} }} } & {Q_{{R_{C} }} } & {Q_{{I_{L} }} } & {Q_{{I_{S} }} \;\matrix{ {Q_{{I_{C} }} } & {Q_{{RI}} } & {Q_{{GDP}} } \cr } } \cr } } \cr } } \right]^{t} $$
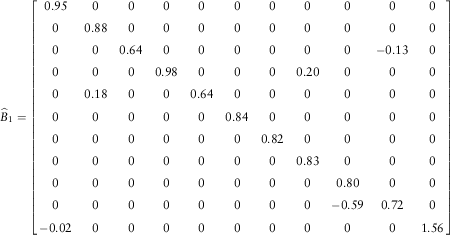
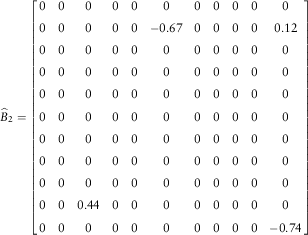
The estimated parameters after removing all values that are not significantly different from zero for our empirical data are:
 $$\widehat{\mu }_{Q}^{t} =\left[ {\matrix{ {{\minus}11.08} & {{\minus}0.34} & 0 & {{\minus}18.31} \cr } \;\;\matrix{ 0 & 0 & 0 & 0 \cr } \;\;\matrix{ 0 & {2.85} & {0.39} \cr } } \right]$$
 $$\widehat{B}_{1} =\left[ {\matrix{ {0.95} & 0 & 0 & 0 & 0 & 0 & 0 & 0 & 0 & 0 & 0 \cr 0 & {0.88} & 0 & 0 & 0 & 0 & 0 & 0 & 0 & 0 & 0 \cr 0 & 0 & {0.64} & 0 & 0 & 0 & 0 & 0 & 0 & {{\minus}0.13} & 0 \cr 0 & 0 & 0 & {0.98} & 0 & 0 & 0 & {0.20} & 0 & 0 & 0 \cr 0 & {0.18} & 0 & 0 & {0.64} & 0 & 0 & 0 & 0 & 0 & 0 \cr 0 & 0 & 0 & 0 & 0 & {0.84} & 0 & 0 & 0 & 0 & 0 \cr 0 & 0 & 0 & 0 & 0 & 0 & {0.82} & 0 & 0 & 0 & 0 \cr 0 & 0 & 0 & 0 & 0 & 0 & 0 & {0.83} & 0 & 0 & 0 \cr 0 & 0 & 0 & 0 & 0 & 0 & 0 & 0 & {0.80} & 0 & 0 \cr 0 & 0 & 0 & 0 & 0 & 0 & 0 & 0 & {{\minus}0.59} & {0.72} & 0 \cr {{\minus}0.02} & 0 & 0 & 0 & 0 & 0 & 0 & 0 & 0 & 0 & {1.56} \cr } } \right]$$
 $$\widehat{B}_{2} =\left[ {\matrix{ 0 & 0 & 0 & 0 & 0 & 0 & 0 & 0 & 0 & 0 & 0 \cr 0 & 0 & 0 & 0 & 0 & {{\minus}0.67} & 0 & 0 & 0 & 0 & {0.12} \cr 0 & 0 & 0 & 0 & 0 & 0 & 0 & 0 & 0 & 0 & 0 \cr 0 & 0 & 0 & 0 & 0 & 0 & 0 & 0 & 0 & 0 & 0 \cr 0 & 0 & 0 & 0 & 0 & 0 & 0 & 0 & 0 & 0 & 0 \cr 0 & 0 & 0 & 0 & 0 & 0 & 0 & 0 & 0 & 0 & 0 \cr 0 & 0 & 0 & 0 & 0 & 0 & 0 & 0 & 0 & 0 & 0 \cr 0 & 0 & 0 & 0 & 0 & 0 & 0 & 0 & 0 & 0 & 0 \cr 0 & 0 & 0 & 0 & 0 & 0 & 0 & 0 & 0 & 0 & 0 \cr 0 & 0 & {0.44} & 0 & 0 & 0 & 0 & 0 & 0 & 0 & 0 \cr 0 & 0 & 0 & 0 & 0 & 0 & 0 & 0 & 0 & 0 & {{\minus}0.74} } } \right]$$
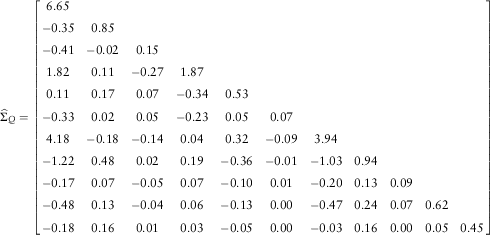 $$\widehat{\Sigma }_{Q} =\left[ {\matrix{ {6.65} & {} & {} & {} & {} & {} & {} & {} & {} & {} & {} \cr {{\minus}0.35} & {0.85} & {} & {} & {} & {} & {} & {} & {} & {} & {} \cr {{\minus}0.41} & {{\minus}0.02} & {0.15} & {} & {} & {} & {} & {} & {} & {} & {} \cr {1.82} & {0.11} & {{\minus}0.27} & {1.87} & {} & {} & {} & {} & {} & {} & {} \cr {0.11} & {0.17} & {0.07} & {{\minus}0.34} & {0.53} & {} & {} & {} & {} & {} & {} \cr {{\minus}0.33} & {0.02} & {0.05} & {{\minus}0.23} & {0.05} & {0.07} & {} & {} & {} & {} & {} \cr {4.18} & {{\minus}0.18} & {{\minus}0.14} & {0.04} & {0.32} & {{\minus}0.09} & {3.94} & {} & {} & {} & {} \cr {{\minus}1.22} & {0.48} & {0.02} & {0.19} & {{\minus}0.36} & {{\minus}0.01} & {{\minus}1.03} & {0.94} & {} & {} & {} \cr {{\minus}0.17} & {0.07} & {{\minus}0.05} & {0.07} & {{\minus}0.10} & {0.01} & {{\minus}0.20} & {0.13} & {0.09} & {} & {} \cr {{\minus}0.48} & {0.13} & {{\minus}0.04} & {0.06} & {{\minus}0.13} & {0.00} & {{\minus}0.47} & {0.24} & {0.07} & {0.62} & {} \cr {{\minus}0.18} & {0.16} & {0.01} & {0.03} & {{\minus}0.05} & {0.00} & {{\minus}0.03} & {0.16} & {0.00} & {0.05} & {0.45} \cr } } \right]$$
The negative long-run means for the level factors of the yield curves displayed in  $$\mu _{Q} $$
show that these factors have been decreasing since 1995. It should be emphasised that the series we model are not the levels of the yield curves but the factors that affect the levels of the yield curves. Thus, it is not surprising that we obtain negative values for the long-run mean of these factors. When we analyse the three yield curves we see that the spot rates have been decreasing since 1995, independent from the maturity. Since the estimated long-run means of the level factors are negative the results coincide with the information provided by the original data. On the other hand, the long-run mean for the realised inflation is about 3%.
When we look at the matrix  $$\widehat{B}_{1} $$
, although there are some off-diagonal values, the diagonal structure of the matrix shows how strong the AR(1) effect is in the models. Similarly, few number of values in
 $$\widehat{B}_{2} $$
shows that the second lags are mostly insignificant.
We display the estimated correlation matrix,  $$\widehat{\rho }_{Q} $$
for the residuals below. As stated previously, we assume that the coefficients that are greater or less than three standard errors (0.36) are significant. We see several significant correlations between the residuals in matrix
 $$\widehat{\rho }_{Q} $$
as in the yield-only model of Şahin et al. (Reference Şahin, Cairns, Kleinow and Wilkie2014). One reason is that we exclude the simultaneous explanatory variables in the modelling work. As we observe in Tables 2 and 3, there are significant simultaneous correlations particularly between the corresponding PCs of the three yield curves. The high correlations between the residuals for the level and slope factor models may be owing to these strong simultaneous correlations between the level and slope PCs. Although the PCs themselves are independent within each yield curve, there are strong correlations between the different factors of residuals of the different spot rates. This might be some statistical artefact that does not really indicate a correlation between those two set of residuals.
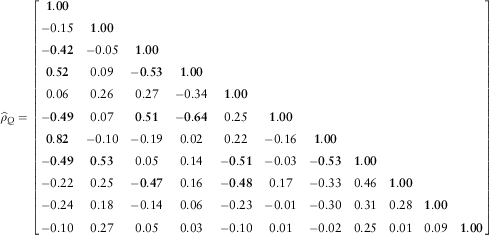 $$\widehat{\rho }_{Q} =\left[ {\matrix{ {\bf 1.00} & {} & {} & {} & {} & {} & {} & {} & {} & {} & {} \cr {{\minus}0.15} & {\bf 1.00} & {} & {} & {} & {} & {} & {} & {} & {} & {} \cr {\bf {\minus}0.42} & {{\minus}0.05} & {\bf 1.00} & {} & {} & {} & {} & {} & {} & {} & {} \cr {\bf 0.52} & {0.09} & {\bf {\minus}0.53} & {\bf 1.00} & {} & {} & {} & {} & {} & {} & {} \cr {0.06} & {0.26} & {0.27} & {{\minus}0.34} & {\bf 1.00} & {} & {} & {} & {} & {} & {} \cr {\bf {\minus}0.49} & {0.07} & {\bf 0.51} & {\bf {\minus}0.64} & {0.25} & {\bf 1.00} & {} & {} & {} & {} & {} \cr {\bf 0.82} & {{\minus}0.10} & {{\minus}0.19} & {0.02} & {0.22} & {{\minus}0.16} & {\bf 1.00} & {} & {} & {} & {} \cr {\bf {\minus}0.49} & {\bf 0.53} & {0.05} & {0.14} & {\bf {\minus}0.51} & {{\minus}0.03} & {\bf {\minus}0.53} & {\bf 1.00} & {} & {} & {} \cr {{\minus}0.22} & {0.25} & {\bf {\minus}0.47} & {0.16} & {\bf {\minus}0.48} & {0.17} & {{\minus}0.33} & {0.46} & {\bf 1.00} & {} & {} \cr {{\minus}0.24} & {0.18} & {{\minus}0.14} & {0.06} & {{\minus}0.23} & {{\minus}0.01} & {{\minus}0.30} & {0.31} & {0.28} & {\bf 1.00} & {} \cr {{\minus}0.10} & {0.27} & {0.05} & {0.03} & {{\minus}0.10} & {0.01} & {{\minus}0.02} & {0.25} & {0.01} & {0.09} & {\bf 1.00} \cr } } \right]$$
Residual analysis show that the means are zero or very close to zero and the standard deviations are quite small except for the level factors of the yield curves. Most of the distributions of the residuals pass one or the other normality tests such as Jarque–Bera test or Kolmogorow–Smirnov test, but there are some violations, particularly, the curvature factors models of the real and implied inflation spot rates.
3.4. Yield-macro model versus RW and AR(1) process
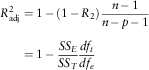
We model the yield curve factors considering the relation between the three yield curves and macroeconomic variables. However, these factors might be modelled as RW or AR(1) process. As we added some explanatory variables to construct the yield-macro model we need to show that our model performs better than the RW and AR(1) without the macroeconomic variables. In order to examine the goodness-of-fit of the yield-macro model and to discuss the performance of the model with respect to RW and AR(1) process we calculate the adjusted coefficient of determinations,  $$R_{{{\rm adj}}}^{{\rm 2}} $$
Footnote 3. Therefore, to compare our models with the RW and AR(1) we calculate the following ratios:
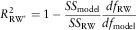 $$R_{{{\rm RW}^{{\asterisk}} }}^{2} =1\,{\minus}\,{{SS_{{{\rm model}}} } \over {SS_{{{\rm RW}}} }}{{df_{{{\rm RW}}} } \over {df_{{{\rm model}}} }}$$
or
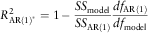 $$R_{{{\rm AR}(1)^{{\asterisk}} }}^{2} =1\,{\minus}\,{{SS_{{{\rm model}}} } \over {SS_{{{\rm AR}(1)}} }}{{df_{{{\rm AR}(1)}} } \over {df_{{{\rm model}}} }}$$
where SS model is the sum of squares of the residuals obtained from the yield-macro model, SS RW the sum of squares of the residuals obtained from the RW model, SS AR(1) the sum of squares of the residuals obtained from the AR(1) model and df the degrees of freedom.
The use of exogenous variables such as GDP growth might be criticised in asset modelling. The main argument against their use is that, while they may have a significant effect on the modelled variables in the short term, in the long term they merely constitute another noise term (Thomson, Reference Thomson1996). However, considering the proposed yield-macro model, the GDP growth has an autoregressive term that carries its effect on the nominal slope factor many years ahead into the future.
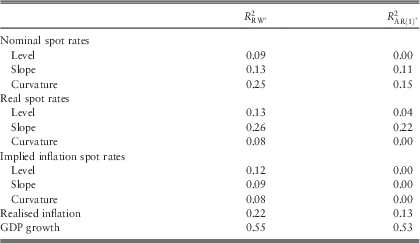
Table 4 shows the increase in the explained variability in the models compared to RW and AR(1) process. Zeroes in the table indicate that the fitted models are already AR(1). The table presents some non-negative values that indicate that the proposed models are superior to the RW and AR(1) process. However, the improvements in the explained variability are not always significant as it is seen in the curvature factor of the real spot rates. Nominal slope and curvature models explain significant amount of variability comparing with the RW and AR(1) models. Real slope model improves the explained variability for about 26% and 22% compared with the RW and AR(1), respectively. Realised inflation model performs better when it includes the nominal and implied inflation curvature factors’ lagged values as explanatory variables. GDP growth model performs much better than the RW and AR(1) with the help of nominal level factor and second lag of GDP growth as explanatory variables.
Model comparisons with the random walk (RW) and autoregressive order one (AR(1)) process.
3.5. Forecasting
After modelling the PCs along with the macroeconomic variables, we test these models by forecasting one-quarter ahead spot rates, realised inflation and the GDP growth using the estimated parameters. In order to compare the forecasts with the fitted spot rates and the macroeconomic variables we have fitted the models to the data recursively; starting with first 32 quarters and ending with 68 quarters. As we increase the data period, we apply the PC analysis, re-fit the model and estimate the parameters for that period. Afterwards, we use the parameters for each period to forecast the next quarter’s level, slope and curvature factors of the spot rates. As a final step, we convert the forecasts for PCs into the spot rates, i.e., we obtain the fitted spot rates by using these three PCs. Furthermore, we calculate the variance–covariance matrix of the residuals for each set of recursive estimates to construct the 95% confidence intervals for the forecasts under the normally distributed residuals assumption.
Figures 1–7 display the one-quarter ahead forecasts along with the 95% confidence intervals and forecast errors for the yield curves and the macroeconomic variables. The graphs show that the differences between the hybrid and forecasted spot rates decrease as the maturity insreases. Although the forecasts seem like an RW model forecasts, the models are better than RW in terms of explained variability in the data as examined previously. As almost all of the observations are within the confidence bands we might suspect that the confidence intervals are too wide.
One-quarter ahead forecasts with upper and lower confidence limits for nominal spot rates (%).
Difference between the observed and forecasted nominal spot rates (%).
One-quarter ahead forecasts with upper and lower confidence limits for real spot rates (%).
Difference between the observed and forecasted real spot rates (%).
One-quarter ahead forecasts with upper and lower confidence limits for implied inflation spot rates (%).
Difference between the observed and forecasted implied inflation spot rates (%).
One-quarter ahead forecasts with upper and lower confidence limits for realised inflation (%) and GDP growth.
3.6. Fisher relation
As it is done for the yield-only model in Şahin et al. (Reference Şahin, Cairns, Kleinow and Wilkie2014), we check whether the Fisher relation holds for the yield-macro model one-quarter ahead forecasts. Figures 8 and 9 present the graphs of the forecasts and the forecast errors for both the yield curves and the ones obtained by using the Fisher relation. Although the forecast graph show that the yield curve forecast for each yield curve and the yield curves derived by the Fisher relation seem quite close, the error graph shows that the difference is about 2% for the shortest maturity but it decreases as the maturity of the forecasts increases.
Fisher relation check for the one-quarter ahead nominal spot rate forecasts (%).
Errors for the Fisher relation check for the one-quarter ahead nominal spot rate forecasts (%).
4. Comparison of the Wilkie Model and the Yield-Macro Model
We compare the Wilkie model and the yield-macro model in both structural and empirical ways.
The Wilkie stochastic investment model, developed by A. D. Wilkie, is described fully in two papers: the original version is described in “A stochastic investment model for actuarial use” (Wilkie, Reference Wilkie1986) and the model is reviewed, updated and extended in “More on a stochastic asset model for actuarial use” (Wilkie, Reference Wilkie1995).
The original Wilkie (Reference Wilkie1986) model was developed from UK data over the period 1919–1982, and was made up of four interconnected models for price inflation, share dividend yields, share dividends and long-term interest rates. Wilkie (Reference Wilkie1995) updated the original model and extended it to include an alternative autoregressive conditional heteroscedastic model for price inflation, and models for wage inflation, short-term interest rates, property yields, and income and index-linked yields. Furthermore, these models were fitted to data from numerous developed countries and an exchange rate model was proposed. Sahin et al. (Reference Sahin, Cairns, Kleinow and Wilkie2008) and Wilkie et al. (Reference Wilkie, Sahin, Cairns and Kleinow2010) reviewed the Wilkie asset model for a variety of UK economic indices in each case by updating the parameters to June 2009. They discussed how the model has performed from 1994 to 2009 and estimated the values of the parameters and their confidence intervals over various sub-periods to study their stability. Their analysis shows that the residuals of many of the series are much fatter-tailed than in a normal distribution. They observe also that besides the stochastic uncertainty built into the model by the random innovations there is also parameter uncertainty arising from the estimated values of the parameters. We use the updated parameters presented in Wilkie et al. (Reference Wilkie, Sahin, Cairns and Kleinow2010) for the Wilkie model in this comparison.
4.1. Structural comparison
The frequency of the data used is an important feature that distinguishes the models. The Wilkie model has been constructed on yearly data while the yield-macro model is based on quarterly data. The reason for using quarterly data for the yield-macro model is that the GDP growth is available on a quarterly frequency.
The historical data for the series used in the Wilkie model have been available since the 1900s while the term structures of the interest rates and implied inflation are available since the 1980s. Using different periods of data for the two models affects the parameters estimated due to different economic conditions experienced in those periods. This also affects the simulations produced for the future years. In order to make the two models exactly comparable, we introduce “neutral” initial conditions and “neutralised” parameters for the models and we use the same initial values as for the state variables to simulate the future in the next sections. Neutral initial conditions were introduced in Wilkie (Reference Wilkie1986) without giving any formal definition but the values he gives can be defined in either of two ways, either as the values to which certain variables would tend if the model were to be projected forward from any starting point with no future innovations, or, with the same results, as the values which, if used as initial conditions and projected forward with no future innovations, would remain unchanged. Alternative definitions of the neutral initial conditions can be the long-run, or unconditional, mean of the values. As for neutralising parameters we choose values of the parameters, in particular, the means of the series, so that the market conditions at any date are the neutral initial conditions for those parameters as in Lee & Wilkie (Reference Lee and Wilkie2000).
Another distinguishing feature is the output variables the models produce. Figures 10 and 11 display the structures of the Wilkie model and the yield-macro model, respectively. Figure 10 shows that the Wilkie model has a cascade structure and the price inflation is the driving force of the model. It includes wage inflation, share dividend yields, share dividends, share prices, long-term and short-term interest rates and index-linked yields. On the other hand, the yield-macro model in Figure 11 is composed of the term structures of nominal, implied inflation and real spot rates along with the realised inflation and the GDP growth as macroeconomic variables. Thus, while we exclude the share dividends, dividend yields and share prices and also wage inflation we incorporate two new variables, namely, implied inflation and the GDP growth. In addition, we model the entire term structures by modelling the PCs rather than just the two ends of the yield curves.
Structure of the Wilkie model.
Structure of the yield-macro model.
Incorporating new variables has also changed the structure of the model. The price inflation is not the driving force of the yield-macro model because the nominal spot rates and implied inflation spot rates have influences on it. Thus, the use of different variables not only changes the structure of the models but also changes the nature of the relations between the model variables. One of the main features of the yield-macro model proposed in this paper is the bidirectional relations between the yield curve factors and the macroeconomic variables.
When we consider the similarities between these two models, besides indicating some common factors such as price inflation, nominal and index-linked yields, we might go further and associate particular variables with the factors used in the yield-macro model. First of all, both models include the nominal interest rates. The consols yield in the Wilkie model can be considered as an equivalent of the “level” and the “log spread”, BD(t)=ln C(t) – ln B(t) (the difference of the logarithm of the long-term and short-term interest rates), as the equivalent of the “slope” of the nominal yield curve in the yield-macro model. However, we additionally include the “curvature” factor of the nominal spot rates in our model.
It is possible to discuss the model formulae too. While the nominal slope factor BD(t) has been modelled as an AR(1) process in the Wilkie model, the real curvature factor and GDP growth have been found significant in the nominal slope model as a part of the yield-macro model. Including two more explanatory variables we see that the yield-macro model performs significantly better than the AR(1) model of Wilkie.
Wilkie’s index-linked yield model might be compared with the “real level factor” model of the yield-macro model. Wilkie (Reference Wilkie1995) models the index-linked yields including the residuals obtained from the consols yield model. This is consistent with the significant correlation between the residuals of the level factors of the nominal and real spot rates.
4.2. Empirical comparison
4.2.1. Simulated ZC yields
We can also compare the ZC bond yields for different maturities and different forecast years obtained from the two models. In order to do such a comparison: first, we simulate the short- and long-term interest rates of the Wilkie model. Using these simulated values we construct the par yield curve for each year using the following equation, which is defined in Lee & Wilkie (Reference Lee and Wilkie2000) and Wilkie et al. (Reference Wilkie, Waters and Yang2003)
 $$Y(t,\,n)=C(t){\plus}(B(t){\minus}C(t))\exp ({\minus}\beta n)$$
where Y(t, n) is the par yield at time t for term n, B(t) the base rate, C(t) the consols yield from the Wilkie model and β a constant whose value will be given later. We then derive the ZC rates, at annual intervals, recursively, as follows:
Let v(t, n) be the value at time t of a ZC bond of term n.
Then the value of a coupon bond of term n, currently priced at par, with coupon equal to the par yield Y(t, n), and redeemable at par, means that we have, for each n:
 $$1=Y(t,\,n)\mathop{\sum}\limits_{m\,=\,1}^n v(t,m){\plus}v(t,n)$$
Given the values of Y(t, n), we can use equation (6) to derive the v(t, n) recursively.
Starting with n=1, we have
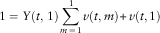 $$1=Y(t,\,1)\mathop{\sum}\limits_{m\,=\,1}^1 v(t,m){\plus}v(t,1)$$
whence  $$v(t,\,1)=1/(Y(t,1){\plus}1)$$
.
We continue year by year:
 $$1=Y(t,n)\mathop{\sum}\limits_{m\,=\,1}^{n\,{\minus}\,1} v(t,m){\plus}(1{\plus}Y(t,n))v(t,n)$$
whence  $$v(t,\,n)={{\left( {1{\minus}Y(t,n)\mathop{\sum}\nolimits_{m\,=\,1}^{n\,{\minus}\,1} v(t,m)} \right)} \mathord{\left/ {\vphantom {{\left( {1{\minus}Y(t,n)\mathop{\sum}\nolimits_{m=1}^{n{\minus}1} v(t,m)} \right)} {(1{\plus}Y(t,n))}}} \right. \kern-\nulldelimiterspace} {(1{\plus}Y(t,n))}}$$
.
From the values of v(t, n) we can derive a ZC yield curve:
 $$Z(t,\,n)={1 \over {v(t,\,n)^{{1/n}} }}\,{\minus}\,1$$
Wilkie et al. (Reference Wilkie, Waters and Yang2003) indicate a problem about this approach that we have encountered in our calculations too. When calculating the ZC discount factor v(t, n), the sum of the values of the coupons from years 1 to n−1,  $$Y(t,\,n)\mathop{\sum}\nolimits_{m=1}^{n{\minus}1} v(t,\,m)$$
, might exceed unity, so that the calculated value of the ZC discount factor v(t, n) is negative. This unsatisfactory condition happens when, for longer maturities, the par yield is still rising noticeably, and this happens when, with equation (5), the value of β is too low for the particular values of B(t) and C(t). Therefore, we have to choose a value of β that is large enough to prevent this anomaly from happening, at least within the first 35 years (the period for investing in ZC bonds in this application). We find that a value of β=0.55 is large enough considering the initial values and the simulations for our calculations. Indeed, Wilkie et al. (Reference Wilkie, Waters and Yang2003) use β=0.39 and Yang (Reference Yang2001) uses a value of β=0.5. Although we start with the value of 0.1 for β, we have had to increase it up to 0.55 to avoid negative or zero-discount factors for the ZC bonds. Using a high value of β produces a very flat yield curve, rather little different from using a constant interest rate of C(t). However, β=0.55 is the lowest value that does not give us inconsistencies.
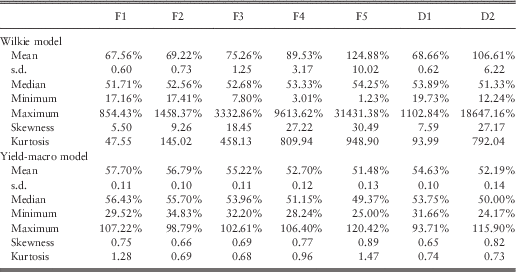
Figure 12 displays the ECDFs of the ZC yield curves based on 1,000 simulations for different maturities and different years from the two models. The ECDFs for the ZC yields for the first forecast year, t=1, seem rather similar for the two models although the simulations obtained from the Wilkie model have a wider spread. At time t=1, as the maturity increases the ECDFs get closer. On the other hand, as we simulate the yield curves for further years the standard deviations decrease for both models while the means remain almost the same. There are some high ZC bond yields for the forecast years t=15 and 35 in the simulated values using the Wilkie model. Figure 12 indicates that the distributions of the ZC yields obtained from the two models become different as the maturity and the forecasting years increase. The calibration periods and the structures of the models might explain the differences observed in Figure 12. The parameters of the yield-macro model have been calculated based on a much more stable period. Therefore, it is not surprising that the distributions of the ZC bond yields or any other simulated variables are less skewed or humped than the simulated Wilkie model variables. Furthermore, the structural differences between these two models also affect the simulation results. One of the main advantages of the yield-macro model over the Wilkie model is that the yield-macro model forecasts the entire yield curves. When we try to construct the ZC yield curve using the Wilkie model we see that there are some high ZC bond yields for reasons that have been discussed previously.
Empirical cumulative distribution functions for the simulated zero-coupon bond yields.
4.2.2. Asset values and annuity payoffs
Another way to compare the Wilkie model and the yield-macro model is to examine the asset values and the annuity payoffs under a hypothetical pension scheme. Although a more realistic application would include mortality, we ignore it during both the investment and the retirement periods for simplicity in this analysis.
We assume an employee at age 30, with an arbitrary initial salary S. The salary increases according to the simulated RPI index for the next 35 years and the employee retires at age 65. She contributes a constant fraction of her salary ƒ to a pension fund that is invested into a portfolio of nominal bonds for different maturities. We ignore mortality during both the investment and the retirement period, which is taken as a fixed 25 years, and we analyse the variations in the assets and annuity payoffs.
Let v(t, n) be the price of an n-year ZC bond at time t:
 $$v(t,\,n)={1 \over {(1{\plus}Z(t,\,n))^{n} }}$$
where Z(t, n) is the n-year spot rate at time t.
Salary rises in line with RPI(t) and contributions are a constant fraction, ƒ, of salary. Thus, the yearly contribution C t is
 $$C_{t} =S{\times}f{\times}{{{\rm RPI}(t)} \over {{\rm RPI}(0)}}$$
where S=10,000 units, ƒ=10% and RPI(t) values are simulated using the stochastic models.
Thus, the asset value just before the contribution at time t, A t, can be calculated as
 $$A_{t} =\left( {A_{{t{\minus}1}} {\plus}C_{{t{\minus}1}} } \right)\mathop{\underbrace{{{{v(t,n\,{{\minus}}\,1)} \over {v(t\,{{\minus}}\,1,n)}}}}}\limits_{1{\plus}R(t)}$$
where A 0=0 and R(t) is the return at time t. Equation (9) assumes investment in a rolling n-year ZC bond fund.
Once we calculate the asset values over time, we can find the annuity payoffs for the 25 years retirement period using the ZC yield curves at age 65, i.e., the simulated yield curve at year 35. We assume that the annuity is paid yearly in advance.
Let ap be the annuity payoff. Then
 $$A_{{35}} =ap{\times}\ddot{a}(35,N)$$
where  $$\ddot{a}$$
(35, N) is the annuity price for 1 unit:
 $$\ddot{a}(35,\,N)=\mathop{\sum}\limits_{m\,=\,0}^{N\,{\minus}\,1} (1{\plus}Z(35,m))^{{{\minus}m}} =\mathop{\sum}\limits_{m\,=\,0}^{N\,{\minus}\,1} v(35,\,m)$$
where N=25 and Z(35, N) is the ZC yield curve at t=35.
We calculate the asset values under different investment strategies for both models. We assume rolling investments in ZC bonds for specific maturities such as 5-year (F1), 10-year (F2), 15-year (F3), 20-year (F4) and 25-year (F5) ZC bonds. We consider two more scenarios which we invest on decreasing maturity for some years of the investment period. First, we invest in 25-year ZC bonds for the first 10 years, then for the last 25 years instead of a rolling investment we use the ZC yield curve to calculate the returns on decreasing maurities (D1). Second, we again invest in 25-year ZC bonds but for a longer period, 25 years, then for the last 10 years we invest in decreasing maturity bonds (D2). While in D1 the maturity of the assets at time t=35 corresponds to the retirement date, in D2 the maturity of the assets is 15 years at the retirement date. With D2 we try to hedge the risk in the annuity price,  $$\ddot{a}(35,N)$$
. On the other hand, a more realistic strategy might be to assume deterministic mortality and an investment policy that aims to match the expected annuity payoffs more exactly by buying small fraction of bonds of different maturities.
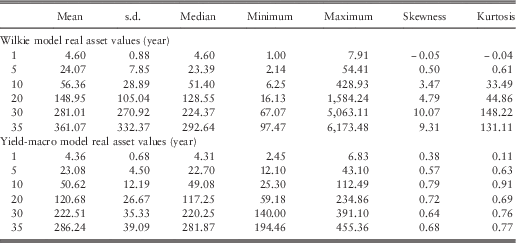
Table 5 shows some descriptive statistics for the real asset values calculated using the first “decreasing maturity” investment strategy (D1) for both models over the next 35 years. Although the mean of the real asset values obtained from the Wilkie model grows faster than the values of the yield-macro model, the medians for different years are quite close to each other. The higher standard deviations, skewness and excess kurtosis coefficients indicate that Wilkie model tends to produce some extreme values relative to the yield-macro model. The minimum and maximum values displayed over the years also support this conclusion.
Real asset values, A t, on a decreasing maturity (D1) investment.
Figure 13 shows the real asset values for different investment strategies over the years. The yield-macro model produces lower mean values than the Wilkie model after the 1st year but while the difference is negligible for 5-year (which has not been displayed in the figure) and 10-year ZC bond investments, the difference increases as the maturity of the invested bond increases. For the investment on the 25-year ZC bond the Wilkie model produces very high values. After 15 years investment the Wilkie model asset values increase sharply that might be related with very low ZC discount factors. As it is mentioned previously, choosing β=0.55 prevents negative discount factors but some of them are still very close to zero. These low values mean that the ZC bond prices are very low for some specific maturities and years and this causes extreme values in returns considering the rolling investment strategies. The last two plots in Figure 13 show the asset values for the decreasing maturity investments. Since we invest in 25-year ZC bonds only for 10 years, the real annuity payoffs of the models are relatively close in D1 while they are quite different in D2 as a result of much longer investment period on the 25-year ZC bonds.
The mean amount of real assets for different investment strategies.
Table 6 presents some descriptive statistics for the nominal annuity payoffs as a percentage of final salary for both models. As for the Wilkie model, the mean and the standard deviation of the ratio have been increasing as we use a longer term bond for investment. The significant differences between the means and the medians indicate that there are some extreme values that affect the ratios. The ratios are positively skewed and the excess kurtosis coefficients are exceptionally high. On the other hand, the means and the medians for the yield-macro model are not very different from each other. The standard deviations seem stable and the ratios are slightly positively skewed. Although the excess kurtosis coefficients are much lower than the ones in the Wilkie model, they are significantly high for the ratios obtained from some of the investment strategies.
Annuity payoffs as a % of final salary.
We might also compare the distributions of these ratios graphically. Figure 14 displays the ECDFs of the annuity payoffs as a percentage of final salary for different investment strategies for the models. As we know that the annuity payoffs obtained from the Wilkie model have some extreme values we exclude the ratios lower than 5% and higher than 200% to draw the ECDFs. Regardless of the portfolio chosen, the payoff ratios calculated using the Wilkie model are more dispersed than the ratios obtained from the yield-macro model due to more volatile calibration period and the structure of the model.
The empirical cumulative distribution functions of the annuity payoffs as a % of final salary.
Figures 15 and 16 show the scatter plots for the asset/salary ratios and annuity prices ( $$\ddot{a}(35,N)$$
) on a horizontal log scale for the Wilkie model and the yield-macro model, respectively. We have omitted extremely high values for the Wilkie model in Figure 15 but there are still very high and very low values that increase the spread of the plots. As the maturity of the invested ZC bond extends the correlation between the ratios and the annuity price increases in both figures. As for the decreasing maturity investment strategies, D1 and D2, the correlations seem stronger for D2 at least for the Wilkie model. The reason is that having 15-year ZC bonds as assets at retirement hedges the risk in the annuity price,
 $$\ddot{a}(35,N)$$
better. However, the correlations are relatively weak for both D1 and D2 suggesting that this type of strategy does not work all that well, at least looking ahead from time t=0.
Asset/salary versus price (25-year zero-coupon bond), Wilkie model.
Asset/salary versus price (25-year zero-coupon bond), yield-macro model.
5. Conclusions
In this paper we have constructed an yield-macro model using quarterly yield curves and macroeconomic variables. Our analysis showed that the macro variables and the yield curve factors are significantly correlated. We found that there is bidirectional relation between the yield curve factors and realised inflation and GDP growth. Although the forecasts obtained from the yield-macro model seem close to RW forecasts, our models perform better than the RW and AR(1) process in terms of the explained variability in the data.
We have also compared the Wilkie model and the yield-macro model in both structural and empirical ways. Owing to incorporating different input variables, the models have different structures and the nature of the relations between these variables is also different. As the two models were developed based on different periods of data we use the neutral initial conditions of the yield-macro model for the Wilkie model and we adjust the mean parameters of the inflation and interest rates models of Wilkie according to these initial conditions. Therefore, we have made the two models exactly comparable. Then we simulate the ZC bond yields to analyse their distributions. As the parameters of the yield-macro model have been calculated based on a much more stable period the distributions of the ZC bond yields or any other simulated variables are less skewed or humped than the simulated Wilkie model variables. The structural differences between these two models also affect the simulation results. One of the main advantages of the yield-macro model over the Wilkie model is that the yield-macro model forecasts the entire yield curves. Constructing the ZC yield curve using the Wilkie model might also produce very high ZC bond yields.
Then we compared the asset values and annuity payoffs for the two models under a hypothetical pension scheme. The results show that the Wilkie model produces higher asset values (including some extreme values) for different portfolios and the volatilities have been much higher than the ones obtained from the yield-macro model. This is due to small values of the ZC discount factors that have caused extremely high returns for the chosen investment strategy. The distribution of the ratios are positively skewed with very high kurtosis coefficients while the yield-macro model produce much more stable ratios. Finally, we have compared the annuity payoffs as a percentage of final salary for each model and for each portfolio. When we omit the extreme values for the Wilkie model, the distribution of the ratios seem similar in terms of means but the standard deviations of the ratios from the Wilkie model are still higher. Furthermore, the correlation between the asset/salary ratios at retirement and the annuity price increases as the maturity of the bond invested increases.
Acknowledgement
We wish to thank the anonymous referees for their helpful suggestions on an earlier version of this paper.