Introduction
Thinning in apple orchards is a commonly used technique for improving yield, size to quantity, regularity and fruit quality. Chemical thinning is performed in the flowering stage and the ripening stage. A number of effective chemical thinning agents are available. Nevertheless, thinning is still mostly carried out through expensive manual labor due to the fear of over thinning. Moreover, for tree-specific thinning management, individual evaluation of trees is necessary.
In apple orchards, intermittence phenomena occur. Flower and fruit thinning is a way of reducing its effect. In order to narrow or even prevent the intermittence, thinning is conducted at a precise time, with a precise quantity and precise distribution. Because the tree offers only a small time window to do so, the processes associated with bloom intensity evaluation up to individual tree application have to be fast and efficient.
Automatic estimation of bloom intensity can drive variable rate sprayers that apply the required volume of chemical. A number of papers report methods for VRA of sprays: an automatic selection of vertical spray pattern in orchard sprayer (Tamagnone et al., Reference Tamagnone, Balsari and Bozzer2013) was developed, to optimize the spray distribution. The sprayer identifies the characteristics of different parts of the tree (from stem to canopy) to control the substance distribution on the tree. A spray nozzle characterization using high speed imaging techniques (Vulgarakis et al., Reference Vulgarakis, Cointault, Vangeyte, Pieters and Nuyttens2015) showed options associated with the quantity and density control of nozzles.
The task of flower identification has been addressed. A hyperspectral wavelength selection for detecting floral pear buds (Wouters et al., Reference Wouters, De Baerdemaeker and De Ketelaere2013) was developed for thinning in pear orchards. A system to evaluate the number of flower clusters on an apple tree using a digital camera and HSL color coding has also been developed (Hocevar and Sirok, Reference Hočevar, Širok, Godeša and Stopar2014). However, only flower clusters were counted, without determining the best timing of thinning or the bloom phase of the tree.
The objective of this work was to develop an agricultural tool based on color images of the trees, which identifies the level of bloom for individual trees in the orchard in order to estimate the timing of peak bloom and its intensity. This information can provide guidance for thinning in the terms of quantity, density and timing of sprays.
Materials and methods
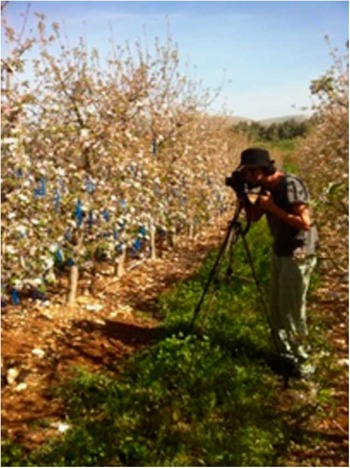
Image acquisition campaigns were conducted at the beginning of April 2014, starting when the first signs of bloom appeared, until two days past the bloom peak. This resulted in a period of 10 days. During this time period RGB images of each tree were acquired daily to estimate the number of flowers (Figure 1). The research was carried out in an experimental orchard of the Agricultural Research Organization (Volcani Center, Israel) at Matityahu farm in the Western Galilee area. The orchard was 680 m above sea level. A plot with Golden Delicious apple trees was selected, with rows in a N-S orientation. The distance between rows was 3 m and the interval between trees in the row was 1.5 m. The trees were between 1.90 to 3 m high. Flower clusters at full bloom time on Golden Delicious are similar to other apple cultivars with 4–6 individual flowers in the cluster that open gradually throughout the bloom period. Two rows were selected for measurements and image acquisition, which contained 70 trees.
Image acquisition: a camera mounted on a tripod, directed towards the trees’ canopy.

Each day, the 70 trees were measured. The blooming intensity of each tree was also manually evaluated: buds were marked on selected branches and the number of open flowers was recorded daily. In addition, the blooming intensity of each tree was estimated daily by an experienced expert during the same period. Blooming intensity scale was between 1 to 5
For this experiment, a Canon 6D stills camera was used (20.2 megapixels) with Canon’s 24mm prime lens. A polarizer filter was added in font of the lens during the 2015 season, in order to prevent specular reflectance. The camera was place on a tripod, about 1.5 m away from the trees. The optical setup enabled the whole tree to be captured in one frame, with a resolution of about 0.4 mm per pixel. The above dimensions allow a tree, ~1.5 meters wide and 2.25 meters tall, to be imaged in a 5472*3648 pixel picture. Assuming an average flower has a radius of 2 cm, it is represented by about 7400 pixels.
The camera has a built in GPS sensor and all images were geo-located, in order to enable mapping of the orchard variability. Due to the sun’s southern angle in April, which is the bloom time, the best hours for image acquisition were from 9:00 to 12:30, when the sun is not in the frame and the light colors are green and blue.
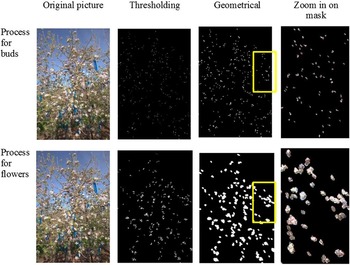
The images were processed using MatlabTM. Different thresholds and geometrical filters were used in order to detect flowers and buds and to exclude background noise (Gabbor filter, Singh and Glennen, Reference Singh and Glennen2005). Using different red levels threshold allowed the separation of buds (dark red) from open flowers (pink). More spatial tools, like blobs were used to evaluate the density of the flowers on a tree.
Results
Figure 2 shows the processing procedure of a typical tree. The first column is the original picture of a tree. The upper row represents the buds procedure and the lower row is for the flowers procedure. The second column shows the outcome from color thresholding. The third column gives the product of dilate, erode and other geometrical tools that cleans noise in the image and fill holes. In the last column, the image shows a cropped part from the processed picture, as a mask on top of the original picture, authenticating the findings.
Phases of processing to detect buds and flowers. Top images refers to the process for detection of buds, and the bottom line refers to the process for detection of flowers.

Figure 3 presents the seasonal pattern of blooming for three typical trees, as estimated by the machine vision system. The blooming intensity is estimated by the total area of the pixels (number of pixels) that are classified as flowers. In both years, the general trend of increasing blooming intensity is observed. In 2014, it seems that between April 6th and April 7th was the peak of the bloom, although there is still an increase in April 8th. In 2015, the same trend is observed. Two days in 2015 were rainy, and no data were acquired.
Seasonal tracking of flowering intensity along the bloom season of three typical trees: (a) 2014 season and (b) 2015 season.

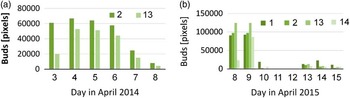
Figure 4 shows the seasonal pattern of buds for three typical trees, as estimated by machine vision. The number of buds is estimated by the total area of the pixels (number of pixels) that are classified as buds. In both years, the general trend of decreasing number of buds along the blooming period is observed. Both in 2014 and 2015, as buds turned into flowers, their number decreases as blooming intensity increases.
Seasonal tracking of buds intensity along the bloom season of three typical trees: (a) 2014 season and (b) 2015 season.

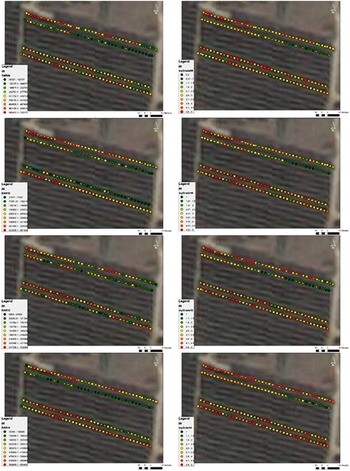
The variability of blooming intensity within two orchard rows was mapped. Figure 5 presents blooming intensity maps along the 2015 season as captured by human eye (left column) and as estimated by the machine vision system (right column).
Maps of blooming spatial variblility in 2015 season, as captured by human eye (left column) and as estimated by the machine vision system (right column).

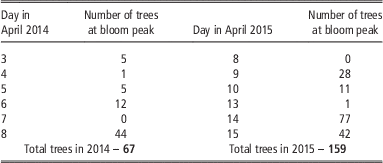
The variability of blooming intensity between the trees also yielded a non-uniform day of bloom peak. Table 1 summarizes the statistics of day of bloom peak. In 2014, bloom peak occurred on April 8th, which is 6 days after first flowers were observed. In 2015, bloom peak was observed on April 14th, which is 5 days after first flowering opening was observed.
Time of bloom peak in 2014 and 2015 estimated by machine vision

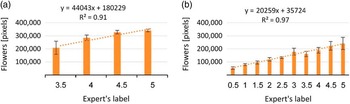
The automatically extracted area of flowers in the digital images was compared to the manually labeled bloom intensity. Figure 6 presents the above relationship for the day of bloom peak for 2014 and 2015 seasons respectively.
Relationship between flowers area as detected by the machine vision system and blooming intensity label as estimated by the horticulture expert: (a) 2014 season, (b) 2015 season. Linear regression was statistically significant (α<0.01).

Discussion
Buds and flowers have different color characteristics, which enabled the distinction between them using color features. In addition, the difference in size further enabled their separation. Within the same season, comparisons between the area of flowers or buds along the blooming season provided accurate information regarding the time of blooming peak. Comparing between the two seasons, there was a great difference between them (Fig. 3(a) and 3(b)). This difference might be due to different flowering intensities between the two years, especially considering the difference in environmental conditions between 2014 and 2015. During 2015, two rainy days caused a significant fall of flowers and retardation of buds transforming into flowers. Furthermore, in 2015, a polarizer filter was used, which may have caused slight differences in the acquired images, resulting into a bias in the extracted features. The same difference was observed in the bud detection (Fig. 4(a) and (b)).
Comparing Figures 3 and 4, the complimentary form of the flower and the bud development can be seen. At the beginning of the blooming period, the number of buds is maximum, while the number of flowers is minimum. As time passes, buds transform into flowers: the area of buds decreases, as the area of flowers increases. Bud area continuously decreased till the end of the blooming period, while the area of the flowers reached a peak and started decreasing as well. Despite the differences in the absolute value of the flowers and buds area in the two seasons, continuous monitoring of the trees enabled in both seasons the detection of the peak, which is the important parameter needed for chemical thinning.
The maps in Figure 5 depict the great variability between the trees, and combined with the different dates when peak bloom was observed (Table 1), illustrates the need for site-specific management of chemical thinning. The relationship between the absolute value of the blooming intensity (expert’s label) and the flowers area is highly linear (Figure 6) and significant for each season. Comparing the two seasons, the models linking the two variables differ. This is due to the difference in estimation of flowers in the two seasons, or to the observed difference in flowers due to the different meteorological conditions in the two seasons. This difference, suggests that there is no global model for describing the blooming process and in each season, a local calibration might be needed. Nevertheless, the lack of a global model in the estimation of the absolute blooming intensity does not reduce the ability to detect the time of the bloom peak, using data acquired during that period.
The sun and the clouds entering the picture frame affected the accuracy of the image processing algorithms. Though most of this noise was filtered out, cases occurred where the clouds were visible through the branches of the tree. Consequently, the branches framed the clouds into small shapes similar in size to flowers and created misclassification errors. Some further image processing work is needed for filtering them out.
Conclusions
Color images can be used to detect bloom peak in apple orchards. The absolute value of bloom intensity can also be accurately estimated from the digital images. Nevertheless, this relationship was season-specific and needs to be locally calibrated. Mapping of bloom intensity of individual trees can provide information on the variability within the field and provide the basis for variable rate application.
Acknowledgements
This research was supported by project 4580576 of the Chief Scientist of the Israeli Ministry of Agriculture.