




1 Introduction
Rayleigh–Bénard (RB) convection, a fluid layer heated from below and cooled from above (see Ahlers, Grossmann & Lohse Reference Ahlers, Grossmann and Lohse2009; Lohse & Xia Reference Lohse and Xia2010; Chilla & Schumacher Reference Chilla and Schumacher2012; Xia Reference Xia2013), continues to attract great attention not only for its relevance to widely occurring convection phenomena in nature, such as the motion of the Earth’s mantle and outer core, the winds in the atmosphere and the currents in the oceans, but also because it is a paradigm for the study of buoyancy-driven turbulence. RB convection is characterized by the Rayleigh number  $Ra=\unicode[STIX]{x1D6FC}g\unicode[STIX]{x0394}TH^{3}/(\unicode[STIX]{x1D708}\unicode[STIX]{x1D705})$, and the Prandtl number
 $Pr=\unicode[STIX]{x1D708}/\unicode[STIX]{x1D705}$, where
 $H$ is the height of the convection cell,
 $\unicode[STIX]{x0394}T$ is the temperature difference between the bottom and top plates of the convection cell,
 $g$ is the gravitational acceleration, and
 $\unicode[STIX]{x1D6FC}$,
 $\unicode[STIX]{x1D708}$ and
 $\unicode[STIX]{x1D705}$ are, respectively, the volume expansion coefficient, kinematic viscosity and thermal diffusivity of the fluid. When
 $Ra$ exceeds a critical value, the hot and cold plumes erupted from the bottom and top plates interact with each other and evolve into a large-scale circulation (LSC), which takes the form of a single roll (Krishnamurti & Howard Reference Krishnamurti and Howard1981; Cioni, Ciliberto & Sommeria Reference Cioni, Ciliberto and Sommeria1997; Xi, Lam & Xia Reference Xi, Lam and Xia2004). A fascinating feature of the LSC is the spontaneous and random reversal of its flow direction. The reversal of the LSC is of general interest for its putative connection (Sreenivasan, Bershadskii & Niemela Reference Sreenivasan, Bershadskii and Niemela2002; Araujo, Grossmann & Lohse Reference Araujo, Grossmann and Lohse2005; Benzi Reference Benzi2005; Brown, Nikolaenko & Ahlers Reference Brown, Nikolaenko and Ahlers2005; Xi & Xia Reference Xi and Xia2007, Reference Xi and Xia2008; Sugiyama et al. Reference Sugiyama, Ni, Stevens, Chan, Zhou, Xi, Sun, Grossmann, Xia and Lohse2010) to similar reversals in the atmosphere (van Doorn et al. Reference van Doorn, Dhruva, Sreenivasan and Cassella2000), or in the outer core of the Earth (Glatzmaier et al. Reference Glatzmaier, Coe, Hongre and Roberts1999). Despite the extensive studies in the last two decades (Sreenivasan et al. Reference Sreenivasan, Bershadskii and Niemela2002; Araujo et al. Reference Araujo, Grossmann and Lohse2005; Benzi Reference Benzi2005; Brown et al. Reference Brown, Nikolaenko and Ahlers2005; Sugiyama et al. Reference Sugiyama, Ni, Stevens, Chan, Zhou, Xi, Sun, Grossmann, Xia and Lohse2010; Chandra & Verma Reference Chandra and Verma2013; Ni, Huang & Xia Reference Ni, Huang and Xia2015; Podvin & Sergent Reference Podvin and Sergent2015; Castillo-Castellanos, Sergent & Rossi Reference Castillo-Castellanos, Sergent and Rossi2016; Huang & Xia Reference Huang and Xia2016; Horstmann, Schiepel & Wagner Reference Horstmann, Schiepel and Wagner2018; Wang et al. Reference Wang, Xia, Wang, Sun, Zhou and Wan2018a,Reference Wang, Lai, Song and Tongb; Castillo-Castellanos et al. Reference Castillo-Castellanos, Sergent, Podvin and Rossi2019; Chen et al. Reference Chen, Huang, Xia and Xi2019), a general understanding of the mechanism of the reversal of the LSC remains elusive.
In studies of the reversal of the LSC, very often (quasi-) two-dimensional (2-D) rectangular convection cells are used (Liu & Zhang Reference Liu and Zhang2008; Sugiyama et al. Reference Sugiyama, Ni, Stevens, Chan, Zhou, Xi, Sun, Grossmann, Xia and Lohse2010; Huang et al. Reference Huang, Wang, Xi and Xia2015; Ni et al. Reference Ni, Huang and Xia2015; Wang et al. Reference Wang, Xia, Wang, Sun, Zhou and Wan2018a), because in the (quasi-) 2-D cell the influence of the three-dimensional dynamic features of the LSC, such as the torsional and sloshing motions that are typically found in a cylindrical geometry (Funfschilling & Ahlers Reference Funfschilling and Ahlers2004; Brown et al. Reference Brown, Nikolaenko and Ahlers2005; Xi et al. Reference Xi, Zhou, Zhou, Chan and Xia2009, Reference Xi, Zhang, Hao and Xia2016), are eliminated. In the (quasi-) 2-D geometry, the LSC consists of a big main vortex of a tilted ellipse shape and two small corner vortices diagonally opposite to each other. It was found that the reversal of the LSC is accomplished as follows: the corner vortices grow in both size and amplitude, squeeze and eventually break up the main vortex, then connect to each other to form a new big single-roll vortex again, but with a reversed circulating direction (Sugiyama et al. Reference Sugiyama, Ni, Stevens, Chan, Zhou, Xi, Sun, Grossmann, Xia and Lohse2010; Chandra & Verma Reference Chandra and Verma2013). In this picture the corner vortices play a crucial role in the reversal process. However, it was recently found in a vertical thin circular cell, where the corner vortices are absent, that the reversal of the LSC could still occur (Wang et al. Reference Wang, Lai, Song and Tong2018b). It was also found that the scaling of the reversal frequency versus  $Ra$ is controlled by the stability of the main vortex (Chen et al. Reference Chen, Huang, Xia and Xi2019). To unlock the intricate dynamics behind these seemingly contradictory results, a comparative study of the reversals in cells with and without corner vortices becomes essential.
In this paper, we report a comparative experimental study of the reversals of the LSC in a corner-less and a normal convection cell. It is found that in the corner-less cell the reversal of LSC still happens, and the reversal frequency decreases with  $Ra$, and is divided into slow and fast decrease regimes. The transition of the reversal frequency in this corner-less cell is very similar to that in the normal cell, while the reversal frequency in the corner-less cell is greatly reduced. The reduction of the reversal frequency is more significant, in terms of both the amplitude and the scaling exponent, in the high-
 $Ra$ regime. It is found that the reversals can be classified into main-vortex-led (MVL) and corner-vortex-led (CVL), and both types exist in the normal cell while only the former exists in the corner-less cell. The frequency of MVL reversal in the normal cell is found to be in excellent agreement with the frequency of reversals in the corner-less cell. Our results reveal, for the first time, the quantitative role of the corner vortices in the occurrence of the reversals of the LSC.
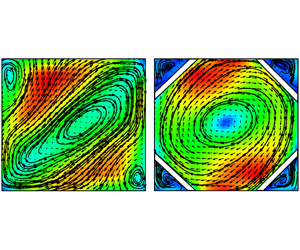
Long-time-averaged particle image velocimetry velocity map with streamlines measured from (a) the normal cell at  $Ra=7.94\times 10^{8}$ and (b) the corner-less cell at
 $Ra=7.56\times 10^{8}$, both at
 $Pr=7.0$. The velocity is coded with both colour and vector length in units of
 $\text{cm}~\text{s}^{-1}$. Also shown is a sketch of one corner of the corner-less cell.

2 Experimental set-up and methods
Two types of convection cells, i.e. the normal cell and the corner-less cell, were used in our experiments. The two types of cells differ only in that there are four additional Plexiglas plates at the four corners in the corner-less cell but were otherwise identical. The height ( $H$), length (
 $L$) and width (
 $W$) of the cells are 12.6 cm, 12.6 cm and 3.8 cm, respectively; thus the aspect ratios are
 $L/H=1$ and
 $W/L=W/H\simeq 0.3$. The normal cell has been described elsewhere (Chen et al. Reference Chen, Huang, Xia and Xi2019). Here, we only mention some essential features. The convection cell consists of copper top and bottom plates and the Plexiglas sidewall. The temperature of the top plate was controlled by a refrigerated circulator (Polyscience) and the bottom plate is heated by two resistive film heaters with constant power input. In each plate, there are six thermistors of 2.5 mm diameter embedded to measure the temperature. The three pairs of thermistors are equally spaced along the
 $L$ direction at
 $L/4$,
 $L/2$ and
 $3L/4$, and we refer them as left, middle and right. To separate the main vortex and the corner vortex, at each of the four corners we glue a 2 mm thick Plexiglas plate, as shown in figure 1(b) where the side view of one corner is sketched. The plate is 3.8 cm in width and 4.5 cm long. The angles between the Plexiglas plate and the bottom (top) plate and the vertical sidewall are both
 $45^{\circ }$; thus the projections of the plate on both the bottom (top) plate and vertical sidewall are roughly
 $H/4$. Three of the four edges of each of the plates are in close contact (glued) with the three inner faces of the Plexiglas sidewalls; only the bottom (top) edge is 2 mm away from the bottom (top) fluid–plate interface. With the Plexiglas plates at the four corners, the bulk flow largely feels no corners, while the 2 mm gap allows exchange of heat and mass between the fluid flow inside the corner and bulk fluid flow. The gap height is comparable to the thickness of the thermal boundary layer in our experiments. To test whether the shape of the plates affects the results, we have also performed experiments with four concavely curved plates with the same projections on the plates and the sidewalls. Although the curved plates give a slightly more circular interior of the cell, we found the results are very similar to those obtained by the flat plates.
Deionized water was used as the working fluid and the experiments in the corner-less cell were conducted in the  $Ra$ range of
 $9.58\times 10^{7}$ to
 $3.71\times 10^{8}$ for
 $Pr=5.7$ and
 $1.03\times 10^{8}$ to
 $5.59\times 10^{8}$ for
 $Pr=7.0$. Owing to the small lateral aspect ratio
 $W/H\simeq 0.3$, the LSC is confined in the vertical
 $L{-}H$ plane; the cell is thus considered quasi-2-D (Xia, Sun & Zhou Reference Xia, Sun and Zhou2003). To detect the reversal of LSC, we use the temperature contrast method (Sugiyama et al. Reference Sugiyama, Ni, Stevens, Chan, Zhou, Xi, Sun, Grossmann, Xia and Lohse2010; Ni et al. Reference Ni, Huang and Xia2015; Huang & Xia Reference Huang and Xia2016; Chen et al. Reference Chen, Huang, Xia and Xi2019), i.e. identify the reversal event through the temperature contrast
 $\unicode[STIX]{x1D6FF}$ between the thermistors embedded on the left and right sides of the plates,
 $\unicode[STIX]{x1D6FF}=T_{left}-T_{right}$. To have enough statistics, each measurement lasts for 1–2 days; the longest measurement lasted continuously for 15 days. The criteria used to identify the reversal event can be found in Huang & Xia (Reference Huang and Xia2016) and Chen et al. (Reference Chen, Huang, Xia and Xi2019). They are based on the amplitude and duration time of
 $\unicode[STIX]{x1D6FF}$. The first criterion is that the two circulation states of the LSC (clockwise direction and anticlockwise direction) should be clearly distinguished from each other. This implies that the probability density function (p.d.f.) of
 $\unicode[STIX]{x1D6FF}$ (see figure 2d of Huang & Xia (Reference Huang and Xia2016)) should have two peaks (two most probable values) with each peak corresponding to one circulation state, and the distance
 $d$ between the two peaks in the p.d.f. should be larger than the root mean squared (r.m.s.) value of
 $\unicode[STIX]{x1D6FF}$, so that the two peaks can be clearly distinguished (note that here the peak value corresponds to the threshold in Castillo-Castellanos et al. (Reference Castillo-Castellanos, Sergent, Podvin and Rossi2019)). The second criterion is that when the flow changes from one state to the other,
 $\unicode[STIX]{x1D6FF}$ should first cross over the peak corresponding to the current state, then cross over the peak corresponding to the other state, i.e. the value of
 $\unicode[STIX]{x1D6FF}$ should be larger (smaller) than the higher (lower) peak value of
 $\unicode[STIX]{x1D6FF}$ in the p.d.f. The third criterion is that the flow should stay at the new state for more than one turnover time of the LSC. The second criterion has guaranteed that the reversal is not the cessation observed in the simulation of 2-D RB convection by Castillo-Castellanos et al. (Reference Castillo-Castellanos, Sergent, Podvin and Rossi2019).
3 Results and discussion
3.1 Flow topology and scaling of the global quantities
We first compare the flow topology in the normal and the corner-less cells. Figure 1(a,b) shows the time-averaged velocity field captured in the normal and the corner-less cells at similar  $Ra$ (
 $7.94\times 10^{8}$ and
 $7.56\times 10^{8}$, respectively) for
 $Pr=7.0$; and during the 2 hours average time, no reversal occurs. From figure 1(a), one can see that the typical flow pattern in the normal cell consists of a main vortex in the shape of a tilted ellipse and two small corner vortices sitting at the top-left and bottom-right corners, which is consistent with previous studies (Xia et al. Reference Xia, Sun and Zhou2003; Sugiyama et al. Reference Sugiyama, Ni, Stevens, Chan, Zhou, Xi, Sun, Grossmann, Xia and Lohse2010). In the corner-less cell, the flow pattern is totally different, due to the existence of the Plexiglas plates. The main vortex feels no corners, thus it is in a circular shape. The fluid trapped in the corners is heated up (cooled down) by the bottom (top) plate, goes up (down) due to the buoyancy force, and is then deflected and comes down (goes up) due to the existence of the Plexiglas plates and the sidewall. After that it is heated up (cooled down) and goes up (comes down) again, thus forming fixed-size small vortices, which are isolated from the bulk fluid. There is almost no mass or momentum transfer between these isolated corner vortices and the main vortex except for the greatly reduced heat, mass and momentum transfer through the 2 mm thick gap. Although the Plexiglas plate is a poor thermal conductor (with thermal conductivity of
 $0.19~\text{W}~\text{m}^{-1}~\text{K}^{-1}$), as it is very thin (2 mm), presumably there is still strong heat transfer between the fluid trapped in the corner and the bulk fluid through the Plexiglas plate. The size of these corner rolls behind the Plexiglas plates is fixed, determined by the size of the Plexiglas plates. Nevertheless, with the addition of the four Plexiglas plates, an LSC without (the effects of) the corner vortices is indeed achieved. It should be emphasized that the fixed-size ‘corner vortices’ in the corner-less cell are totally different from the corner vortices in the normal cell. In the normal cell the corner vortices can directly interact with the main vortex: they can grow and squeeze the main roll and connect with each other to form a new main vortex.
Plots of (a)  $Re$ and (b)
 $Nu$ as functions of
 $Ra$ for
 $Pr=5.7$ and 7.0 from the normal and the corner-less cells. The solid and dashed lines are power-law fits to the corresponding data.

We then characterize the corner-less convection system by studying the scaling properties of the global quantities such as Reynolds number  $Re$ and Nusselt number
 $Nu$, which quantifies the heat transfer efficiency and is defined as the ratio between the total heat flux across the system and the heat flux by pure conduction in the fluid. Figure 2(a) shows the measured
 $Re$ as a function of
 $Ra$ for
 $Pr=5.7$ and 7.0 in the normal and the corner-less cells. Here,
 $Re=4H^{2}/(\unicode[STIX]{x1D708}t_{E})$, where
 $t_{E}$ is the turnover time of the LSC;
 $t_{E}$ is obtained by the cross-correlation of temperature signals inside the top and the bottom plates. It is well known that the LSC is an organized motion of thermal plumes. When the LSC sweeps on the conducting plates, it will lead to a local temperature fluctuation and pass its signature to the boundaries. Such a signature can be detected not only in the sidewall but also in the top and bottom plates (Cioni et al. Reference Cioni, Ciliberto and Sommeria1997; Brown, Funfschilling & Ahlers Reference Brown, Funfschilling and Ahlers2007; Xi et al. Reference Xi, Zhou, Zhou, Chan and Xia2009; Wei et al. Reference Wei, Chan, Ni, Zhao and Xia2014). It can be seen from figure 2(a) that
 $Re$ measured in the corner-less cell is approximately 20 % higher than that in the normal cell for both
 $Pr=5.7$ and 7.0. This increased
 $Re$ implies a stronger LSC in the corner-less cell, as now there are no corner vortices to drain energy from the main vortex. In spite of the higher amplitude of
 $Re$ in the corner-less cell, the scalings of
 $Re$ versus
 $Ra$ for both cells are almost the same, as shown by the solid and dashed lines in figure 2(a); they exhibit almost the same scalings,
 $Re\sim Ra^{0.55}$. And the scaling exponent obtained here are consistent with previous results in similar normal cells (Xia et al. Reference Xia, Sun and Zhou2003; Zhou, Sun & Xia Reference Zhou, Sun and Xia2007; Zhang, Zhou & Sun Reference Zhang, Zhou and Sun2017).
Figure 2(b) shows the measured  $Nu=J/(\unicode[STIX]{x1D712}\unicode[STIX]{x0394}T/H)$ as a function of
 $Ra$ in both normal and corner-less cells, where
 $J$ and
 $\unicode[STIX]{x1D712}$ are the total heat flux entering the convection cell and the thermal conductivity of water. The relation can be described by
 $Nu\sim Ra^{0.30}$ for the normal cell and by
 $Nu\sim Ra^{0.28}$ for the corner-less cell. The scaling exponents are consistent with previous results in similar normal cells (Ciliberto, Cioni & Laroche Reference Ciliberto, Cioni and Laroche1996; Huang & Xia Reference Huang and Xia2016; Jiang et al. Reference Jiang, Zhu, Mathai, Verzicco, Lohse and Sun2018). Although the scaling exponents are very close to each other for both cells, the amplitude of
 $Nu$ is much smaller in the corner-less cell; it is only approximately 60 % of the value in the normal cell. The reduction of
 $Nu$ should be due to the fact that some of the heat supplied in the corner region is trapped by the Plexiglas plates, and thus cannot be transported to the main flow. Moreover, it also implies that the corner vortices play an important role in terms of heat transfer in the normal cell (Huang & Zhou Reference Huang and Zhou2013).
Note that, in the corner-less cell, part of the heating and cooling surfaces are not accessible to the bulk fluid due to the existence of the Plexiglas plate; thus the effective heating area is reduced compared to the normal cell case. Therefore, the effective  $Nu$ based on this reduced heating area will be much larger. The total heat flux is
 $J=(U^{2}/R)/A$, where
 $U$ is the voltage applied on the heater in the bottom plate,
 $R$ is the resistance of the heater embedded in the bottom plate and
 $A$ is the surface area of the bottom plate. For the sake of clarity, we define
 $Nu$ measured in the normal cell as
 $Nu_{n}$ and that measured in the corner-less cell as
 $Nu_{cl}$. If we take the area that is not covered by the Plexiglas plate as the effective heating area, which is roughly
 $0.5A$, the effective
 $Nu_{eff}$ will be
 $Nu_{cl}/0.5=2Nu_{cl}$. As we already knew that
 $Nu_{cl}=0.6Nu_{n}$, thus
 $Nu_{eff}=1.2Nu_{n}$. That is, compared to the
 $Nu$ measured in the normal cell, the effective
 $Nu$ measured in the corner-less cell is increased by 20 %. This seems consistent with the 20 % increase of
 $Re$.
3.2 The reversal frequency
Previously, in the normal cell, we (Chen et al. Reference Chen, Huang, Xia and Xi2019) have found that there is a transition in the  $Ra$ dependence of the reversal frequency
 $f$ with two distinct scalings: for
 $Ra$ less than a transitional
 $Ra$, the non-dimensionalized reversal rate
 $ft_{E}\sim Ra^{-1.09}$; for higher
 $Ra$, however, the scaling changes to
 $ft_{E}\sim Ra^{-3.06}$. Flow visualization shows that this regime transition originates from a transition in flow topology from the normal single-roll state (SRS) to the abnormal single-roll state (ASRS) with substructures inside the single roll. The emergence of the substructures inside the LSC lowers the energy barrier for the flow reversals to occur and leads to a slower decay of
 $f$ with
 $Ra$. Detailed analysis reveals that, although it is the corner vortices that trigger the reversal event, the probability for the occurrence of reversals mainly depends on the stability of the LSC (Chen et al. Reference Chen, Huang, Xia and Xi2019).
Flow reversal frequency  $f$ (normalized by
 $1/t_{E}$) as a function of
 $Ra$ for
 $Pr=5.7$ (a) and
 $Pr=7.0$ (b). Reversal frequency measured in a vertical thin circular disk (
 $W/D=0.11$) at
 $Pr=5.7$ and 7.6 by Wang et al. (Reference Wang, Lai, Song and Tong2018b), and in the normal cell (
 $W/H=0.1$) at
 $Pr=5.7$ by Huang & Xia (Reference Huang and Xia2016) are also plotted for comparison. (c) The same data as in (a) and (b), but
 $Ra$ is normalized by
 $Ra_{t,r}$, with
 $Ra_{t,r}=2.0\times 10^{8}$ for
 $Pr=5.7$ and
 $3.0\times 10^{8}$ for
 $Pr=7.0$. Inset: the ratio of the reversal frequency in the corner-less cell
 $f_{cl}t_{E}$ to that in the normal cell
 $f_{n}t_{E}$. (d) The stability of the (
 $1,1$) mode
 $S^{1,1}=\langle A^{1,1}\rangle /\unicode[STIX]{x1D70E}_{A^{1,1}}$ as a function of normalized
 $Ra$. In (a–d), the solid lines are the power-law fits to the data and the vertical dashed lines indicate the transitional Rayleigh number
 $Ra_{t,r}$.

We now examine the reversal frequency  $f$ in the corner-less cell, where
 $f$ is defined as the averaged number of reversal events per second. Figure 3(a,b) shows the normalized
 $f$ as a function of
 $Ra$ in the corner-less cell for
 $Pr=5.7$ and 7.0, respectively. For comparison,
 $f$ measured in the normal cell (Chen et al. Reference Chen, Huang, Xia and Xi2019) and in a vertical circular thin disk (Wang et al. Reference Wang, Lai, Song and Tong2018b) are also plotted. To compare
 $f$ in the different systems, we non-dimensionalize it by
 $1/t_{E}$. From figure 3(a,b), one can see that
 $f$ in the corner-less cell decreases with
 $Ra$, i.e. it is harder and harder for reversal to occur with increasing
 $Ra$, which is consistent with that in the normal cell (Chen et al. Reference Chen, Huang, Xia and Xi2019) and in the circular thin disk (Wang et al. Reference Wang, Lai, Song and Tong2018b). Moreover,
 $f$ measured in the corner-less cell also exhibits a transition with two distinct regimes separated by a transitional
 $Ra$ (
 $Ra_{t,r}$): a slow decay regime and a fast decay regime, which is also consistent with that in the normal cell (Chen et al. Reference Chen, Huang, Xia and Xi2019). It is seen from figure 3(a,b) that
 $Ra_{t,r}$ measured in the corner-less cell is almost the same as that in the normal cell (for the same
 $Pr$). We note that
 $f$ measured in the thin circular disk also scales with
 $Ra$, and the scaling exponent is very close to that of the normal/corner-less cell in the
 $Ra<Ra_{t,r}$ (or ASRS) regime. This implies that in the
 $Ra$ range of the vertical thin circular disk experiment (Wang et al. Reference Wang, Lai, Song and Tong2018b), the large-scale flow should be in the ASRS regime, i.e. the interior of the LSC is already broken into two smaller vortices. And
 $Ra_{t,r}$ for the thin circular disk should be very high, which is reasonable, as in this thin circular disk the aspect ratio
 $\unicode[STIX]{x1D6E4}=\text{thickness}/\text{diameter}$ is very small (
 $\unicode[STIX]{x1D6E4}=0.11$) compared to
 $\unicode[STIX]{x1D6E4}=W/H\simeq 0.3$ in our cell. Thus the viscous damping due to the sidewalls is much stronger; as a result, the transitional
 $Ra$ is much larger (Chen et al. Reference Chen, Huang, Xia and Xi2019). We expect that if we normalize
 $Ra$ for the thin circular disk data by its own
 $Ra_{t,r}$, the data would collapse with the data from the corner-less cell in the
 $Ra<Ra_{t,r}$ regime; unfortunately the
 $Ra_{t,r}$ for this geometry is not known to us.
Also plotted in figure 3(a) is  $f$ measured in a
 $W/H=0.1$ (almost the same aspect ratio as in Wang et al. (Reference Wang, Lai, Song and Tong2018b)) normal cell by Huang & Xia (Reference Huang and Xia2016). Although we have only two data points and the
 $Ra$ range does not overlap with that of Wang et al. (Reference Wang, Lai, Song and Tong2018b), if we fit the two data points with a straight line then extend to the
 $Ra$ range of Wang et al. (Reference Wang, Lai, Song and Tong2018b), it is found that the reversal frequency in the normal cell is higher than that in the circular disk. This is consistent with our results that (for the same aspect ratio) the reversal frequency is higher in cells with corner vortices. In figure 3(c) we plot
 $f$ as a function of
 $Ra$ for the two different
 $Pr$ together, where
 $Ra$ is normalized by
 $Ra_{t,r}$. For comparison, the data from the normal cell (Chen et al. Reference Chen, Huang, Xia and Xi2019) are also plotted. As shown in figure 3(c), similar to the normal cell case, the data from the corner-less cell fall on top of each other with two distinct scaling regimes being
 $ft_{E}\sim Ra^{-1.53\pm 0.12}$ and
 $ft_{E}\sim Ra^{-5.05\pm 0.18}$. The existence of the transition for both cases, with and without the corner vortices, confirms that the transition originates from the stability of the main vortex (Chen et al. Reference Chen, Huang, Xia and Xi2019).
Compared to that in the normal cell,  $f$ in the corner-less cell is greatly reduced, as shown by the ratio of normalized reversal frequency
 $(f_{cl}t_{E})/(f_{n}t_{E})$ in the inset of figure 3(c); here
 $f_{cl}$ and
 $f_{n}$ are the reversal frequencies from the corner-less and the normal cells, respectively, and the values of
 $f_{cl}t_{E}$ and
 $f_{n}t_{E}$ are from the power-law fitting in figure 3(c). On average the reversal frequency is reduced by approximately 50 % when
 $Ra<Ra_{t,r}$, and by approximately 90 % when
 $Ra>Ra_{t,r}$. On the other hand, the decay rate of
 $f$ with
 $Ra$ is also changed: in the
 $Ra<Ra_{t,r}$ regime, the scaling exponent is changed from
 $-1.08$ to
 $-1.53$; while in the
 $Ra>Ra_{t,r}$ regime, it is changed from
 $-2.83$ to
 $-5.05$. One can see that the scaling exponent in the
 $Ra<Ra_{t,r}$ regime does not change as much as that in the
 $Ra>Ra_{t,r}$ regime. The reason is understandable: when
 $Ra<Ra_{t,r}$, the LSC is in the ASRS, where the interior of the main vortex is already broken into two small vortices (Chen et al. Reference Chen, Huang, Xia and Xi2019); thus it is very unstable. In this regime, the reversal is mainly induced by the instability of the main vortex, and the corner vortex does not play a significant role. Thus when the corner vortices are eliminated, the decay rate of the reversal frequency does not change much. This regime is referred to as the MVL reversal dominant regime. When
 $Ra>Ra_{t,r}$, the flow is in the SRS, the main vortex is very stable and it is very hard for the reversal to occur if there are no corner vortices to drain energy from, and weaken and break the main vortex. In this regime the corner vortices are significant to the occurrence of the reversal. Thus, once the corner vortices are eliminated, the reversal frequency is greatly reduced. This regime is referred to as the CVL reversal dominant regime.
3.3 The transition of the flow topology and the stability of the LSC
Previously, in the normal cell, it has been shown that the transition in the reversal frequency originates from the flow topology transition from the ASRS to the SRS (Chen et al. Reference Chen, Huang, Xia and Xi2019). To examine whether the reversal frequency transition in the corner-less cell is from the same origin, we study the flow topology evolution with  $Ra$ in the corner-less cell. The particle image velocimetry (PIV) technique is used to measure the flow field of the vertical mid-plane in the corner-less cell. For each
 $Ra$, the PIV measurements last for at least 2 hours and at least 7200 snapshots were acquired at 1 Hz sampling rate. Figure 4 shows the evolution of the short-time-averaged flow field with
 $Ra$ for
 $Pr=7.0$. It is very similar to the case in the normal cell (Chen et al. Reference Chen, Huang, Xia and Xi2019): when
 $Ra\leqslant 3.0\times 10^{8}$ (figure 4a–c), the flow is in the ASRS, i.e. a single roll with substructure in it; when
 $Ra>3.0\times 10^{8}$ (figure 4d–f), the flow is in the SRS, i.e. a single roll without any substructures in it. The transitional
 $Ra$ for the flow topology is almost the same as
 $Ra_{t,r}$ determined from the reversal frequency. It is also found that a similar flow topology transition happens in the
 $Pr=5.7$ case as well. Thus we come to the conclusion that the transition of the reversal frequency
 $ft_{E}$ in the corner-less cell also originates from the transition of flow topology. In a previous study, we have proposed a model to predict the critical condition for the interior of the LSC to break, based on the balance between advection and viscous dissipation of thermal plumes (Chen et al. Reference Chen, Huang, Xia and Xi2019). As the model does not depend on the geometry of the cell, it also applies to the corner-less cell.
Flow topology evolution with increasing  $Ra$ in the corner-less cell. Short-time-averaged (within one LSC turnover time
 $t_{E}$) PIV velocity maps with streamlines at different
 $Ra$ (as indicated) for
 $Pr=7.0$. The velocity is coded with both colour and vector length in units of
 $\text{cm}~\text{s}^{-1}$. Here the streamlines inside each corner are not shown.

To gain a quantitative understanding of the flow evolution with  $Ra$ in the corner-less cell, we decompose the instantaneous PIV velocity map into Fourier modes (Chandra & Verma Reference Chandra and Verma2013; Wagner & Shishkina Reference Wagner and Shishkina2013; Wang et al. Reference Wang, Xia, Wang, Sun, Zhou and Wan2018a). The Fourier mode decomposition has been introduced in detail in Chen et al. (Reference Chen, Huang, Xia and Xi2019). Briefly, we project the velocity map
 $(u_{x},u_{z})$ onto the following Fourier basis:
 $u_{x}^{m,n}=2\sin (m\unicode[STIX]{x03C0}x)\cos (n\unicode[STIX]{x03C0}z)$,
 $u_{z}^{m,n}=-2\cos (m\unicode[STIX]{x03C0}x)\sin (n\unicode[STIX]{x03C0}z)$. The values
 $m,n=1,2,3$ are considered. The so-obtained mode (
 $m,n$) corresponds to a flow field with
 $m$ rolls in the
 $x$ direction and
 $n$ rolls in the
 $z$ direction. For example, the (
 $1,1$) mode is the single-roll mode. The amplitude of the Fourier mode
 $A^{m,n}$ is obtained by the component-wise projection of each velocity map on the Fourier basis. To apply the Fourier mode decomposition in the corner-less cell, we set the velocity vectors inside the corners to be zero. It was previously shown that, in the normal cell, the slow (fast) decay of the reversal frequency in the
 $Ra<Ra_{t,r}$ (
 $Ra>Ra_{t,r}$) regime is due to the slow (fast) increase of the stability of the (
 $1,1$) mode of the flow, where the stability of the (
 $1,1$) mode is defined as its mean amplitude divided by its r.m.s. value
 $S^{1,1}=\langle A^{1,1}\rangle /\unicode[STIX]{x1D70E}_{A^{1,1}}$ (Chen et al. Reference Chen, Huang, Xia and Xi2019). As can be seen from figure 3(d), similar to the case in the normal cell,
 $S^{1,1}$ first experiences a slow increase, followed by a fast increase. And the transitional
 $Ra$ for
 $S^{1,1}$ is almost identical to that for reversal frequency. It should be noted that, in the
 $Ra<Ra_{t,r}$ regime, the increasing rates of
 $S^{1,1}$ from the normal cell and from the corner-less cell are very close to each other. Since the stability of the (
 $1,1$) mode controls the decay rate of the reversal frequency, the decay rates of the reversal frequency in the normal cell and the corner-less cell are very close to each other as well, as shown in figure 3(c). While in the
 $Ra>Ra_{t,r}$ regime,
 $S^{1,1}$ increases much faster in the corner-less cell, which explains why the reversal frequency decays much faster than that in the normal cell. The one-to-one correspondence between the increasing rate of
 $S^{1,1}$ and the decay rate of reversal frequency in both the corner-less cell and the normal cell reveals that the decay rate is indeed controlled by the stability of the (
 $1,1$) mode (the main vortex).
3.4 The main-vortex-led and the corner-vortex-led reversals
(a,b) Ensemble-averaged time traces of temperature difference  $\widetilde{\unicode[STIX]{x1D6FF}}$ (normalized by
 $d/2$) during reversal for the normal cell when (a)
 $Ra=1.15\times 10^{8}<Ra_{t,r}$ and (b)
 $Ra=2.96\times 10^{8}>Ra_{t,r}$, respectively. Here
 $d$ is the peak-to-peak separation of the p.d.f. of
 $\unicode[STIX]{x1D6FF}$;
 $d$ is 0.012 K for (a) and 0.015 K for (b), respectively. (c) The p.d.f. of the normalized duration time of reversal
 $t_{d}/t_{E}$ for the normal cell at
 $Ra=1.15\times 10^{8}$,
 $Pr=5.7$, where MVL reversal dominates, and at
 $Ra=2.96\times 10^{8}$,
 $Pr=5.7$, where CVL reversal dominates. The two
 $Ra$ straddle
 $Ra_{t,r}~(=2.0\times 10^{8})$. (d,e) The frequencies of the MVL reversal
 $f_{MVL}$ (d) and the CVL reversal
 $f_{CVL}$ (e) as a function of
 $Ra$ from the normal cell. Also plotted in (d) is the reversal frequency
 $f$ from the corner-less cell. The solid lines are the power-law fits to the data. Note that in (d) the data from both the normal cell and the corner-less cell are included for the fit.

As we mentioned before, in the normal cell, when  $Ra<Ra_{t,r}$ the reversals are MVL dominant, and when
 $Ra>Ra_{t,r}$ the reversals are CVL dominant. It is natural to ask whether it is possible to distinguish the MVL reversals from the CVL reversals in the normal cell. In addition, as in the corner-less cell the corner vortices are eliminated, the reversals in this geometry should be all MVL. One would expect that the reversal frequency in the corner-less cell should behave similarly as the MVL reversals in the normal cell. To answer these questions, we examine the duration time
 $t_{d}$ of the reversals, i.e. the time it takes for the flow to switch from one direction to the other direction. In the normal cell, when
 $Ra<Ra_{t,r}$, as the interior of the main vortex is already broken, the breakdown time of the main vortex and the reversal process should not take long; when
 $Ra>Ra_{t,r}$, the main vortex is very stable, it takes some time for the corner vortices to drain energy from the main vortex, then grow, and weaken then break the main vortex – thus it will take a longer time for the reversal to be accomplished. We found that it is indeed the case that the averaged duration time
 $t_{d}/t_{E}$ increases with
 $Ra$, and
 $t_{d}/t_{E}<1$ when
 $Ra<Ra_{t,r}$ (MVL reversal dominant) and
 $t_{d}/t_{E}>1$ when
 $Ra>Ra_{t,r}$ (CVL reversal dominant). Another more direct way to examine the average behaviour of
 $t_{d}$ is to show the ensemble-averaged time traces of
 $\unicode[STIX]{x1D6FF}$ during the reversals (see Xi et al. (Reference Xi, Zhang, Hao and Xia2016) for details on the calculation of the ensemble average). In figure 5(a,b) we show the ensemble-averaged temperature difference
 $\widetilde{\unicode[STIX]{x1D6FF}}(t)$ for the MVL reversal dominant regime (
 $Ra=1.15\times 10^{8}<Ra_{t,r}$) and the CVL reversal dominant regime (
 $Ra=2.96\times 10^{8}>Ra_{t,r}$), respectively. The ensemble average was performed for the 1405 reversal events identified for
 $Ra=1.15\times 10^{8}$ and for the 217 reversal events identified for
 $Ra=2.96\times 10^{8}$. It is found that indeed in the MVL reversal dominant regime it takes a much shorter time (
 ${\sim}0.4t_{E}$) for the reversal to be accomplished, compared to that in the CVL dominant regime (
 ${\sim}3t_{E}$).
In figure 5(c) we plot the p.d.f. of  $t_{d}$ (normalized by
 $t_{E}$) for two
 $Ra$ (
 $Ra=1.15\times 10^{8}$ and
 $2.96\times 10^{8}$, both at
 $Pr=5.7$) that straddle
 $Ra_{t,r}~(=2.0\times 10^{8})$. In our experiments, these two
 $Ra$ are furthest away from
 $Ra_{t,r}$ and at the same time have enough reversal events for statistical analysis. It is found that for
 $Ra\,(=1.15\times 10^{8})<Ra_{t,r}$, where MVL dominates, the p.d.f. of
 $t_{d}$ is peaked in the small
 $t_{d}$ range with peak value approximately
 $0.15t_{E}$, while for
 $Ra\,(=2.96\times 10^{8})>Ra_{t,r}$, where CVL dominates, the p.d.f. of
 $t_{d}$ is peaked in the large
 $t_{d}$ range with peak value approximately
 $1.45t_{E}$. We have checked the other
 $Ra$: they all show similar behaviour. Since the above two
 $Ra$ are furthest away from each other and straddle
 $Ra_{t,r}$, we decided to use the median value of the two peaks as the separation
 $t_{d}$ between the MVL and the CVL reversals, which is
 $0.8t_{E}$. By using this criterion we sort the reversal events into the MVL and CVL. We then obtain the reversal frequencies
 $f_{MVL}$ for MVL reversals and
 $f_{CVL}$ for CVL reversals. In figure 5(d) we plot the
 $Ra$ dependence of
 $f_{MVL}$ from the normal cell; also plotted is
 $f$ from the corner-less cell, where all the reversals have to be MVL. It is found that
 $f_{MVL}$ and
 $f$ agree not only in the trend but also in amplitude, which reveals that the reversals are indeed controlled by the stability of the main vortex (MVL) in the low-
 $Ra$ regime, and by the destabilization of the corner vortices (CVL) in the high-
 $Ra$ regime, and by using the corner-less cell the latter was almost eliminated. In figure 5(e) we plot
 $f_{CVL}$ from the normal cell. It is found that the frequency of CVL reversal slowly increases when
 $Ra<Ra_{t,r}$, then decreases in a power-law manner with scaling exponent
 $-2.67$. As for very high
 $Ra$ range (
 $Ra\gg Ra_{t,r}$) in the normal cell, all the reversals are CVL; thus
 $f$ and
 $f_{CVL}$ should be the same and it is indeed the case in terms of both the scaling exponents (
 $-2.83$ versus
 $-2.67$) and the amplitude.
4 Summary and discussion
In summary, we have designed a corner-less cell where the corner vortices are eliminated. A comparative study was performed in the corner-less cell and the normal cell. It is found that the reversal of the LSC could also happen in the absence of the corner vortices. In the corner-less cell, overall the reversal frequency decreases with  $Ra$, and it shows a slow decrease followed by a fast decrease, which is consistent with the case in normal cells. Detailed flow visualization reveals that the transition of the reversal frequency in the corner-less cell also originates from the transition of the flow topology from the abnormal single-roll state to the normal single-roll state, like that in the normal cell. The reversal frequency in the corner-less cell is greatly reduced. The reduction of the reversal frequency is more significant, in terms of both the amplitude and the scaling exponent, in the high-
 $Ra$ regime, which reveals that the corner vortices play a more important role in the high-
 $Ra$ regime. The reason is that in the high-
 $Ra$ regime the main vortex is very strong and stable, unless there are some external disturbances to destabilize the main vortex; otherwise it is very hard for the reversal to occur. The corner vortices actually are such external disturbances: they drain energy from the very strong main vortex, weaken and destabilize it, and promote the occurrence of reversals. While in the low-
 $Ra$ regime, the corner vortices are not significant because the main vortex itself is unstable. The instability of the main vortex is enough to accomplish a reversal without the help of the corner vortices. Our results reveal that, although the corner vortices are not necessary for the reversal, the presence of the corner vortices greatly increases the reversal frequency through destabilizing the main vortex, especially in the high-
 $Ra$ regime.
Acknowledgements
We thank P. Tong and Y. Wang for sharing with us the reversal frequency data in their vertical thin circular disk. We are grateful for stimulating discussions with D. Lohse, H. Hu, J. Zhang, K.-Q. Xia and S.-D. Huang, and for support by the NNSF of China (grant nos 11772259 and U1613227), the ‘111 Project’ of China (B17037) and the Fundamental Research Funds for the Central Universities of China (no. 3102019PJ002).
Declaration of interests
The authors report no conflict of interest.



