
Introduction
Ice templating is a directional solidification technique that allows the creation of materials with directional, anisotropic channels or pores which, if designed appropriately (e.g., slow directional solidification with very fine powders that are partially sintered), provide high surface area and high gas permeability. In this technique, particles suspended in a liquid (usually water) are pushed by, and concentrated between, solid dendrites (usually ice) growing along an applied thermal gradient into colonies of parallel lamellar dendrites.[ Reference Deville 1 , Reference Liu, Xu and an Wang 2 ] Particles pushed between the dendrites form lamellar structures (walls) that are inverse-templated from the ice lamellar dendritic structure.[ Reference Scotti, Northard, Plunk, Tappan and Dunand 3 ] Sublimation of the ice creates a porous green body with aligned lamellar channels and walls; sintering promotes wall densification without elimination of the channels.[ Reference Deville 1 , Reference Deville 4 ] This technique has gained considerable attention due to its facile implementation and its ability to tailor micro- and macrostructures (and the associated mechanical and physical properties), such as channel and wall volume fraction, spacing, width, orientation, and surface morphology, as well as microporosity within sintered walls. Because of this flexibility, ice templating has been used to create foams with directional porosity from ceramic,[ Reference Deville 4 ] metallic,[ Reference Jo, Kim, Choi, Sung, Choe and Dunand 5 – Reference Röthlisberger, Häberli, Spolenak and Dunand 10 ] polymeric,[ Reference Schoof, Bruns, Fischer, Heschel and Rau 11 ] and biologic materials,[ Reference Deville 12 ] as reviewed in Deville's monograph.[ Reference Deville 1 ] The literature does not report silicon (Si) ice templating,[ Reference Deville 1 ] with the exception of two recent articles which describes silicon nitride (Si3N4) foams created by nitriding and sintering of ice-templated, freeze-dried Si particle foams, with non-directional[ Reference Hu, Zeng, Xia, Yao and Zuo 13 ] and directional[ Reference Kim and Kim 14 ] solidification. In the latter study, the authors focus on the Si3N4 foams and report little on the precursor Si particle structures directionally solidified at 25 µm/s: they show micrographs of lamellar walls, consisting of ~7 µm Si particles bound with polyvinyl alcohol, before heat treatment under nitrogen at 1350–1450 °C to sinter and nitride them to Si3N4.[ Reference Kim and Kim 14 ]
Si is attracting considerable attention as an anode material for Li-ion batteries due to its low discharge potential and high charge capacity (4200 mAh/g).[ Reference Ge, Fang, Rong and Zhou 15 , Reference Yoo, Kim, Lee, Choi, Choi, Sim, Jung and Kang 16 ] Furthermore, the low discharge potential exhibited by Si anodes can help avoid lithium (Li) plating and the formation of Li dendrites, which are often a safety concern. The use of Si anodes, however, is limited due to extreme volume changes (~400%) during (de)lithiation cycles,[ Reference Ge, Fang, Rong and Zhou 15 , Reference Glazer, Cho, Almer, Okasinski, Braun and Dunand 17 , Reference Chan, Peng, Liu, McIlwrath, Zhang, Huggins and Cui 18 ] and the low diffusion rate of Li ions in Si at high charge rates.[ Reference Ge, Fang, Rong and Zhou 15 ] Creating Si anodes with submicron dimensions and open porosity is a very promising approach to accommodating the volume changes encountered during (de)lithiation cycling.[ Reference Ge, Fang, Rong and Zhou 15 , Reference Glazer, Cho, Almer, Okasinski, Braun and Dunand 17 – Reference Jang, Kim, Chang, Kim, Roh, Choi, Cho, Park, Kim, Luo and Huang 19 ] Moreover, (de)lithiation cycling kinetics can be enhanced by a reduction in diffusion lengths.[ Reference Yoo, Kim, Lee, Choi, Choi, Sim, Jung and Kang 16 ] However, existing methods for processing of porous, nanostructured Si are complex and thus expensive. Recently, studies have shown that sludge recovered from Si wafer cutting processes could be purified and recycled to obtain high-purity Si powders.[ Reference Jang, Kim, Kil and Chang 20 ] These recycled powders, in the form of a cast slurry after mixing with active materials, can then be reused to create anodes for Li-ion batteries in a sustainable manner and at relatively low cost,[ Reference Jang, Kim, Chang, Kim, Roh, Choi, Cho, Park, Kim, Luo and Huang 19 ] but the accommodation of large strains remains a problem, leading to capacity fading and electrode failure. We envision porous Si structures, created by the above method of freeze casting and sintering, as a solution to the problem of damage accumulation of Si anodes, with the following characteristics: (i) high porosity and small feature sizes (accommodating large strains and thus resisting pulverization); (ii) directional porosity (encouraging rapid diffusional flow in the electrolyte); (iii) continuous structure (achieving low electronic resistivity, unlike Si powder beds); and (iv) high surface area (enabling rapid reaction with Li).
In this work, we describe directional freeze casting of 5 vol% Si colloidal suspensions to achieved sintered Si foams with directional aligned channels and walls, and we study the effects of solidification temperature on the foams microstructure. Here, we employ commercially available Si nanopowders as the model system, but recycled Si powder[ Reference Jang, Kim, Chang, Kim, Roh, Choi, Cho, Park, Kim, Luo and Huang 19 ] could be used at a later stage to reduce price and improve the sustainability of these foams.
Experimental methods
Colloidal Si suspensions in deionized water were prepared by using Si nanoparticles (<100 nm, Sigma–Aldrich Co., St Louis, MO, USA), poly (ethylene glycol) (PEG, Sigma–Aldrich Co., avg. Mn: 400) as binder, and ethylene glycol (Consolidated Chemical & Solvents, Quakertown, PA, USA) and Zephrym™ PD4974-LQ-(MH) (CRODA, Columbus, NJ, USA) as dispersants. PEG (2.0 wt% with respect to Si dry powder mass) was dissolved into ~2.5 mL of deionized water with ethylene glycol (2.0 wt% with respect to Si dry powder mass) and stirred for 15 min. Using a separate container, 5 vol% of Si powder (with respect to total volume of deionized water, corresponding to 10.9 wt%) was added to ~7 mL of water and Zephrym (2.0 wt% with respect to Si) and stirred in a vortex mixer for 5 min. Both mixtures were then combined and roll-milled for 48 h at 60 rpm in a Teflon container with yttria-stabilized zirconia spheres.
The colloidal suspensions were poured into insulating cylindrical Teflon molds (26 mm in height and 15.6 mm in inside diameter), to a height of ~13 mm, sealed on the bottom with a thin aluminum foil with high thermal conductivity. The molds containing the colloidal suspension were then placed on a thermoelectric cooling device pre-cooled to −10, −15, −20, or −25 °C. To favor a vertical temperature gradient, the top and sides of the Teflon molds were insulated with polystyrene foam. Once solidification was complete, frozen samples were removed from the mold and placed in a freeze dryer for sublimation (48 h at a collector temperature of −40 °C and a pressure of 0.133 mbar).
The ice-templated green bodies were transferred to a tube furnace (MTI Corporation GSL-1500X-50HG) for sintering under hydrogen atmosphere (99.999% pure H2 gas) in a two-stage process: (i) a binder- and dispersant burnout stage at 300 °C for 1 h; and (ii) a sintering stage at 1300 °C for 4 h. The heating and cooling temperature ramps were 10 and 5 °C/min, respectively. The sintered samples were cut with a razor blade and longitudinal and radial cross-sections were impregnated with epoxy resin, grinded using 320, 400, 600, 800, 1200 grit SiC paper, polished using 6, 3, and 1 µm diamond suspension, and imaged via optical and scanning electron microscope (SEM). ImageJ was used to measure porosity, wall width, and channel width on the cross-sections. Wall and channel widths were determined using the line-intercept method with measurements taken at the top quarter of the foam. Bright gray regions in the SEM micrographs were identified as walls and dark regions infiltrated with epoxy were identified as channels. The number of measurements, per sample, for wall and channel width was in the range of 65–143.
Results and discussion
Microstructure
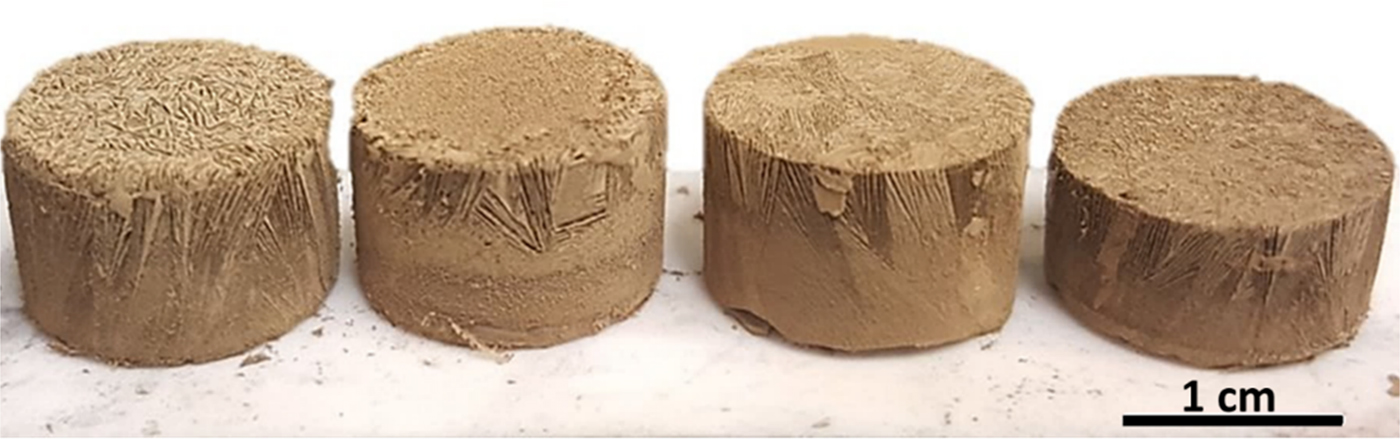
Si suspensions were solidified using freezing substrate temperatures of −10, −15, −20, and −25 °C, sublimated and then sintered. Sintered foams, shown in Fig. 1, are ~12 mm in diameter and 5–7 mm in height, and they display colonies of directional lamellar channels and walls aligned along the vertical solidification direction. Macroscopic volumetric shrinkage was ~63%, with radial shrinkage of ~24%, in general agreement with other ceramic ice-templated structures, where linear shrinkage due to sintering is ~20–30%.[ Reference Deville 1 ]
Ice-templated Si foam after sintering displaying lamellar porosity. Solidification temperature varied from left to right: −10, −15, −20, and −25 °C. The same volume of suspension was used to solidify all samples.

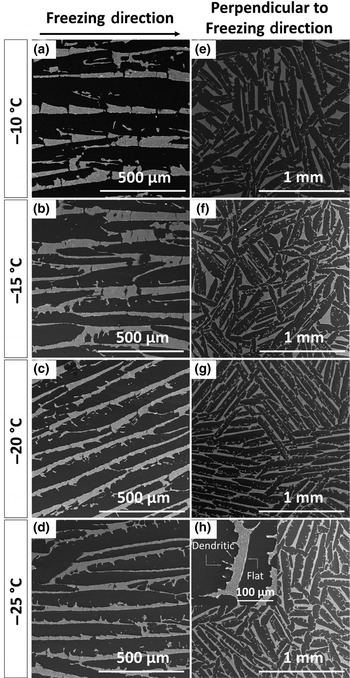
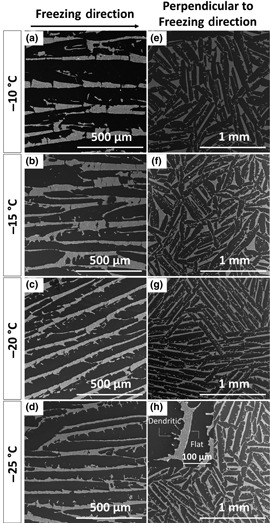
Figures 2(a)–2(h) show SEM micrographs of polished cross-sections, taken in the top quarter of the foam, parallel and perpendicular to the freezing direction, for the four solidification temperatures. Figures 2(a)–2(d) show representative images of the channel/wall morphology parallel to the freezing direction. It is apparent from these micrographs that a decreasing freezing substrate temperature is associated with thinner ice dendrites, and thus thinner channels. This trend is consistent with the literature, where it is well established that, as the solidification temperature decreases, the freeze front velocity increases, promoting the growth of thinner ice dendrites.[ Reference Deville 1 , Reference Deville 4 , Reference Chino and Dunand 7 ] At lower solidification temperatures, undercooling increases, producing a higher number density of ice crystals. Once nucleation occurs, initial ice growth is very rapid due to the high undercooling, resulting in thinner ice dendrites. Moreover, the structure of the Si walls, which are inversely templated by the original ice dendrites, is representative of ice lamellae/dendritic growth, where one side of the ice primary dendrites shows the presence of secondary dendrite arms, while the other has a flat interface. The formation of secondary ice dendrites on only one of the two main surfaces of the lamellar primary dendrites is due to a slow growth velocity perpendicular to the solidification direction and a small tilt of the primary ice dendrites, commonly observed for ice templating of aqueous ceramic suspensions.[ Reference Deville 1 , Reference Deville 4 ] Therefore, it is expected that the growth velocity of secondary arm dendrites will increase as the freeze front velocity increases. Figures 2(e)–2(h) show representative perpendicular cross-section illustrating the increase of one-sided secondary arm dendrites with decreasing solidification temperature.
SEM micrographs of longitudinal (a–d) and perpendicular (e–h) cross-sections of sintered foams as a function of solidification temperature. Brighter regions represent sintered silicon walls and dark areas represent channels. Insert in bottom right micrograph shows wall surfaces (rough on one side and smooth on the other).

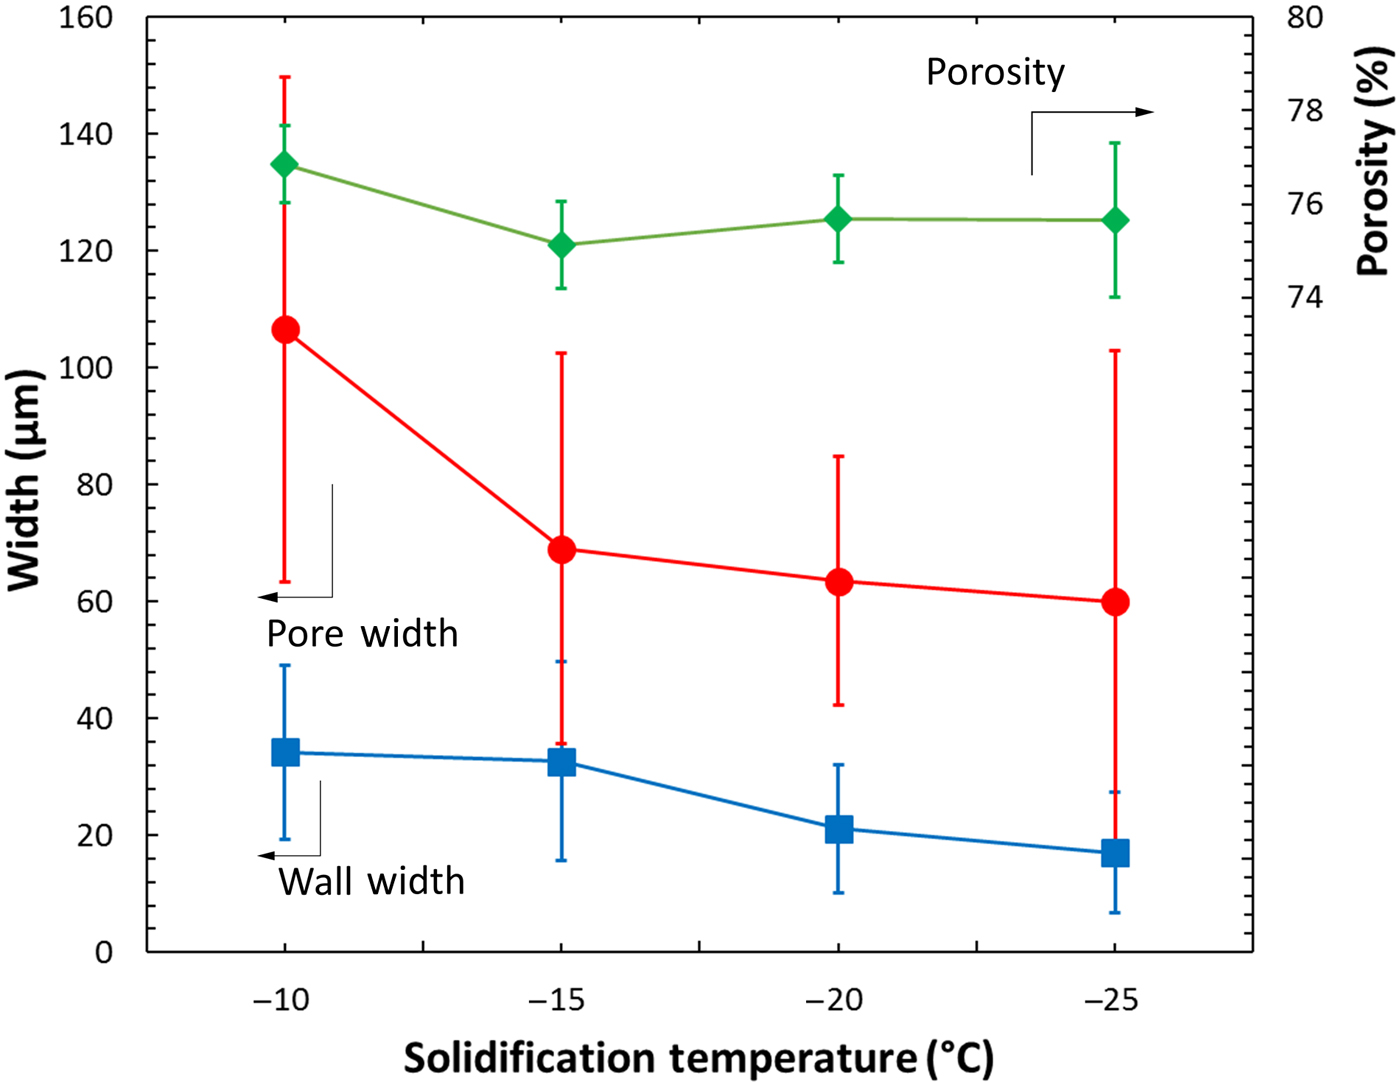
Longitudinal cross-sections of the Si foams were used to determine the average channel and wall width, while perpendicular cross-sections were used to determine the average macroporosity: Fig. 3 shows these parameters as a function of freezing temperature. The porosity stays constant at ~76% as expected, given the constant Si particle volume fraction in the suspension.[ Reference Deville 1 , Reference Seuba, Deville, Guizard and Stevenson 21 ] While porosity in the sintered structures is independent of solidification temperature, both channel and wall widths decrease with decreasing temperature (Fig. 3). Specifically, the average channel width decreases from 106 ± 43 µm at a solidification temperature of −10 °C to 60 ± 42 µm at a solidification temperature of −25 °C, almost a factor 2. The inversely templated Si walls exhibit the same trend, with the average wall width being halved from 34 ± 15 to 17 ± 10 µm with lower solidification temperatures.
Plot of channel width, Si wall width, and foam porosity versus solidification temperature.

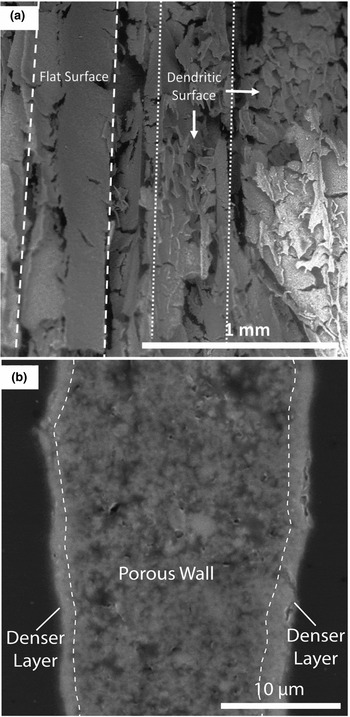
Figures 4(a) and 4(b) show SEM micrographs of the fracture surface of a sintered Si foam ice-templated at −10 °C and the microstructure of a Si wall solidified at −15 °C, respectively. In Fig. 4(a), Si walls with different orientations are visible. A wall with a flat side, as seen in Fig. 2, is shown on the left side of the micrograph, delineated with dashed lines. A wall with the rougher surface (inversely templated from the ice secondary dendrite arms) is visible on the right side of the micrograph, as indicated by dotted lines. Some cracks are evident in the densified walls, which may have been created by ice lenses formed during solidification,[ Reference Deville 1 ] sintering shrinkage or by sectioning.
(a) SEM micrograph of a fracture surface from a sintered Si foam, displaying wall microstructure and pore channels. (b) SEM micrograph of a longitudinal cross-section showing microporosity within a wall with a dense layer at the wall surface.

Figure 4(b) illustrates a sintered Si wall. Some microporosity within the wall is present, but the two surfaces of the wall are nearly dense over a depth of 1–2 µm. We observed 128 randomly selected Si walls: 73% of the walls showed, on one or both of their surfaces, a similar 1–2 µm thin region which was nearly fully dense, while the remaining walls had no, or only a partial, densified surface region. This surface densification may reflect the accumulation of silica created by the reaction of residual oxygen in the sintering atmosphere. Previous studies have shown that a silica layer on fine Si particles (<100 nm) helps densification at high temperatures (>1100 °C) by promoting lattice diffusion, which contributes to densification, at the expense of surface diffusion, which does not.[ Reference Lebrun, Sassi, Pascal and Missiaen 22 ] Moreover, experiments in which the silica layer has been reduced do not display densification beyond 65% relative density for a sintering time of 3 h at 1315 °C (with a particle size of 220 nm).[ Reference Lebrun, Sassi, Pascal and Missiaen 22 ] The presence of silica on the surface of our powders, therefore, could be a key to achieving highly densified Si walls. This suggests that the sintering kinetics and residual microporosity of ice-templated Si foams can be further tuned by adjusting the water vapor pressure in the furnace, besides the usual sintering parameter of time, temperature and particle size.
Si foams as precursors
While the motivation of this study was to create porous, lamellar Si structures for Li-ion battery applications, ice-templated Si foams may be used as a precursor for various other compounds, including silicon carbide (SiC), nitride and oxides, and metal silicides. Gas-phase nitridation is a well-established method to create Si3N4.[ Reference Hu, Zeng, Xia, Yao and Zuo 13 ] Si3N4 foams created via various methods (e.g., freeze casting of Si3N4 powders, direct Si powder nitridation and sintering, emulsions and reduction–nitridation of silica) exhibit high surface area, good thermal shock resistance, high thermal conductivity, high gas permeability, and excellent high-temperature strength for applications such as heat exchangers, catalyst and filter.[ Reference Hu, Zeng, Xia, Yao and Zuo 13 , Reference Yin, Zhou, Yu and Wang 23 – Reference de Moraes and Colombo 26 ] All these properties are improved by the directional interconnected channel structure inherent to directional freeze casting. Similarly, SiC foams could be created via carburization of freeze-cast Si foams: such carburization is rapid on small features; as demonstrated previously on Si nanopillars,[ Reference Ollivier, Latu-Romain and Latu-Romain 27 ] SiC foams have also been created by freeze casting of SiC particles and sintering at 1800–1900 °C,[ Reference Naglieri, Bale, Gludovatz, Tomsia and Ritchie 28 ] or by freeze casting of polycarbosilane/camphene solution, followed by decomposition. Further examples of freeze-cast Si3N4, SiC and SiO2 are summarized in Deville's monograph.[ Reference Deville 1 ] Finally, gas-phase reaction with metal precursors—e.g., halides based on refractory metals such as Cr, Nb, Mo, Ta, W—could be used to transform, partially or fully, the Si to the corresponding silicide, resulting in a foam with a much higher melting point than Si and high-temperature strength and ductility.
Furthermore, a freeze-cast Si foam could be infiltrated with a liquid metal or alloy, e.g., pure Mg to form Mg2Si (for thermoelectric applications) or a eutectic Al-12%Si melt which is at chemical equilibrium with Si, thus avoiding dissolution or reaction of the Si walls. This approach was taken for the infiltration of packed Si powders by liquid aluminum.[ Reference Chen and Chung 29 ] Such an interpenetrating Si/Al-12Si composite will display an unusual combination of low thermal expansion and high thermal conductivity (useful for electronic substrates), as well as low density, high wear resistance, and high specific strength and stiffness (useful for structural applications). This concept was recently applied to ice-templated tungsten foams, infiltrated with liquid copper to create W/Cu composites with anisotropic electrical conductivity.[ Reference Röthlisberger, Häberli, Galinski, Dunand and Spolenak 30 ]
Conclusions
Here, we demonstrate ice templating of 5 vol% Si colloidal aqueous suspensions to produce Si foams with directionally aligned lamellar channels, after ice removal and sintering. The following conclusions are drawn:
The macroporosity of the freeze-dried Si powder foams is reduced from 95% to ~76% after sintering, while volumetric shrinkage of the samples is ~63%. The Si walls are nearly fully sintered, likely due to the role of silica in aiding densification.
The macroporosity of the sintered foams, ~76%, is unaffected by changes in the solidification temperature. By contrast, the width of the channels decreases with decreasing temperature, due to faster freeze front velocities. The width of the Si walls concurrently decreases too.
The channel morphology, which is templated from the ice dendrites, is consistent with that of other ice-templated ceramic systems such as alumina or Si3N4, where secondary dendrite arms grow on only one side of the ice crystals.
These Si foams provide a platform for studying the properties of Si with directional anisotropic pores created by ice templating, offer promise for energy applications such as battery electrodes, and may further be processed into carbide, nitride, oxide and silicide foams.
Acknowledgments
This study was supported by the National Science Foundation (NSF) via CMMI-1562941 (September 2016-January 2017). F.L.R.T also acknowledges the support of a NSF Graduate Research Fellowship. This work made use of the EPIC facility of Northwestern University's NUANCE Center, which has received support by NSF ECCS-1542205 and DMR-1121262; and the Materials Characterization and Imaging Facility supported by NSF DMR-1121262. F.L.R.T acknowledges experimental assistance from Mr. Ritij Goel, Ms. Kristen Scotti, and Ms. Shannon L. Taylor (Northwestern University). Useful discussions with Ms. Kristen Scotti are acknowledged.