INTRODUCTION
Children with Specific Language Impairment (SLI) fail to develop expressive and/or receptive oral language at the same rate and/or to the same extent as typically developing children, despite adequate intelligence, peripheral sensory functioning, exposure to language, and no neurological, emotional, or social dysfunction (Bishop, Reference Bishop1997; Leonard, Reference Leonard2014; Rice, Reference Rice2013). Compared to same-age peers, these children demonstrate an uneven profile of abilities across domains of language, with most experiencing difficulties in grammatical morphology and syntax, but many also demonstrating difficulties in lexical and pragmatic skills (Leonard, Reference Leonard2014). Difficulty in lexical processes underlying spoken word recognition is well documented in SLI: inefficiency or inaccuracy in establishing, accessing, selecting, and retrieving from stored representations of spoken language (Dollaghan, Reference Dollaghan1998). For example, children with SLI tend to have smaller overall expressive/receptive vocabulary (Hick, Botting & Conti-Ramsden, Reference Hick, Botting and Conti-Ramsden2005) and impaired phonological processing (Briscoe, Bishop & Norbury, Reference Briscoe, Bishop and Norbury2001), use fewer different words per utterance (Rice, Redmond & Hoffman, Reference Rice, Redmond and Hoffman2006; Wong, Klee, Stokes, Fletcher & Leonard, Reference Wong, Klee, Stokes, Fletcher and Leonard2010b), and are less accurate in nonword repetition (Estes, Evans & Else-Quest, Reference Estes, Evans and Else-Quest2007).
Multiple accounts have been proposed to explain the different language deficits observed in children with SLI, and much research has focused on the grammatical deficit account and the processing deficit account (Joanisse & Seidenberg, Reference Joanisse and Seidenberg1998; Leonard, Reference Leonard2014). Some researchers have also explored the possibility of deficits in specific mechanisms such as lower-level auditory perception (Corriveau, Pasquini & Goswami, Reference Corriveau, Pasquini and Goswami2007; McArthur & Bishop, Reference McArthur and Bishop2004a, Reference McArthur and Bishop2004b; Tallal & Piercy, Reference Tallal and Piercy1974), but little research to date has focused on auditory perception and word recognition deficits within the same children with SLI (but see Montgomery, Reference Montgomery1999). The present study responded to this research gap by focusing on lexical access for spoken word recognition in SLI, and whether and how it might be related to auditory perception.
Spoken word recognition and the speech-gating task
Spoken word recognition occurs when auditory perceptual input activates a single lexical phonological representation. Activation begins upon receipt of auditory input and is updated as the input unfolds. The activation seems to be graded according to word- and cohort-related factors, and multiple words can be activated in parallel and actively compete until a single match is selected (McMurray, Samelson, Lee & Tomblin, Reference McMurray, Samelson, Lee and Tomblin2010). Word recognition can thus be conceptualized as selective elimination from an activated cohort of potential targets until the ‘isolation point’ – the point within the word for which no other word matches are possible (Marslen-Wilson, Reference Marslen-Wilson1987).
Spoken word recognition may be facilitated by developmental restructuring of phonological representations. That is, ongoing reorganization of the lexicon such that representations are stored for accuracy and expediency (e.g. Metsala & Walley, Reference Metsala, Walley, Metsala and Ehri1998; Walley, Metsala & Garlock, Reference Walley, Metsala and Garlock2003); with development, primarily between ages one to eight (Fowler, Reference Fowler, Brady and Shankweiler1991), words with overlapping phonological properties are stored more systematically for better differentiation. Word frequency and neighborhood density (i.e. the number of acoustically similar words) have been posited to drive lexical restructuring. High- rather than low-frequency words should have better-developed representations because the former are activated more often. Words from high-density phonological neighborhoods should be under relatively strong pressure to differentiate from other lexical entries to enable recognition (Charles-Luce & Luce, Reference Charles-Luce and Luce1990; Garlock, Walley & Metsala, Reference Garlock, Walley and Metsala2001). Lexical restructuring has been observed across alphabetic languages (Ziegler & Goswami, Reference Ziegler and Goswami2005) – which map morphemes onto phonemes or phoneme strings – as well as a logographic language that maps morphemes consistently onto syllables (i.e. Chinese; Kidd, Shum, Ho & Au, Reference Kidd, Shum, Ho and Au2015).
Speech-gating, a behavioral task that estimates the point within spoken words beyond which correct recognition is possible (Allopenna, Magnuson & Tanenhaus, Reference Allopenna, Magnuson and Tanenhaus1998; Grosjean, Reference Grosjean1980), has been used productively and widely to study spoken word recognition and lexical development models. In a typical non-contextual forward speech-gating task, spoken words are presented from their onset in segments (or ‘gates’) typically 50 ms in length, with word identification attempted after hearing each gate. On each trial, an additional gate is added, with trials only ending when each word has been heard in its entirety. The accumulated time increment at which recognition occurs without subsequent change of mind (the ‘acceptance point’) is thought to reflect the temporal window over which word recognition occurs. This temporal window has been suggested to directly reflect the underlying organization of the representation: well-established structure facilitates expedient word recognition because the cohort of incorrect matches can be rapidly discounted, and less-established representations impede word recognition because the cohort remains protractedly active (Metsala, Reference Metsala1997). Thus the speech-gating task has been used to quantify the underlying structure of the phonological representations supporting spoken word recognition. Consistent with this, Metsala observed that time taken to correctly identify gated words decreased with age, and that word frequency and neighborhood density effects were predicted by lexical restructuring. These findings have been replicated in other gating studies (Griffiths & Snowling, Reference Griffiths and Snowling2001; Kidd et al., Reference Kidd, Shum, Ho and Au2015; Metsala, Stavrinos & Walley, Reference Metsala, Stavrinos and Walley2009).
Speech-gating in SLI
Speech-gating has been used for assessing spoken word recognition in SLI. Dollaghan (Reference Dollaghan1998) compared SLI children with typically developing age-matched controls on their recognition of gated familiar and unfamiliar words. There were no group differences for familiar words, but children with SLI needed to hear more of the unfamiliar words to recognize them than did the controls. These findings did not support a task-related impairment. Instead, the deficit seemed specific to the phonological representations of unfamiliar words and the ability to distinguish them from the better-established representations of familiar words. Accessing less-established representations probably increases processing demands, leaving word recognition vulnerable. Children with SLI were also less likely to produce the correct initial consonant at the earliest gate for all word types, suggesting lower-level auditory perceptual deficits that impede the initial acoustic-phonetic analysis (Dollaghan, Reference Dollaghan1998).
Montgomery (Reference Montgomery1999) used speech-gating of highly familiar words to examine whether children with SLI were impaired in ‘lexical mapping’ (i.e. lexical access and lexical activation) – the stage when auditory perceptual input undergoes acoustic-phonetic analysis. No group differences were found between children with SLI and their typically developing peers matched on either age or vocabulary, arguing against word recognition and low-level auditory perceptual deficits in SLI (Sutherland & Gillon, Reference Sutherland and Gillon2005). Mainela-Arnold, Evans, and Coady (Reference Mainela-Arnold, Evans and Coady2008) likewise observed neither group difference in spoken word recognition isolation points between SLI children and age-matched controls, nor any interaction between SLI status, word frequency, and neighborhood density. However, children with SLI vacillated more between the target and incorrect cohort items after the isolation point, suggesting that word recognition in SLI is more vulnerable to interference from competing activated representations. This finding was replicated by Marshall and van der Lely (Reference Marshall and van der Lely2008).
Wong, Kidd, Ho, and Au (Reference Wong, Kidd, Ho and Au2010a) found that Cantonese-Chinese speaking children with SLI (particularly those with comorbid dyslexia) had significantly later isolation points for high-frequency words, and for high-density words, compared to language-typical peers as well as children who had a history (but no current diagnosis) of SLI. These findings suggest that the phonological representations of children with SLI have not been restructured to the same extent as those of typically developing children. Importantly, the subpar speech-gating performance observed in SLI could not be attributed to overall poorer vocabulary because the deficit was limited to high-frequency words and high-neighborhood-density words.
Collectively, the findings on speech-gating and SLI hint at difficulties in some aspects of spoken word recognition in SLI, particularly in Cantonese Chinese. Wong et al.'s (Reference Wong, Kidd, Ho and Au2010a) study stands alone in the literature by reporting frequency and density effects in SLI using speech-gating. However, given their focus on SLI–dyslexia comorbidity, of the twenty children with a current diagnosis of SLI, only ten had SLI without comorbid dyslexia. Therefore, the robustness of the findings from speech-gating regarding SLI remains unclear. The present study therefore set out to take a closer look at these effects, particularly those reported in Wong et al.'s (Reference Wong, Kidd, Ho and Au2010a) study, in a much larger sample of children with SLI.
Phonological processing in SLI
Difficulties in phonological processing skills are well documented in SLI (e.g. Bishop & Snowling, Reference Bishop and Snowling2004). Snowling (Reference Snowling2000) hypothesized that phonological deficits might lead to poorer quality phonological representations, which might in turn impair the development of phonological processing skills. Poorly established representations would be difficult to access and use, limiting phonological awareness (e.g. syllable awareness, onset and rime awareness, phoneme deletion, etc.). Poorer quality phonological representations might also impair access and retrieval of phonological information, evident via slower and perhaps more errant Rapid Automatized Naming (RAN) performance. Likewise, the ability to maintain phonological information in short-term memory sufficient to either create or refine phonological representations will likely influence the quality of the representations (Claessen, Leitão, Kane & Williams, Reference Claessen, Leitão, Kane and Williams2013). There are potentially very informative relations between phonological processing skills and the structure of the underlying representation, particularly in SLI. However, these relations have not been fully explored using the speech-gating task to quantify the underlying structure of the phonological representation. To do so was a goal of the present study.
Auditory perception in SLI
According to McMurray et al. (Reference McMurray, Samelson, Lee and Tomblin2010), subpar speech-gating suggests more lexical decay – entropy in lexical representations – in SLI that prevents full activation of some, if not all, phonological representations, rendering them vulnerable to active competitors. This can explain why children with SLI take longer than language-typical controls to reach the acceptance point after the isolation point. However, it does not explain the difficulties with the initial consonant in SLI reported by Dollaghan (Reference Dollaghan1998); an additional account is in order.
One possibility is that children with SLI have low-level auditory perceptual deficits (Dollaghan, Reference Dollaghan1998; McArthur & Bishop, Reference McArthur and Bishop2001; Rosen, Reference Rosen2003). Tallal (Reference Tallal, Bishop and Leonard2000) reported that ‘language learning impaired’ children were less able to differentiate and/or sequence brief tones (i.e. different tones at short inter-stimulus intervals, ISI). Such a deficit in ‘temporal processing’ was hypothesized to inhibit accurate perception of rapid transitions in speech and to impair “the formation of distinct (categorical) phonological representations, leading to delay or disruption in language” (Benasich & Tallal, Reference Benasich and Tallal2002, p. 33), also implicating phonological processing skills, and potentially reading skills, in this causal chain (e.g. Tallal, Reference Tallal1980). Auditory perception in SLI has been studied using variations of Tallal's auditory repetition task and other putative ‘temporal’ auditory tasks (e.g. backward detection/recognition masking, gap detection, tracking of rapid spatial changes; Rosen, Reference Rosen2003), with equivocal results. Importantly, the potential mediating role of phonological representations in the hypothesized relation between auditory perception and phonological processing skills has not been explicitly examined. No study has yet examined whether both the quality of phonological representations pertinent to spoken word recognition – assessed with speech-gating – and low-level auditory perception are impaired in the same individuals with SLI. Without such empirical information, these causal relations must remain speculative.
Tallal's (Reference Tallal1980) auditory repetition task inherently conflates frequency discrimination (FD) with general stimulus-based judgments. Note that people with SLI often struggle with practice trials for the auditory repetition task where tone discrimination, not temporal processing, was stressed (Heath, Hogben & Clark, Reference Heath, Hogben and Clark1999), so poorer performance was not limited to short ISIs during the task proper (e.g. Share, Jorm, McClean & Matthews, Reference Share, Jorm, McClean and Matthews2002). Neither is poor performance necessarily limited to ‘temporal’ tasks – indeed Nickisch and Massinger (Reference Nickisch and Massinger2009) found reduced performance in SLI only on tasks with an FD component, not those assessing temporal processing. These results collectively suggest a difficulty with FD in SLI, at times (though not always) exacerbated by task-related pressures.
Poor FD may well turn out to undermine language learning, particularly in tonal languages such as Cantonese Chinese (Wong, Ciocca & Yung, Reference Wong, Ciocca and Yung2009). Speech comprises rapid changes in spectral information. Deficits in fine-grained FD can mean difficulties discriminating spectral patterns in speech signals, which can in turn degrade phonological representations (McArthur & Bishop, Reference McArthur and Bishop2004a). There is behavioral, as well as electrophysiological evidence, that at least some children with SLI perform poorly on FD tasks (Hill, Hogben & Bishop, Reference Hill, Hogben and Bishop2005; McArthur & Bishop, Reference McArthur and Bishop2004a, Reference McArthur and Bishop2004b; Reference McArthur and Bishop2005; McArthur, Ellis, Atkinson & Coltheart, Reference McArthur, Ellis, Atkinson and Coltheart2008; Mengler, Hogben, Mitchie & Bishop, Reference Mengler, Hogben, Mitchie and Bishop2005; Rinker, Kohls, Richter, Maas, Schultz & Schecker, Reference Rinker, Kohls, Richter, Maas, Schultz and Schecker2007), and continue to do so over time (Hill et al., Reference Hill, Hogben and Bishop2005). Nonetheless, because poor FD does not consistently predict SLI, more research is needed to clarify this (Halliday & Bishop, Reference Halliday and Bishop2006; Rosen, Reference Rosen2003).
Accurate speech processing also seems to require sensitivity to modulations in frequency (Frisina, Reference Frisina2001). According to Bailey and Snowling (Reference Bailey and Snowling2002), reduced sensitivity to frequency modulation (FM) when young children are establishing and refining phonological representations may well affect subsequent language ability. In a typical FM detection task, the modulation rate is fixed and the depth is varied across trials, and the task is to differentiate modulated from un-modulated tones. Stefanatos, Green, and Ratcliff (Reference Stefanatos, Green and Ratcliff1989) found markedly reduced auditory-evoked-responses to FM tones among children with SLI, but Tomblin, Abbas, Records, and Brenneman (Reference Tomblin, Abbas, Records and Brenneman1995) could not replicate this. Bishop, Carlyon, Deeks, and Bishop (Reference Bishop, Carlyon, Deeks and Bishop1999) speculated that the severity of receptive impairments might be at issue, and their own research revealed a non-significant trend for elevated FM thresholds in SLI, but the thresholds did not predict phonemic awareness. The exact contribution of FM to speech recognition, then, remains unclear.
The present study
The mixed findings on FD and FM in SLI call for empirical clarification. Crucially, little research has focused on how spoken word recognition deficits fit with potential auditory perception deficits in SLI. The present multilevel investigation therefore examined FD, FM, and speech-gating within the same children – children with a diagnosis of SLI, and age-matched controls. With a relatively large sample, we focused on two main questions:
-
1. Do children with SLI perform worse than age-matched language-typical controls on spoken word recognition (assessed via speech-gating), frequency discrimination (FD), and frequency modulation (FM)?
-
2. Does performance on the speech-gating task mediate any relation between auditory thresholds, phonological processing, and oral language?
METHOD
Participants
The sample comprised 110 native speakers of Cantonese Chinese aged between 5;4 and 6;11, mean 5;10 (years;months), attending kindergarten in Hong Kong. Fifty-seven (39 male, 18 female) met criteria for SLI (Bishop, Reference Bishop1997; Leonard, Reference Leonard2014): they performed below age-expected levels in receptive and/or expressive language, passed cognitive and hearing screening, and demonstrated no history or signs of neurological or psychosocial problems. Fifty of them had already been diagnosed with SLI when recruited from government-run Child Assessment Centers via voluntary referral from speech pathologists. The remaining seven, recruited from local kindergartens, were classified as SLI at the time of testing. Five senior students in speech–language pathology, under the supervision of an experienced speech–language pathologist, confirmed the SLI status of these fifty-seven children using the Hong Kong Cantonese Oral Language Assessment Scale (HKCOLAS: T'sou et al., Reference T'sou, Lee, Tung, Man, Chan, To and Chan2006) – a standardized test with local norms for diagnosing language impairments in children aged five to twelve. These children all failed (i.e. scoring 1·25 SD below the mean) two or more of the six subtests in the HKCOLAS, and met the other conventional diagnostic criteria (Leonard, Reference Leonard2014). Their nonverbal IQ scores all fell within the normal range on the Raven's Standard Progressive Matrix according to local age norms (Raven, Reference Raven1986, Table 1).
The fifty-three children (26 male, 27 female) in the language-typical control group were recruited from kindergartens in Hong Kong. They passed a language screening, scoring no worse than 1·25 SD below the age-normed mean on the Cantonese Grammar and the Nominal Expressive Vocabulary subtests of the HKCOLAS – the two subtests recommended for assessing preschool and first-year primary school children when under administration time constraints (To, Cheung & T'sou, Reference To, Cheung and T'sou2007). In the Cantonese Grammar test, children were asked to match pictures with the sentences heard, answer questions targeting specific grammatical morphemes, and make grammaticality judgments about complex sentences. For the Expressive Vocabulary subtest, children were shown pictures of objects and asked to name them. Children in the control group were also given the Narrative Retell subtest, whereby they listened to a story and retold it to a naive listener. Scoring was based on story content and the use of referring expression, connectives, and complex sentences in the retell. Non-verbal IQ scores in the control group all fell within the normal range of locally normed Raven's Standard Progressive Matrix scores (Raven, Reference Raven1986).
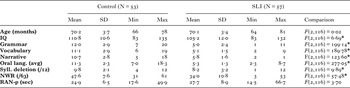
All children passed a hearing screening of pure tones of 0·5, 1, 2, and 4 KHz presented at 30 dB in both ears, measured using a Grason-Stadler GSI model 17 calibrated audiometer. No children were reported to have otitis media around the time of testing, or to have a diagnosis of attention deficit and/or hyperactivity disorder, or other psychosocial problems. All children spoke Cantonese Chinese as their first and dominant language. Descriptive and comparative statistics for both groups are presented in Table 1.
Descriptive statistics and between-group comparisons on the psychometric test results. All scores are raw scores, except for IQ given in standard scores with a mean of 100 and SD of 15, and for oral language tests (Grammar, Vocabulary, and Narrative) and their average (Oral lang. (avg)) given in scaled scores

note: * significant at p < ·01.
Materials
Psychometric tasks
1. Phonological processing
In a syllable-deletion task adopted from Ho, Leung, and Cheung (Reference Ho, Leung and Cheung2011), children were asked to repeat real Chinese words composed of three syllables each, while deleting one of its syllables from the beginning, middle, or end of the word. An example, translated to English, would be: ‘Please say little-fat-pig. Now say little-fat-pig again, this time without saying fat.’ Deletion of a syllable results in either a real word or a nonword. The maximum score for this task was 12.
In a non-word repetition task (Ho et al., Reference Ho, Leung and Cheung2011), children were asked to repeat nonwords with two to six syllables. These non-words were meaningless combinations of actual Cantonese morphemes, with one syllable per morpheme. A child received 1 point for each of the syllables correctly repeated and 1 point for correct ordering of any two consecutive syllables. Points were deducted for adding syllables. The maximum score for this task is 63.
Children were asked to name five common objects (sun, apple, butterfly, airplane, fan) depicted by line drawings, presented randomly in a 5 × 4 matrix, as quickly and as accurately as possible (Ho et al., Reference Ho, Leung and Cheung2011). Each child named them from left to right, one row after the other. Children were asked to complete the task twice, the score being the time taken to name the twenty drawings, averaged across two trials.
Experimental tasks
2. Frequency Discrimination (FD)
This task was modeled on that used by Hogben and colleagues (Heath, Bishop, Hogben & Roach, Reference Heath, Bishop, Hogben and Roach2006; Hill et al., Reference Hill, Hogben and Bishop2005; Mengler et al., Reference Mengler, Hogben, Mitchie and Bishop2005), and was administered with a Matlab program via headphones on a laptop computer. In each trial, stimuli were three 1000 ms binaural pure tones with 10 ms rise/fall and 300 ms ISI, presented in the AXB format. The first tone (A) was a 1000 Hz standard, and the third comparison tone (B) had a frequency of 1000 Hz plus the frequency difference for that trial. The middle tone (X) was the same frequency as either (A) or (B), which varied randomly across trials. Each child was to indicate, by pressing either ‘1’ or ‘3’ on the keypad, which of tones A or B matched tone X. Feedback was given via the presentation of a cartoon ‘sad’ or ‘smiley’ face on the screen.
The frequency difference between the standard and comparison tones was varied between trials via an adaptive 3-up, 1-down staircase reversal procedure (Wetherill & Levitt, Reference Wetherill and Levitt1965), which estimated the 79% correct performance level. The initial frequency difference was 40 Hz. The initial step-size was 8 Hz, which halved after each reversal until the minimum of 1 Hz. The staircase lasted for eight reversals, and the Just Noticeable Difference (JND) was defined as the average frequency difference of the final four reversals. Blocks of ten practice trials were first administered (all with a frequency difference of 40 Hz) until the child achieved a criterion of at least seven out of ten correct.
3. Frequency Modulation detection (FM)
This task was modeled on that used by Heath et al. (Reference Heath, Bishop, Hogben and Roach2006). Stimuli were two 1000 Hz, 500 ms tones with 10 ms rise/fall and 500 ms ISI. To measure frequency modulation detection, one tone (the standard) was unmodulated, and the other tone (the comparison) was sinusoidally modulated at 2 Hz. The presentation order of the standard and comparison was varied randomly across trials. The task was to indicate, by pressing ‘1’ or ‘2’ on the keypad, which was the modulated tone (i.e. the tone that ‘wobbled’).
Modulation depth was varied adaptively across trials using a standard 3-up, 1-down adaptive staircase procedure (Wetherill & Levitt, Reference Wetherill and Levitt1965). The initial depth was 20 Hz (i.e. the frequency ranged from 990 Hz to 110 Hz). The initial step-size was 4 Hz, which halved after each reversal until a minimum of 1 Hz. The staircase lasted for eight reversals, with the threshold defined as the average depth of the final four reversals. The procedure was otherwise identical to the FD task.
4. Speech-gating
This task was identical to that described by Wong et al. (Reference Wong, Kidd, Ho and Au2010a) and Kidd et al. (Reference Kidd, Shum, Ho and Au2015). The stimuli were sixteen frequently used Cantonese monosyllabic nouns, ranged in length from approximately 400 ms to 900 ms (see ‘Appendix’). They were digitally recorded at a sampling rate of 44·1 kHz in a sound-attenuated booth by a native Cantonese-speaking male and stored as .wav files, which were then called into the custom-written Matlab program for the task. Eight words were high frequency and eight were low frequency, according to word rankings obtained from an on-line database (an approximately 151,000 spoken word corpus derived from spontaneous adult conversations and Hong Kong radio programs. Information on this corpus is available from: kkluke@ntu.edu.sg). Words were ‘high-frequency’ if they ranked above 200 (i.e. likely to occur more than 200 times in every 151,000 spoken words), and ‘low-frequency’ if they ranked below 10.
Cantonese syllables, each represented orthographically by a Chinese logograph (character), display a (Ci)Vt(Ce/G) structure, which generally includes the lexical tone (t) and the nuclear vowel (V) as two obligatory components, and the initial consonant (Ci), the ending consonant (Ce), and the ending glide (G) as optional components (Bauer & Benedict, Reference Bauer and Benedict1997). A few words in Cantonese, however, contain only the nasal consonant ng or m and the tone (e.g. ng5 (five)). In this paper, Cantonese syllables are presented in romanized forms following the scheme adopted by the Linguistic Society of Hong Kong (1994). Numerals following the syllables mark one of the nine lexical tones in the language, with each representing a different fundamental frequency pattern. Syllables with tone 1 to 6 end with a vowel, a diphthong, or a nasal consonant, whereas syllables with tone 7 to 9 end with a stop consonant /p, t/ or /k/. Tone 1 is called the high-level, tone 3 the mid-level, and tone 6 the low-level tone. Tone 7, 8, and 9 are the shortened version of the level tones 1, 3, and 6 respectively. Level tones have a relatively flat contour where the beginning and the ending fundamental frequency do not change substantially. Tone 2, 4, and 5 are the contour tones, meaning that these tones have different starting and ending fundamental frequency values. Tone 2 is the high-rise, tone 4 the low-fall, and tone 5 the low-rise tone. The same syllable carrying different tones will have different lexical meanings. For example, ma1 refers to mother, and ma5 refers to horse.
The sixteen words used in this task included ten with a CVtC structure (e.g. jan4, sam1, beng3), 4 CVtG (e.g. zai2, leoi4), and 2 CV (ce1 and cyu5). While homophones exist for some of these target words (e.g. the very low frequency 仁 ‘kindness’ jan4 is a homophone variant of the target word 人 ‘man’ jan4), effort was made to ensure that all homophones of the target words were extremely low in frequency (i.e. below 1 in 100,000).
Neighborhood density was estimated for each word by hand because no published database detailing such information was available in Cantonese. We used traditional definitions of neighborhood density (i.e. the number of words that overlap with the target word by substituting the onset, nucleus, or final phonemes (Charles-Luce & Luce, Reference Charles-Luce and Luce1990), and we added lexical tone to this list because Cantonese-Chinese is a tonal language. Estimates ranged from 7 (low-density) to 22 (high-density); delineation of ‘high’ and ‘low’ was based on a median split across the sixteen words.
The task was administered with custom-written Matlab (Version 5.2) software on an IBM Thinkpad laptop via headphones with a microphone attachment. A forward-gating, duration-blocked procedure was adopted (Griffiths & Snowling, Reference Griffiths and Snowling2001; Grosjean, Reference Grosjean1980). The first block presented the initial gate for each of the sixteen words in random order. The second block presented the previous gate plus one gate for all sixteen words, again in random order. Successive blocks added another gate such that words were presented in accumulating increments until all sixteen words had been presented in their entirety. Because words differed from one another in length, they each required a different number of gates. Thus, blocks had a reducing set of target stimuli. As in previous studies (Kidd et al., Reference Kidd, Shum, Ho and Au2015; Wong et al., Reference Wong, Kidd, Ho and Au2010a), we used an initial gate length of 250 ms and a subsequent gate length of 50 ms. The proportion of the target word presented over the initial gate varied from ·28 for the longest stimulus to ·66 for the shortest (see ‘Appendix’).
Designed to be a child-friendly computer game, each trial showed a picture of aliens on the screen. A child would first be told that aliens were attempting to learn our language; the child was to listen to each word segment and repeat the word the alien was trying to say. The experimenter initiated each trial via a button press; the speech segment was presented 500 ms thereafter. The picture remained on the screen for the entire trial. The child was given a maximum of 10 s after the speech segment had ended to verbally identify the target word. The next trial was initiated once the child had finished speaking, which rarely required the full 10 s. Children's responses were recorded directly on the computer's hard disk for later coding. After two practice trials using high-frequency monosyllabic concrete nouns, no rest interval between blocks and no feedback was given. Administration time was about 12 minutes. Upon completion, the experimenter showed images of each noun and asked the child to name it. This confirmed children's familiarity with the target words.
General procedure
This research was approved by The Human Research Ethics Committee at the University of Hong Kong. Written informed consent was obtained from all parents/guardians prior to participation. Children also gave verbal assent at the time of testing.
Children were tested in a university laboratory, their kindergarten, or the Child Assessment Centre they attended. As noted earlier, we used the HKCOLAS to confirm the fifty-seven children's SLI status. Two research assistants administered three HKCOLAS subtests (Cantonese Grammar, Nominal Expressive Vocabulary, Narrative Retell) to the control group, and all other tasks (i.e. the psychometric tasks, the FD, FM, and speech-gating tasks) to the full sample. Testing took about 4 hours per child, spread over two or three days: hearing screening, Raven's, and HKCOLAS, then the remaining cognitive and experimental tasks. Parents/guardians received modest cash compensation for participation time and transportation costs to the university.
RESULTS
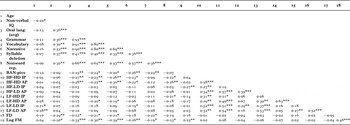
Raw scores from the Raven's test were converted to age-normed standard scores with a mean of 100 and a standard deviation of 15, and scores on the HKCOLAS were converted to scaled scores (Table 1). The three oral language subtests of the HKCOLAS correlated highly (Table 2) and were therefore combined into one composite score (mean z-score). Descriptive and comparative statistics for the SLI group and the control group are presented in Table 1. Significant differences on the oral language subtests reflected the diagnostic criteria and confirmed the group assignment (with versus without SLI). There was no significant difference in age between groups. As expected, the SLI group performed significantly worse than the control group in phonological awareness and non-word repetition. For non-verbal IQ, one child in each group scored below 85; however, their scores (both 83) were still within the average range under the classification of the test (Raven, Reference Raven1986), and thus were not excluded from the study. Group means were both over 100, but the mean non-verbal IQ was significantly lower in the SLI group. We therefore statistically controlled for non-verbal IQ in data analyses wherever feasible.
Pearson correlations among oral language, phonological processing, reading, speech-gating, and auditory measures (* p < ·05; ** p < ·01; *** p < ·001). HF-HD = High-Frequency High-Density; HF-LD = High-Frequency Low-Density; LF-HD = Low-Frequency High-Density; LF-LD = Low-Frequency Low-Density; IP = Isolation Point, the mean number of gates required to first identify the target word correctly; AP = Acceptance Point, the mean number of gates required to correctly identify the target word without subsequent change of response

Poorer auditory thresholds in SLI?
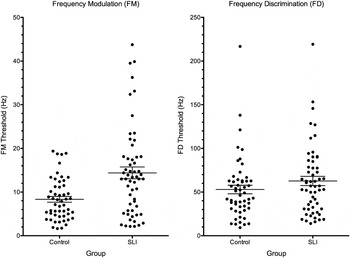
Thresholds for both auditory tasks were checked for outliers: none converted to z > 3·19 (corresponding to p < ·001, two-tailed), therefore none were removed. For the staircase tracks in both tasks, all but one child (from the SLI group on the FM task) showed an acceptable ‘flattening’ around the threshold following adaptation; that child's threshold and associated auditory data were excluded from further analysis. Table 3 and Figure 1 present the descriptive statistics and threshold distributions, respectively. Thresholds from the FM and FD tasks were significantly related (r = ·48, p < ·001), suggesting some degree of concurrent validity (Heath et al., Reference Heath, Bishop, Hogben and Roach2006).
Distributions of thresholds for FM (left) and FD (right) arranged by group. Horizontal lines indicate group means; error bars indicate standard error of the mean. Datapoints are arranged along the abscissa to avoid overlap.

Descriptive statistics by group for frequency modulation (FM) and frequency discrimination (FD)

Significant skewness for the FM thresholds was observed in the SLI group (skewness = 1·14, SE = ·32), although not the control group (skewness = 0·75, SE = ·33), therefore requiring log transformation. Skewness in the FD data was not significant for either group. ANCOVA revealed that children with SLI performed less well (i.e. had higher thresholds) on both tasks, significantly so for logFM even after controlling for age and non-verbal IQ (F[1,105] = 7·64, p = ·006, η p 2 = ·068), but not for FD (F[1,106] = 0·46, p > ·05, η 2 = ·004).
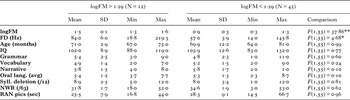
The standard deviation was greatest in the SLI group (Figure 1); 12 children with SLI had a logFM threshold greater than the maximum of the language-typical control group. This is a classic finding in psychophysical experimentation in clinical groups (Roach, Edwards & Hogben, Reference Roach, Edwards and Hogben2004). Do these 12 children represent a discrete subgroup? The data given in Table 4 suggest not. This subgroup differed significantly from the remaining 45 children with SLI only in FD thresholds and not on other key variables examined.
Descriptive and comparative statistics for the subdivided SLI group (above and below the maximum logFM threshold of the control group) on key auditory and psychometric variables (* p < ·05; ** p < ·01)

Poorer spoken word recognition in SLI?
Verbal responses to the target words of the speech-gating task were coded by two trained coders. Inter-rater reliability was good, indicated by high intra-class correlations (R = ·88 and ·83 for IP and AP, respectively). Children's audio-recorded responses were coded as correct or incorrect at each gate for each target word, thus we identified the gate at which the child first correctly identified the target word (the ‘Isolation Point’: IP), and correctly identified the word without subsequently changing that response (the ‘Acceptance Point’: AP). Both IP and AP were expressed as the mean number of gates required for correct word identification.
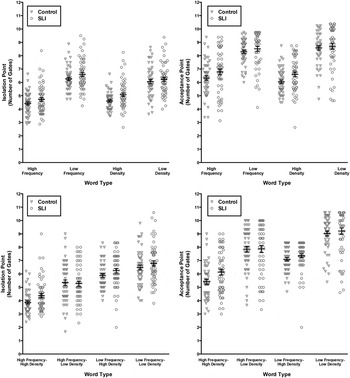
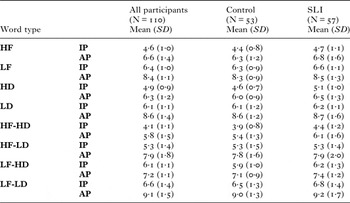
The results are presented in Table 5 and Figure 2. Ceiling effects were not observed for any word type (Figure 2). Consistent with Metsala (Reference Metsala1997), children needed to hear more gates for low-frequency (LF) words than high-frequency (HF) words to both recognize and accept them, likewise for low-neighborhood-density (LD) than high-neighborhood-density (HD) words. To examine the effects of word frequency and neighborhood density on spoken word recognition, IP and AP for HF, LF, HD, and LD words were compared using repeated measures ANOVA, with word type as the within-subject factor, and group (SLI versus control) as the between-subject factor, controlling for age and non-verbal IQ. Main effects were significant for word type (F[7,742] = 4·75, p < ·001, η 2 = ·04), and marginal for group (F[1,106] = 3·27, p = ·07, η 2 = ·03), and no significant interaction was found between word type and group (F[7,742] = 1·18, p = ·3, η 2 = ·01). Post-hoc analyses (Tukey's HSD ps < ·001) revealed, as predicted: (i) the IP occurred at a significantly earlier point in the word than the AP for all word types; (ii) significantly earlier IP and AP (i.e. fewer gates) for high-frequency words than low-frequency words; and (iii) significantly earlier IP and AP for high-density words than low-density words. To examine whether some word types took less time to accept than others following their initial recognition, the difference between the IP and AP was calculated by word type for all participants. Absolute values of skewness and kurtosis were all below 1 for these differences. Repeated-measures ANOVA, with age and IQ as covariates, indicated a marginally significant effect of word type in these difference scores (F[3,318] = 2·55, p = ·06, η 2 = ·02). Tukey post-hoc comparisons revealed no significant difference for high- versus low-frequency words. But there was a significant neighborhood density effect: children required fewer gates to commit to a word after first identifying the word if it came from a high- rather than low-density neighborhood (p < ·001).
Distributions of results on the speech-gating task for the control group (triangles) and the SLI group (circles) for each word type.

Descriptive statistics for the speech-gating task (HF = High Frequency; LF = Low Frequency; HD = High Density; LD = Low Density; IP = Isolation Point, the mean number of gates required to first identify the target word correctly; AP = Acceptance Point, the mean number of gates required to correctly identify the target word without subsequent change of response)

Considering the pattern of results separately for each group, the main effect of word type was significant for the SLI (F[7,378] = 4·26, p < ·001, η 2 = ·07) but not for the control group (F[3,350] = 0·96, p = ·5, η 2 = ·02). Among children with SLI, word recognition times indicated by IP and AP were both shorter for high- than low-frequency words, and for high- than low-density words (ps < ·001).
For all word types, children with SLI on average needed to hear more of the target words than controls (Table 5). This difference was significant for high-density words after controlling for age and non-verbal IQ (IP: F[1,106] = 7·47, p = ·007, η p 2 = ·07; AP: F[1,106] = 6·21, p = ·01, η p 2 = ·06), but not for low-density words (IP: F[1,106] = 0·56, p = ·5; AP: F[1,106] = 0·11, p = ·7). Group differences were not found for either high-frequency (IP: F[1,106] = 2·08, p = ·2; AP: F[1,106] = 2·42, p = ·1) or low-frequency words (IP: F[1,106] = 3·43, p = ·07; AP: F[1,106] = 0·92, p = ·3). These results suggested that children with SLI needed to hear a greater proportion of high-density words than language-typical controls in order to identify and accept a target word, perhaps reflecting less restructuring for the phonological representations despite the considerable pressure to differentiate. There was, however, no significant difference between groups in the time between first identifying the word and then committing to it (i.e. the difference between IP and AP) for any word type (Fs[1,106] < ·54, ps > ·4).
We further categorized the word stimuli into four mutually exclusive groups (high-frequency high-density (HF-HD), high-frequency low-density (HF-LD), low-frequency high-density (LF-HD), low-frequency low-density (LF-LD); Table 5) to take a tentative look at how word frequency and neighborhood density might interact to affect word recognition. No significant differences were observed among the four word categories in either word length (F[3,12] = 0·45, p > ·7) or the proportion of word presented in the initial gate (F[3,12] = ·49, p > ·6). We performed two separate ANOVAs (one for IP, and one for AP), with group (SLI versus control) as the between-subject factor, and word category (HF-HD, HF-LD, LF-HD, LF-LD) as the within-subject factor, while controlling for age and IQ. There was a significant main effect of word category for AP (F[3,318] = 5·94, p = ·001, η 2 = ·05) but not IP (F[3,318] = 1·40, p = ·2, η 2 = ·01), and post-hoc comparisons (Tukey's HSD ps < ·01) revealed that the earliest AP occurred for the HF-HD words, followed by the LF-HD words, for which word recognition occurred slightly faster than the HF-LD stimuli. The poorest recognition was on the LF-LD words, which the lexical restructuring hypothesis would predict as under the least developmental pressure to differentiate (Fowler, Reference Fowler, Brady and Shankweiler1991; Metsala & Walley, Reference Metsala, Walley, Metsala and Ehri1998). By contrast, the main effects of group (SLI versus control) were not found to be significant for IP and AP (Fs[1,106] < 2·96, ps > ·09), nor were the interaction effects between word category and group (Fs[3,318] < 2·23, ps > ·09).
Does spoken word recognition mediate between auditory perception, phonological processing, and oral language?
Two-tailed Pearson correlations were calculated among all psychometric, auditory, and speech-gating measures (Table 2). LogFM correlated significantly with all oral language and phonological processing measures, but did not correlate with any of the speech-gating variables.
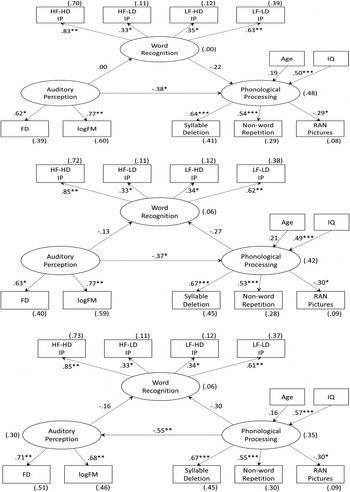
To test for the potential mediation relations among spoken word recognition, auditory perception, and phonological processing, path analyses were conducted using structural equation modeling. Three competing models were tested, and each model showed one of the three latent variables (word recognition, phonological processing, auditory perception) as a mediator between the other two (Figure 3, Models 1–3). In all the models, the auditory perception latent variable was indicated by FD thresholds and logFM, while the phonological processing latent variable was indicated by syllable deletion, non-word repetition, and RAN. IPs of the four word categories (HF-HD, HF-LD, LF-HD, LF-LD) from the speech-gating task were used to tap the latent variable of word recognition. Age and IQ were entered as covariates in all the analyses to partial out their effects. Standardized path coefficients are given in Figure 3.
Structural equation models (Model 1, top; Model 2, middle; Model 3, bottom) on the relationship between auditory perception, word recognition, and phonological processing. Standardized regression coefficients and squared multiple correlations (in brackets) are shown (* p < ·05; ** p < ·01; *** p < ·001).

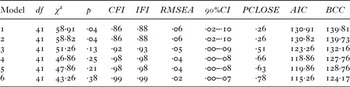
Goodness of fit of the models to the data was evaluated by comparing four fit indices, including chi-square statistic, Bentler's (Reference Bentler1990) comparative fit index (CFI), Bollen's (Reference Bollen1989) incremental fit index (IFI), and the root mean square error of approximation (RMSEA). A significant chi-square (p < ·05) indicates that the observed covariance matrix significantly deviates from the covariance matrix implied by the model, and hence suggests poor model fit. Unlike chi-square, which compares a model with the observed data, both CFI and IFI reflect the relative goodness-of-fit by comparing the fit of a hypothesized model to the fit of a null model. These indices range from ·0 to 1·0, with larger values denoting better model fit. According to the cut-off criteria proposed by Hu and Bentler (Reference Hu and Bentler1999), values close to ·95 and above indicate relatively good fit. RMSEA provides an estimate of the discrepancy in fit per degrees of freedom, and values below ·05 are generally considered as close fit, while values ranging from ·05 to ·08 are accepted as adequate fit (Kline, Reference Kline2004). The p of close fit (PCLOSE) is a one-sided test of the hypothesis that RMSEA is equal to ·05. A significant p value indicates that the model fit is worse than close fitting (i.e. RMSEA is significantly larger than ·05). Akaike information criterion (AIC) and Browne–Cudeck criterion (BCC) were also considered to further compare the models. They are likelihood-based measures of model fit that take into account the complexity of models. When comparing AIC and BCC for multiple models, the smaller the value of the criterion, the better is the model fit to the data. Fit indices for the models are listed in Table 6.

notes: df = degrees of freedom; χ 2 = model chi-square; CFI = comparative fit index; IFI = incremental fit index; RMSEA = root mean square error of approximation; CI = confidence interval; PCLOSE = p value of close fit; AIC = Akaike information criterion; BCC = Browne–Cudeck criterion.
Results of the path analyses on Models 1 to 3 (Figure 3) showed that: (i) auditory perception was significantly related to phonological processing abilities even after controlling for word recognition, age, and IQ; (ii) auditory perception did not predict spoken word recognition; and (iii) spoken word recognition was not significantly related to phonological processing. Fit indices revealed that Model 3, with phonological processing predicting both auditory perception and word recognition, provided a better fit to our data than Models 1 and 2, though none of these models showed values of CFI and IFI higher than ·95. These results argue against a possible mediating effect of spoken word recognition between auditory perception and phonological processing.
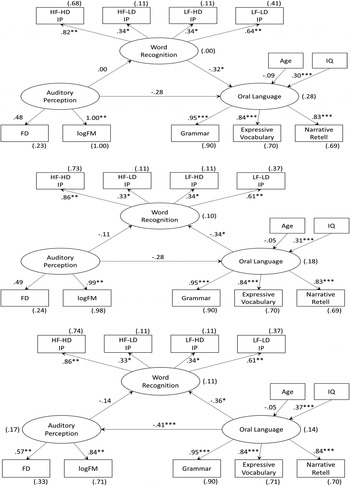
Analogous models (Figure 4, Models 4–6) were tested with oral language specified by the three subtests (Grammar, Expressive Vocabulary, and Narrative-retell). Fit indices for all three models indicated relatively good fit to the data, and both AIC and BCC were slightly lower for Model 6 as compared to Models 4 and 5 (Table 6). Spoken word recognition was a significant predictor of oral language in Model 4, but auditory perception did not predict either word recognition or oral language, and no mediating effect was found. When the direction of prediction was reversed, oral language significantly predicted both word recognition and auditory perception (Model 6).
Structural equation models (Model 4, top; Model 5, middle; Model 6, bottom) on the relationship between auditory perception, word recognition, and oral language. Standardized regression coefficients and squared multiple correlations (in brackets) are shown (* p < ·05; ** p < ·01; *** p < ·001).

DISCUSSION
This study compared SLI and age-matched controls on speech-gating, frequency modulation (FM) detection, and frequency discrimination (FD). We examined whether SLI is characterized by poorer overall performance on the FD, FM, or speech-gating tasks, and whether spoken word recognition – as measured by speech-gating – mediates the relation between auditory perception and phonological processing.
Speech-gating
Between-group comparisons in speech-gating yielded several new findings. First, spoken word recognition developed in the SLI children according to similar pressure constraints as in typically developing children. Children with SLI demonstrated more expedient word recognition for high- than low-frequency words, and for high- than low-density words. It therefore appears that the basic process of spoken word recognition does not differ markedly between children with and without SLI. These findings are in line with findings on another clinical group, namely late talkers. Although late-talking toddlers’ productive vocabularies are smaller than their age-matched peers’, they tend to produce words with high rather than low neighborhood density – just like their language-matched controls (Stokes, Reference Stokes2014).
The key finding from speech-gating was that, as a group, children with SLI needed to hear significantly larger portions of high-neighborhood-density words than language-typical controls to both initially identify them, and identify them without subsequent change of mind. How might poorer word recognition for high-density words in SLI be explained? We tried to rule out obvious candidates. Recall that children with SLI were similar to language-typical controls in how much their word recognition was facilitated by word frequency and neighborhood density. Also, while they differed for high-density words, they did not differ for high-frequency, low-frequency, and low-density words. So, a general account such as smaller vocabulary size or language exposure probably cannot explain the difference between SLI and language-typical controls in their recognition of high-density words (Metsala & Walley, Reference Metsala, Walley, Metsala and Ehri1998). The ability to predict the target words using coarticulation cues or tonal information likewise cannot explain the group difference only for high-density words. That is, if children with SLI were unable to take advantage of any coarticulation cues or tonal information evident across gates, we might expect such difficulty to exist for all word types, rather than just the high-density words.
McMurray et al. (Reference McMurray, Samelson, Lee and Tomblin2010) suggested that higher levels of lexical decay in SLI might prevent full activation of the phonological representation, leaving it vulnerable to active competitors. In this study, both SLI and language-typical children needed significantly fewer gates to commit to a word after first identifying it if the word came from a high- rather than low-density neighborhood. At the same time, children with SLI needed to hear larger fragments of high-density words to both initially recognize and subsequently accept them without change of mind, when compared to language-typical children. However, no group differences were found in the length of time between first recognizing a word, and then committing to that word, for any word type. This pattern of result suggests that the group difference observed here in spoken word recognition for high-density words cannot be due to greater vacillation between lexical entries – as might be expected if initial lexical activation were more vulnerable to active competitors in SLI.
Collectively, these results, whether pooled across all participants or taken from within each group, are consistent with the lexical restructuring hypothesis, which predicts greater differentiation for high- over low-frequency words, as well as for high- over low-neighborhood-density words. We found that high-frequency words were recognized and accepted after fewer gates than low-frequency words, and the same was found for high-density words in contrast to low-density words. When categorized by both word frequency and neighborhood density, high-frequency–high-density words required the fewest gates for recognition, while low-frequency–low-density words required the most. Our results also indicated that high-density words were accepted after their initial recognition much more quickly than low-density words, suggesting that an efficient storage and retrieval system emerges from lexical restructuring where there is keen phonological competition among items.
In light of this framework, then, the present results point to three main conclusions about the underlying lexical organization in SLI: (i) phonological representations do indeed undergo development (conceptualized as lexical restructuring for better word differentiation) in SLI, as they do in language-typical children; (ii) development of phonological representations occurs according to the same word-related pressures in children with SLI as in typically developing children; but (iii) the process is more protracted for high-density words in children with SLI, as suggested by Wong et al. (Reference Wong, Kidd, Ho and Au2010a). So, children with SLI perhaps lag behind their peers in developmentally restructuring their phonological representations – more specifically, in responding to the developmental pressure due to extensive overlap among phonologically similar words to refine their lexical representations.
This account ties in well with previous findings of word-finding difficulties such as poorer nonword repetition and subpar naming in SLI. The processes that enable a child to expediently access and make use of phonological representations, then, may well depend on the types of words – or more precisely, on how well established the representations are. This account also fits well with previous investigations of the quality of phonological representations in SLI via tasks other than speech-gating. Notably, Claessen and Leitão (Reference Claessen and Leitão2012) and Claessen et al. (Reference Claessen, Leitão, Kane and Williams2013) used a receptive task, asking children to either accept or reject, as a correct production, a range of correctly or incorrectly pronounced polysyllable words. Their studies revealed that children with SLI performed less well than both age- and language-matched controls – being less likely to reject an incorrectly produced word – indicating less well-specified underlying phonological representations. The present results converge with these findings to suggest that the representation of phonological information is subpar in SLI.
The restructuring hypothesis for phonological representations was first formulated using data from languages with alphabetic orthographies, where morphemes are mapped onto phonemes or phoneme strings. Our findings from a Cantonese-Chinese-speaking sample also lend support to this major hypothesis, in a language (i.e. Chinese) where morphemes are consistently mapped on to syllables. These findings suggest that the development of phonological representations responds to the same developmental pressures across very different languages. Longitudinal follow-ups are needed to better understand whether and how restructuring of phonological representations changes as a function of age in SLI. These studies need to focus on whether the lag constitutes a developmental delay that will remain or perhaps ameliorate with age and further exposure to oral language and reading, or whether children with SLI eventually outgrow this developmental lag/deficit.
Auditory perception
As a group, children with SLI were less able to detect FM than their language-typical counterparts. The thresholds of most children with SLI were above the control group mean, and a good number of them were even above the control group maximum. Furthermore, the relations between logFM thresholds and phonological processing and oral language were negative and significant. These findings potentially point to some kind of auditory impairment in at least some children with SLI. However, while FD correlated somewhat with measures of oral language and phonological processing in our study, overall poorer FD did not seem to characterize SLI, in contrast to Mengler et al.'s (Reference Mengler, Hogben, Mitchie and Bishop2005) findings.
Intriguingly, a group difference was found here for FM but not FD, even though FM correlated with FD. Prior research recommended focusing on the developmental trajectory of individual psychophysical task performance (McArthur & Bishop, Reference McArthur and Bishop2001). Thresholds and performance variability on tasks such as these seem to improve with age (Wightman, Allen, Dolan, Kistler & Jamieson, Reference Wightman, Allen, Dolan, Kistler and Jamieson1989). Critically, the developmental trajectory can be more or less protracted depending on the task. For kindergarteners, for example, a difference in FM between children with and without SLI can be detected perhaps because FM development is advanced enough for the two groups of children to diverge, whereas differences in FD attributable to SLI might remain obscured because of immaturity in this aspect of development. Consistent with this, the AXB paradigm is purportedly a cognitively complex task (Wong et al., Reference Wong, Kidd, Ho and Au2010a) even though it has proved to be more appropriate for use in children than a two-alternative forced choice paradigm (Sutcliffe & Bishop, Reference Sutcliffe and Bishop2005), despite the latter's advantage of reducing short-term memory demands and removing linguistic labeling of stimuli (Mengler et al., Reference Mengler, Hogben, Mitchie and Bishop2005). It might simply be that FM is easier for young children to understand because modulation in frequency may be more salient than mere differences in frequency. This may well turn out to help make sense of the correlations between FD, phonological processing, and oral language, in the absence of any group differences for FD between the SLI and language-typical groups.
Alternatively, the findings on FM and FD might be specific to tonal languages. Cantonese Chinese, like all Chinese dialects, is a tonal language and detection of frequency modulations is crucial for distinguishing different lexical tones (e.g. level, rising, falling) that span individual syllables. Deficits in FM perception may be especially detrimental to oral language development in tonal languages. Future work should examine whether, and how, deficits in lower-level auditory perception affect lexical and higher-level language processing in tonal languages.
Relations between tasks
Despite poorer sensitivity to FM in SLI, and overall poorer speech-gating performance for words in high-density neighborhoods, these two deficits did not seem to be directly connected. Auditory thresholds did not correlate with any measure of the speech-gating task, and path analyses indicated that word recognition, as indexed by this task, does not mediate between auditory perception and phonological processing skills. Sensitivity to FM and FD seems therefore to have little impact on spoken word recognition. These results are therefore contrary to the long-standing suggestion that auditory perceptual difficulties, of the type implicated by poorer than average FM and FD, disrupt the development of phonological representations (Benasich & Tallal, Reference Benasich and Tallal2002).
It is entirely possible that previous discussions (e.g. Benasich & Tallal, Reference Benasich and Tallal2002) have incorrectly construed the relations among auditory processing, quality of phonological representations, and further cognitive skills (e.g. phonological processing). Individual differences in the quality of phonological representations might turn out to be most influenced by cognitive factors such as working memory, rather than sensory processing. That is, auditory perception might have no direct impact on the ongoing development of phonological representations beyond some basic level of auditory processing. Other cognitive factors might cause some children with SLI to perform poorly on auditory tasks, without that performance being directly linked to a phonological representations problem (Halliday & Bishop, Reference Halliday and Bishop2006; McArthur & Bishop, Reference McArthur and Bishop2001; Rosen, Reference Rosen2003). Such an interpretation would argue against specific lower-level auditory perception deficits as an account of SLI.
Using eye-fixations during a categorical perception-cum-spoken word picture matching task, McMurray, Munson, and Tomblin (Reference McMurray, Munson and Tomblin2014) found that adolescents with a range of language abilities, including those diagnosed with SLI, showed a similar gradient effect of voice onset time and mapped this perceptual cue onto phonological categories in a similar fashion. The adolescents with SLI, however, looked at the competing word longer, suggesting trouble in suppressing activation of lexical representations. In our study, by analogy, children's performance in the speech-gating task could have been undermined by words competing for recognition rather than by subpar quality of phonological representations. While children with SLI may have an auditory perception deficit, such a deficit may not affect lexical and higher-level language processing.
On the other hand, auditory perception might indeed be related to phonological processing via phonological representations, but the tasks used in the present study did not adequately capture these relations. Different tasks likely reflect different aspects of phonological representations – how easily new representations are formed, how accessible they are, and how precise they are as reflected through articulation or speech perception (Anthony, Williams, Aghara, Dunkelberger, Novak & Mukherjee, Reference Anthony, Williams, Aghara, Dunkelberger, Novak and Mukherjee2010). Probably no single task encompasses all of these; speech-gating mainly reflects accessibility and precision. Could it be that speech-gating reflects simple guessing from a cohort of words generated based on input at each gate, rather than differentiation of the phonological representations per se? Our items analysis of word type, albeit exploratory, seems to argue against this possibility. Better spoken-word recognition (i.e. recognition based on the fewest gates) occurred for high-frequency high-density words – words for which the greatest cohort of lexical entries would be generated, making guessing the correct word much harder. Conversely, the poorest recognition was for low-frequency low-density words – words with only a small cohort of possible items that could be generated in the children's lexicons. If the speech-gating task simply reflects the ability to guess about a limited range of options, rather than how well the representation has been honed by neighborhood density, we would expect spoken word recognition to take the most time for words in a high-density neighborhood because of the many phonological similar options. Yet, our results were exactly the opposite, suggesting instead that the speech-gating task indeed taps organization at the level of the phonological representations itself. In future studies, speech-gating should be augmented with further measures of phonological representations. Furthermore, this study examined only auditory tasks with a frequency component; a more comprehensive test battery including tasks that relate to phonological processing abilities might be more informative.
We note a limitation of our speech-gating task: tonal information may facilitate recognition of word fragments by slowing access to competitors with similar segmental information (Sereno & Lee, Reference Sereno and Lee2015). Given findings from different experimental tasks that Cantonese lexical tones vary in their ease of identification (Ching, Reference Ching1984; Ciocca & Lui, Reference Ciocca and Lui2003; Wong et al., Reference Wong, Ciocca and Yung2009), a potential concern here is that certain lexical tones have a greater facilitatory effect than others – a concern that is not fully accounted for in our neighborhood density measures. We suggest that control for closeness of lexical tone be considered for future use of this task in tonal languages, particularly where the facilitating influences on recognition of word fragments are considered.
SUMMARY AND CONCLUSIONS
This study investigated the relations between frequency modulation detection and frequency discrimination (i.e. auditory perception), speech-gating (i.e. spoken word recognition), and phonological processing, in kindergarteners with and without SLI. Even in a strongly syllabic language such as Cantonese Chinese (where morphemes consistently map onto syllables) the phonological representations of children with SLI appear to develop according to the same developmental pressures of word frequency and neighborhood density as in alphabetic languages – where morphemes map onto phonemes as well as phoneme strings – and as in language-typical children. However, children with SLI appear to lag behind their language-typical peers in how fast they can correctly recognize high-neighborhood-density words. The lexical restructuring model posits that expedient and accurate word recognition for high-neighborhood-density words is achieved by rendering the phonological representations more distinct from their acoustically similar neighbors. Delay in recognizing high-neighborhood-density spoken words, then, could reflect a lag in lexical restructuring of phonological representations.
Further, the auditory perceptual thresholds of children with SLI seem to be significantly worse than those of language-typical children for frequency modulation detection. However, while FM thresholds, speech-gating performance, and phonological processing were evident in SLI, no mediating relation was found.
Appendix
Stimuli used in the speech-gating task. (note: T = Tone; O = Onset; N = Nucleus; F = Final; Gates = number of gates required to present the whole word; Initial gate = proportion of the target word covered in the initial gate of 250 ms.)
High-frequency words

Low-frequency words