Implications
In response to the increased consumption of cuts and further-processed products, poultry meat production has to combine efficiency and product quality. Although nutrition can be an interesting tool to modify breast meat quality traits, the present study confirmed that direct selection on meat pHu is far more effective in modifying these traits. Moreover, we demonstrated that variation in dietary intake of amino acids (AA) did not affect the response to selection on breast meat pHu in terms of animal’s growth, feed efficiency, body composition and meat quality, suggesting that the line and the diet exerted their effects via independent physiological pathways.
Introduction
In the face of the increased global demand for broiler meat and the fluctuating global market of raw materials, the poultry meat industry has focused its efforts on producing more efficient birds. This has mainly been achieved by intensive selection for improved levels of performance (i.e. growth rate, breast meat yield (BMY) and feed conversion ratio (FCR)) of broilers and by adapting their diets according to their improved genetic potential. Genetic selection for these traits has been shown to be very effective, as demonstrated by Schmidt et al. (Reference Schmidt, Persia, Feierstein, Kingham and Saylor2009) who showed that a modern broiler line grew 1.8 times faster, had 72% greater BW and two-fold higher BMY at 5 weeks than a heritage line. In the same time, such selection has induced changes in breast muscle characteristics such as increased fiber size (Guernec et al., Reference Guernec, Berri, Chevalier, Wacrenier-Cere, Le Bihan-Duval and Duclos2003; Felicio et al., Reference Felicio, Gaya, Ferraz, Moncau, Mattos, Santos, Michelan Filho, Balieiro and Eler2013; Koomkrong et al., Reference Koomkrong, Threerawatanasirikul, Boonkaewwan, Jaturasitha and Kayan2015), and reduced glycolytic potential resulting in a higher ultimate pH (pHu) (Berri et al., Reference Berri, Wacrenier, Millet and Le Bihan-Duval2001 and Reference Berri, Le Bihan-Duval, Debut, Santé-Lhoutellier, Baéza, Gigaud, Jégo and Duclos2007; Le Bihan-Duval et al., Reference Le Bihan-Duval, Debut, Berri, Sellier, Santé-Lhoutellier, Jégo and Beaumont2008). Concomitantly, the role of nutrition in enabling broilers to reach their genetic potential has been widely studied, with a particular focus on AA, particularly Lys. Several studies found that increasing the level of Lys in the diet resulted in a significant increase in BW and BMY, and a significant decrease in the FCR and abdominal fat percentage (AFP) (Dozier et al., Reference Dozier, Corzo, Kidd and Schilling2010; Mendes et al., Reference Mendes, Api, Silva, Silva, Sausen, Menezes, Morello and Carvalho2014). More recently, variations in dietary protein or AA such as Lys during the finishing period were also found to alter breast meat pHu and associated quality traits related to their effects on breast muscle growth and carbohydrate (glycogen) content (Berri et al., Reference Berri, Besnard and Relandeau2008; Jlali et al., Reference Jlali, Gigaud, Métayer-Coustard, Sellier, Tesseraud, Le Bihan-Duval and Berri2012; Guardia et al., Reference Guardia, Lessire, Corniaux, Métayer-Coustard, Mercerand, Tesseraud, Bouvarel and Berri2014). However, the impact of protein intake on pHu and related quality traits seems to be variable and may depend on many factors related to the characteristics of diet or animal (Yalçin et al., Reference Yalçin, Özkul, Özkan, Gous, Yaşa and Babacanoğlu2010; Lilly et al., Reference Lilly, Schilling, Silva, Martin and Corzo2011; Jlali et al., Reference Jlali, Gigaud, Métayer-Coustard, Sellier, Tesseraud, Le Bihan-Duval and Berri2012; Zhao et al., Reference Zhao, Zhao, Jiang, Zheng, Chen, Liu and Wen2012). In the present study, we measured the rearing performances and breast meat quality traits of two divergent lines selected for high (pHu+) or low (pHu−) pHu of breast Pectoralis major (P. major) muscle fed with two grower isoenergetic diets differing in Lys and other essential AA content. Our aim was to evaluate the respective impact of line and diet, but also the potential interaction between these two factors considering that dietary variations in AA intake could have different effects on the growth and metabolism of broilers from the pHu+ and pHu− lines which show differences in muscle glycogen content and muscle growth capacity (Alnahhas et al., Reference Alnahhas, Berri, Boulay, Baeza, Jego, Baumard, Chabault and Le Bihan-Duval2014).
Material and methods
All animal care and experimental procedures were approved by the Ethics Committee for Animal Experimentation of Val de Loire (registered under No. 19 by the National Committee).
Animals, experimental design and diets
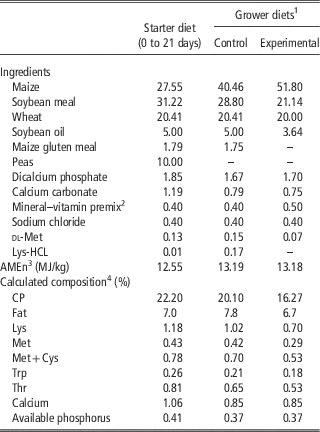
In this study, 480 one-day old chicks from the pHu+ and pHu− lines divergently selected for high and low pHu of the P. major muscle were used (Alnahhas et al., Reference Alnahhas, Berri, Boulay, Baeza, Jego, Baumard, Chabault and Le Bihan-Duval2014). The chicks originated from 28 and 27 sires, and from 66 and 65 dams for the pHu+ and pHu− lines, respectively. The present study was conducted on the fifth generation of selection. After hatching, chicks were individually identified by wing tags, weighed, vent sexed, vaccinated against infectious bronchitis and randomly allocated to one of four treatments, in which the two genetic lines (pHu+, pHu−) were fed with two isoenergetic (13.18 MJ/kg) grower diets differing in both true digestible Lys and other essential AA content. Lys level in the control diet was 10.2 g/kg and the ratio of other essential AA calculated in relation to Lys was determined according to the ideal protein profile defined by Mack et al. (Reference Mack, Bercovici, Groote, Leclercq, Lippens, Pack, Schutte and Cauwenberghe1999). In the experimental diet, Lys was reduced by 31% (7.0 g/kg) and the amounts of other essential AA by 14% to 24% depending on the AA, leading to a higher ratio of other essential AA calculated in relation to Lys compared with the control diet (10% to 20% depending on the AA) and to a dietary protein content reduced by 4%. Chicks were randomly distributed into 24 floor pens (10 males and 10 females per replicate, six replicates per treatment). The pens were located in a standard poultry house in the INRA experimental unit (PEAT, F-37380, Nouzilly, France) with thermostatically controlled air inlets and a dynamic cross-ventilation system. Each pen (1.5×1.7 m) was equipped with a hanging feeder, a line of nipple drinkers and 5 kg of fresh wood shavings as litter. In addition, all pens were separated by opaque separators in order to avoid the influence of birds’ behavior in a single pen on the behavior of birds in neighboring pens. Similarly, different treatments were assigned to neighboring pens for the same purpose. Water and feed were provided ad libitum throughout the study and for up to 6 h before slaughter. Birds from all four treatments were fed a common broiler starter feed during the first 3 weeks, and a common grower feed was used over the following week. The experimental diet was distributed from day 28 to 12 pens (six per line), whereas the other 12 pens continued to receive the same grower feed until slaughter. The composition and characteristics of all diets are presented in Table 1. Industry relevant rearing practices were followed in terms of lighting program and ambient temperature.
Composition (%) and characteristics of diets fed to chickens from day 1 to day 43

1 Control diet was distributed to all broilers from day 21 to day 28, then broilers from six pens per line continued to receive the control diet, whereas broilers from the six other pens per line were fed the experimental diet.
2 Supplied per kilogram of diet: Co, 0.6 mg; Cu, 20 mg; Fe, 58 mg; I, 2 mg; Mn, 80 mg; Se, 0.2 mg; Zn, 90 mg; retinyl acetate, 15 000 IU; cholecalciferol, 4300 IU; dl-alpha tocopheryl acetate, 100 mg; thiamine mononitrate, 5 mg; riboflavin, 8 mg; calcium pantothenate, 25 mg; cyanocobalamin, 0.02 mg; menadione, 5 mg; pyridoxine hydrochloride, 7 mg; folic acid, 3 mg; biotin, 0.3 mg; niacin, 100 mg; choline chloride, 550 mg; antioxidant (buthylhydroxyanisole, propyl gallat, ethoxyquin), 50 mg.
3 Calculated value of apparent metabolisable energy.
4 Amino acids given as true digestible values calculated according to Sauvant et al. (Reference Sauvant, Perez and Tran2004).
Evaluation of live performance levels
All birds were individually weighed at 3, 4 and 6 weeks of age. At the same time, feed consumption was evaluated per pen and then the FCR was calculated on a pen basis.
Evaluation of activity and walking ability
The scan sampling method (Martin and Bateson, Reference Martin and Bateson1986) was used to evaluate activity. The number of birds drinking, eating, standing, walking and lying down was registered in each pen by an observer located between two pens at a distance of 1 m from the door of the pens. The scanning process was repeated twice in the morning and twice in the afternoon by two observers working at the same time. Each observer scanned half of the pens, and the pens observed were alternated between observers at each scanning cycle. Observations took place at days 16, 17, 20, 23, 24, 27, 37, 38 and 41. As the number of walking birds was low, the sum of the number of birds walking and standing was used to assess physical activity (birds standing but not engaged in feeding or drinking activity). The sum of the number of birds eating and drinking was used as the indicator of feeding activity. Walking ability was evaluated at day 30 and day 41 using the gait scoring system developed by Kestin et al. (Reference Kestin, Knowles, Tinch and Gregory1992). Briefly, four birds in each pen were randomly selected by two observers by mutual agreement. As the randomly selected birds walked through their living space, a mutual score was allocated to each one by the two observers. In cases where birds refused to walk, they were encouraged to do so by gently waving a small stick behind them. The Kestin scale consists of 6 scores (Webster et al., Reference Webster, Faichild, Cummings and Stayer2008): 0 (normal walk, no detectable abnormality), 1 (detectable but unidentifiable abnormality), 2 (identifiable abnormality that has little effect on overall function), 3 (identifiable abnormality that impairs function), 4 (severe impairment of function but still capable of walking) and 5 (complete lameness).
Slaughter procedure and measurement of carcass and meat quality
At day 43, and after 6 h of feed withdrawal, six males and six females from each pen (12 birds×24 pens=288 birds in total) were randomly chosen, weighed, identified by new wing tags and then transported for less than 5 min to the PEAT experimental slaughter house. After hanging the birds on the processing chain, they were automatically stunned in a water bath using a constant electric current (5 s, 80 mA/bird, 125 Hz – Generator Elenar, DLC, Naintré, France). Slaughter was performed manually by cutting the carotid artery and the jugular vein at the ventral surface of the neck from inside the oral cavity and a standard broiler processing procedure was then followed. After 24 h of storage at 2°C, all carcasses were dissected to weigh the abdominal fat, right P. major and P. minor muscles, and leg, and to calculate their respective yields in relation to live weight at slaughter. The pHu of the right P. major and Sartorius muscles were then measured using a portable pH meter (Model 506, Crison Instruments SA, Alella, Barcelona, Spain) by direct insertion of a glass electrode into the thickest part of the muscle. A Miniscan Spectrocolorimeter (Hunterlab, Reston, VA, USA) was used to measure the color parameters (L*=lightness, a*=redness and b*=yellowness) of the P. major muscle according to the CIELAB trichromatic system (CIE, Commission Internationale de l'Eclairage, Vienna, Austria). Finally, the P. major muscle was put into zip-lock plastic bags, hung from a hook and left at 2°C for 72 h before estimating the water holding capacity by measuring drip loss (DL), as described in Alnahhas et al. (Reference Alnahhas, Berri, Boulay, Baeza, Jego, Baumard, Chabault and Le Bihan-Duval2014). After measurement of DL, half of the P. major muscles were vacuum-packed and stored at 2°C. Samples were then dressed at 140 g then cooked in a water bath at 85°C for 13 min (internal temperature 65°C to 70°C), cooled in crushed ice for 10 min, wiped dry using absorbent paper and weighed (Petracci and Baeza, Reference Petracci and Baeza2011). The cooking loss was then expressed as a percentage of the fresh muscle weight. Meat texture was analyzed through evaluation of Warner–Bratzler shear force (WB-SF) in cooked meat using an Instron universal testing instrument (Instron SA, Guyancourt, France). The curing-cooking yield (CCY) was determined as described by Alnahhas et al. (Reference Alnahhas, Berri, Boulay, Baeza, Jego, Baumard, Chabault and Le Bihan-Duval2014) on 20 birds/treatment and expressed as the percentage of cured muscle.
Statistical analysis of results
Performance levels and meat quality data were analyzed using the GLM procedure (PROC GLM) of SAS 9.4 (SAS Institute, Cary, NC, USA). The following model of ANOVA was fitted to the data:
 $$y_{{ijkl}} \,{\equals}\,\mu {\plus}S_{i} {\plus}L_{j} {\plus}D_{k} {\plus}LD_{{jk}} {\plus}SL_{{ij}} {\plus}SD_{{ik}} {\plus}e_{{ijkl}} $$
where y ijkl is the trait under analysis for the lth bird, µ the general mean, S i the fixed effect of gender (i=male, female), L j the fixed effect of genetic line (j=pHu+, pHu−), D k the fixed effect of diet (k=control, experimental), LD jk the interaction between the jth line and the kth diet, SL ij the interaction between the ith gender and the jth line, SD ik the interaction between the ith gender and the kth diet, and e ijkl the random error term. For FCR, mean values per pen were analyzed with a model containing the same effects except for those of sex and corresponding interactions. First, a complete model was fitted to the data. Then, all effects that were found to be non-significant were removed and a reduced model (including only significant effects) was refitted to the data. Differences between levels of main effects and their interactions were tested for significance using Tukey’s test for multiple comparisons, as implemented in the same procedure via the LSMEANS statement. The accepted type I error was set at 5%. Finally, to obtain the partial η 2, which represents the proportion of the total variance explained by each factor, the EFFECT SIZE statement of the GLM procedure was used.
Behavioral data generated by the Scan Sampling method were expressed as percentages (proportion of bird expressing each behavior×100) per pen. The percentages of birds walking and standing were summed together and used to represent birds’ physical activity. Similarly, the percentages of birds eating and drinking were summed together to represent birds’ feeding activity. Box plots were used to illustrate the variability of the physical and feeding activity at each age. Each box plot represents the minimum, the 25th quartile, the median (the 50th quartile), the 75th quartile and the maximum value for the plotted traits at the age of measurement. For both types of activity, data deviated significantly from normality. For this reason, they were analyzed using the Kruskal–Wallis non-parametric statistical test as implemented in the R statistical environment (R Core Team, 2014). Appropriate comparisons were performed at each age to test the effect of line, diet and their interaction. For the Gait Score test, two new scores were created from the five initial scores, a moderate score including scores of 0, 1 and 2, and a severe score including scores of 3, 4 and 5. The frequencies of these two scores were then analyzed using the χ 2-test as implemented in the R statistical environment (R Core Team, 2014). For the line and diet effects, the observed and expected frequencies at the age of measurement were compared in a 2×2 contingency table (line×score and diet×score), whereas, for the interaction, they were compared in a 4×2 contingency table (Interaction×Score) and corresponding P-values were reported. For the interaction, when the results of the χ 2-test were significant, they were followed by a series of 2×2 comparisons in order to detect significant variations.
Results and discussion
Effects of gender on performance levels, carcass and meat quality traits
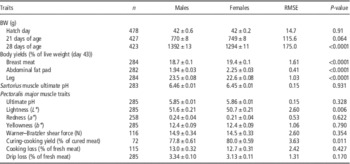
At 43 days, a significant interaction (P=0.007) between gender and diet was found for BW. The diet did not affect (P=0.28) this trait in females, whereas males fed the control diet were significantly heavier (+250 g, P<0.0001) than those fed the experimental diet. Compared with females, males were heavier (P<0.0001) at this age regardless of the diet. Except for this trait, there was no significant interaction between gender and diet or line. For this reason, we decided to present the main effects of gender separately from those of diet and line. Gender mainly affected traits related to animal growth and body composition and, to a considerably lesser extent, those related to meat quality (Table 2). In agreement with the literature (Young et al., Reference Young, Northcutt, Buhr, Lyon and Ware2001; Kidd et al., Reference Kidd, Corzo, Hoehler, Miller and Dozier2005; Baéza et al., Reference Baéza, Chartrin, Meteau, Bordeau, Juin, Le Bihan-Duval, Lessire and Berri2010; Lopez et al., Reference Lopez, Schilling and Corzo2011), males had the highest BW from 28 days (P<0.0001) and females exhibited at slaughter the highest BMY and AFP (+3.7% and +16%, respectively, P<0.0001) but the lowest leg yield (LY) (−3.5%, P<0.0001). In our experimental conditions, there was no effect of gender on breast and thigh pHu. However, despite the lack of difference in pHu between sexes, males were characterized by slightly paler breast fillets (L*, P=0.006) and lower CCY (P=0.01) than females. It has already been shown in chickens that the breast muscle of the female contains larger muscle fibers than that of the male and that the diameter of breast muscle fibers is genetically and phenotypically correlated with several meat quality traits, including color and water holding capacity (Berri et al., Reference Berri, Le Bihan-Duval, Debut, Santé-Lhoutellier, Baéza, Gigaud, Jégo and Duclos2007), which can partly explain the difference observed in the present study.
Effects of gender on BW, carcass composition and meat quality traits expressed as least squares means±SE

RMSE=root mean squared error.
Effects of line and diet on growth, feed efficiency and body composition
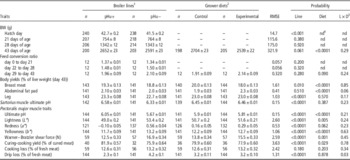
BW and feed efficiency of pHu+ and pHu− lines varied in a similar way in response to diet. The lack of line-by-dietary Lys interaction effect for BW and FCR was already reported by Praharaj et al. (Reference Praharaj, Reddy, Panda, Rao and Sharma2002) when comparing four broiler genotypes differing in growth rate subjected to four dietary levels of Lys (9.6, 10.5, 11.4 and 12.3 g/kg). As indicated in Table 3, feeding birds with the experimental diet resulted in a significant 6% reduction in BW at slaughter (P<0.0001) and a tendency to increase the FCR by around 12% between day 29 and day 43 (P=0.09). Modifying the pHu of breast muscle by selection changed the weight at hatch (pHu+>pHu−, P<0.001), but had no significant impact on growth rate and feed efficiency. In pigs, the study of two divergent lines for residual food intake has shown that the most efficient animals are characterized by lower pHu in Longissimus muscle (a large fast-twitch glycolytic muscle) as well as in several other ham muscles (Faure et al., Reference Faure, Lefaucheur, Bonhomme, Ecolan, Meteau, Metayer Coustard, Kouba, Gilbert and Lebret2012). This antagonistic relationship was not observed in the present study, most likely because of the physiological differences between these two species which are slaughtered at quite different levels of maturity (Renand et al., Reference Renand, Larzul, Le Bihan-Duval and Le Roy2003). As for BW and FCR, no significant line-by-diet interaction was found for body composition traits in the present study. As already reported by Alnahhas et al. (Reference Alnahhas, Berri, Boulay, Baeza, Jego, Baumard, Chabault and Le Bihan-Duval2014), broilers of the pHu+ line exhibited higher BMY (+2.6%, P=0.01) and LY (+2.6%, P<0.0001), but similar AFP compared to broilers of the pHu− line. Even more markedly, the experimental diet induced a reduction in BMY (−10%, P<0.0001) and an increase in AFP (+21%, P<0.0001) compared with the control diet, without changing LY. It has been established that Lys has a major impact on broiler carcass composition and that birds’ Lys requirements for optimal BMY are greater than those based on optimal growth (Dozier et al., Reference Dozier, Corzo, Kidd, Tillman, McMurtry and Branton2008; Bernal et al., Reference Bernal, Tavernari, Rostango and Albino2014). Breast muscle in broilers serves as a protein store which is highly solicited in cases of AA deficiency (Tesseraud et al., Reference Tesseraud, Temim, Le Bihan-Duval and Chagneau1999), which could explain the higher response of the breast muscle to Lys deficiency compared with other skeletal muscles. Moreover, in Lys deficiency, breast P. major and thigh Sartorius muscles have been reported to exhibit reduced protein deposition, resulting in a 55% and 25% decrease in the weight of the two muscles respectively compared with broilers fed a diet containing sufficient levels of Lys (Tesseraud et al., Reference Tesseraud, Le Bihan-Duval, Peresson, Michel and Chagneau2001). The lower sensitivity of the mixed oxidoglycolytic Sartorius muscle to Lys deficiency could be related to its slower growth rate compared with that of the glycolytic P. major muscle (Guernec et al., Reference Guernec, Berri, Chevalier, Wacrenier-Cere, Le Bihan-Duval and Duclos2003). The lower response of the Sartorius muscle to Lys deficiency could help explaining the lack of diet effect on LY in the present study. Our results are also consistent with the negative linear relationship reported between dietary Lys content and AFP (Dozier et al., Reference Dozier, Corzo, Kidd and Schilling2010).
Effects of line, diet and line-by-diet interaction on BW, feed conversion ratio, carcass composition, and meat quality traits expressed as least squares means±SE

RMSE=root mean squared error.
1 pHu+: broiler line selected for high breast meat ultimate pH value; pHu−: broiler line selected for low breast meat ultimate pH value.
2 Control=diet providing 10.2 g/kg of true digestible Lys and adequate amount other essential amino acids calculated in relation to Lys; Experimental=Lys deficient (7.0 g/kg of true digestible Lys) diet with a high amount of other essential amino acids calculated in relation to Lys.
3 L×D=The P-value of the line-by-diet interaction.
4 nd=Not determined.
Effects of line and diet on birds’ activity and walking ability
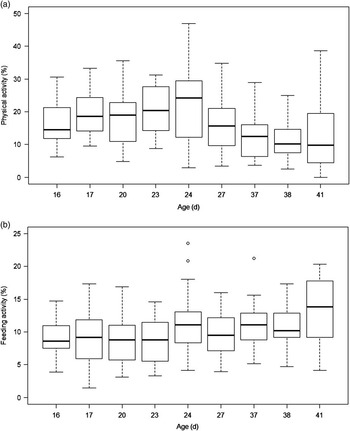
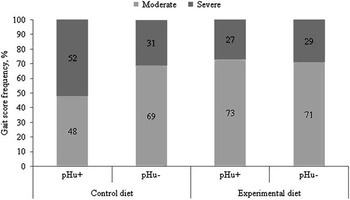
Box plots of physical and feeding activities defined as the percentage of birds walking and standing, and the percentage of birds eating and drinking, respectively, are shown on Figure 1a and b. There was no significant effect of line or diet nor of their interaction on physical and feeding activities whatever the age. A significant effect of line-by-diet interaction was observed (P=0.03) on gait score at 41 days (Figure 2). Moderate scores were significantly less frequent in the pHu+ line and severe scores were more frequent (P<0.05) compared with the pHu− line when fed the control diet. On the other hand, similar frequencies of moderate and severe scores were found in both lines when fed the experimental diet. In the present study, broilers fed the experimental diet were characterized by lower BW and BMY than those fed the control diet, which might have alleviated the mechanical pressure applied to leg joints and helped reducing the occurrence of the severe scores, as shown by Skinner-Noble and Teeter (Reference Skinner-Noble and Teeter2009) and Baéza et al. (Reference Baéza, Arnould, Jlali, Chartrin, Gigaud, Mercerand, Durand, Méteau, Le Bihan-Duval and Berri2012). Furthermore, the glycogen content of P. major muscle, as measured by the glycolytic potential at slaughter, was almost 20% lower in the pHu+ than in the pHu− line (Alnahhas et al., Reference Alnahhas, Berri, Boulay, Baeza, Jego, Baumard, Chabault and Le Bihan-Duval2014). In addition, selecting for higher breast meat pHu also affected the pHu of thigh muscles, suggesting a concomitant reduction in glycogen content in all skeletal muscles of the body. It could therefore be hypothesized that when the diet is optimized for growth and meat yield (as the control diet), lower muscle energy reserve, as in the pHu+ line, might negatively affect muscle function, and consequently the birds’ gait and walking ability. The results of the present study open the door for studies on a much larger number of birds to examine more fully the relationship between muscle energy reserves, walking ability and physical activity in birds.
Box plots of (a) physical activity (% of birds standing and walking) and (b) feeding activity (% of birds eating and drinking) at each age of measurement. Each box plot represents the minimum, the 25th quartile, the median (the 50th quartile), the 75th quartile and the maximum value for the plotted traits.

Effects of line-by-diet interaction on gait score. pHu−=broiler line selected for low ultimate pH of Pectoralis major; pHu+=broiler line selected for high ultimate pH of Pectoralis major; Moderate=gait scored as 0, 1 and 2; Severe=gait scored as 3, 4 and 5 according to Kestin et al. (Reference Kestin, Knowles, Tinch and Gregory1992) scoring scale.

Effects of line and diet on meat quality
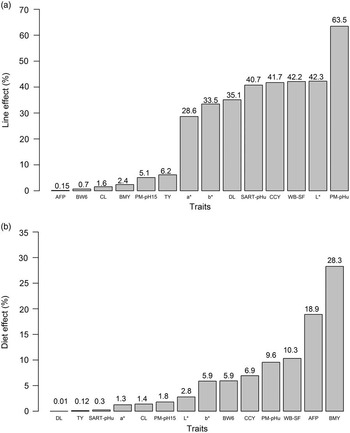
Except for DL, no significant interaction between line and diet was detected for meat quality traits (Table 3). The respective additive effects of line and diet were unequal. In the experimental conditions of the present study, the effects of the line for all meat quality traits were far greater than those of the diet (Figure 3a). This confirms the effectiveness of the selection based on breast meat pHu as a means of modulating breast meat quality traits in broilers (Alnahhas et al., Reference Alnahhas, Berri, Boulay, Baeza, Jego, Baumard, Chabault and Le Bihan-Duval2014). In general, the line effect explained between 5.1% and 63.4% of the phenotypic variation in meat quality traits (Figure 3a), whereas the variation accounted for by the diet ranged from 0.3% to 10.3% (Figure 3b). In contrast to the diet effect, the line was the major source of variation for breast pHu (η 2: 9.5% and 63.4%, respectively). The between-lines difference for this trait was 1.4 phenotypic SD, whereas the between-diets difference was only 0.36 SD. In contrast to the pHu of the P. major muscle, the low dietary AA level did not significantly change the pHu of the thigh Sartorius muscle. In studying the diet effect, Guardia et al. (Reference Guardia, Lessire, Corniaux, Métayer-Coustard, Mercerand, Tesseraud, Bouvarel and Berri2014) recently demonstrated that breast meat with low pHu is increased in the case of Lys deficiency, especially when chickens were subjected to an excess intake of AA in relation to Lys. The hypothesis is that such conditions may limit protein synthesis and increase the proportion of nutrients used for energy storage purposes, including storage of energy as muscle glycogen, resulting in meat with a low pHu. The present study confirmed these previous findings and showed that the dietary AA effect on meat quality was not influenced by the initial glycogen level of the muscle, which differed significantly between the two divergent lines (Alnahhas et al., Reference Alnahhas, Berri, Boulay, Baeza, Jego, Baumard, Chabault and Le Bihan-Duval2014).
Line (a) and diet (b) effects on different traits under study expressed as proportions of the total variance (partial η 2) and ordered in increasing order. AFP=abdominal fat percentage; BW6=body weight at 6 weeks; CL=cooking loss of Pectoralis major muscle; BMY=breast meat yield; a*=redness of Pectoralis major muscle; b*=yellowness of Pectoralis major muscle; DL=drip loss of Pectoralis major muscle; SART-pHu=ultimate pH of Sartorius muscle; CCY=curing-cooking yield; WB-SF=Warner–Bratzler shear force of Pectoralis major muscle; L*=lightness of Pectoralis major muscle; PM-pHu=ultimate pH of Pectoralis major muscle; PM-pH15=pH of Pectoralis major muscle at 15 min post-mortem; TY=leg yield.

In terms of other meat quality traits, it is accepted that lower breast pHu values are associated with higher L*, b* and DL values in raw meat and higher shear force values in cooked meat (Le Bihan-Duval et al., Reference Le Bihan-Duval, Debut, Berri, Sellier, Santé-Lhoutellier, Jégo and Beaumont2008; Swatland, Reference Swatland2008; Zhuang and Savage, Reference Zhuang and Savage2010; Alnahhas et al., Reference Alnahhas, Berri, Boulay, Baeza, Jego, Baumard, Chabault and Le Bihan-Duval2014; Petracci et al., Reference Petracci, Mudalal, Soglia and Cavani2015). In the study presented here, the responses of breast meat quality traits correlated with variations in P. major muscle pHu, whether this was due to the effect of the line or the diet, and followed the expectations indicated above. Accordingly, the pHu+ line was characterized by a darker and less yellow color (i.e. lower L* and b*, P<0.0001), higher CCY (P<0.0001) and lower WB-SF (P<0.0001) than the pHu− line. The breast meat of birds fed the control diet was darker and less yellow (P=0.005 for L* and P<0.0001 for b*) and characterized by higher CCY (P=0.03) and lower WB-SF (N/cm2, P=0.001) than the breast meat of birds fed the experimental diet. AA deficiency slightly modified the impact of line on DL (P<0.03 for the line-by-diet effect). The pHu− line always showed a much higher DL than the pHu+ line but the between-line difference was greater when broilers were fed the low AA diet (+109% v. 66% when broilers were fed the control diet).The line accounted for 35.1% of the total variation for this trait, whereas diet and line-by-diet interaction effects accounted for only 0.01% and 1.76%, respectively (Figure 1a and b).
The fact that the effects of line and diet are additive for most quality traits allows for easier prediction of the combined effects of these two factors. For instance, it can be predicted that rearing pHu+ broilers on a diet sufficiently balanced in Lys and other AA may result in an increase in CCY of almost 8% compared with pHu− broilers fed a AA-deficient diet, which significantly contributes to reducing the processing costs at the industrial level.
Conclusion
This study demonstrated that variation in dietary intake of AA did not affect the response to selection on breast meat pHu in terms of growth, feed efficiency, body composition and meat quality traits. It suggested that the line and the diet exerted their effects via independent physiological pathways. Although nutrition can be an interesting tool to modify breast meat quality traits, the present study confirmed that direct selection on meat pHu is far more effective in modifying these traits. It also highlighted that the additive positive impact of genetics and nutrition on meat pHu increases the incidence and severity of walking disorders in broilers, probably in response to reduced muscle glycogen reserve that may directly affect muscle function and birds’ ability to move.
Acknowledgements
This project was funded by grants from INRA and the Association of Agricultural Technical Coordination (ACTA) of the French Ministry of Agriculture. Nabeel Alnahhas is a PhD student supported by a grant from the Government of Syria. The authors thank Michel Lessire for formulating diets and the staff of the poultry breeding facilities (INRA, UE1295 Pôle d’Expérimentation Avicole de Tours, Nouzilly, France) and the Avian Research Unit (INRA, UR83 Recherches Avicoles, Nouzilly, France) for technical assistance.