


Corner stores, also known as bodegas, are common in low-income, urban areas where access to supermarkets is limited( Reference Moore and Roux 1 – Reference White 3 ). Corner stores primarily offer inexpensive snack foods such as candy, fried snacks, sugar-sweetened beverages and packaged bakery products( Reference Lucan, Karpyn and Sherman 4 ). A study of food availability in corner stores located near low-income schools in four US cities found fresh fruits and vegetables in only 50 % of stores and skimmed or low-fat milk in only 32 % of stores( Reference Laska, Borradaile and Tester 5 ). An inventory of over 230 corner stores found healthier food options were less available and cost more than less healthy items( Reference Cavanaugh, Mallya and Brensinger 6 ).
While several studies have investigated the foods and beverages that are available in urban corner stores( Reference Lucan, Karpyn and Sherman 4 – Reference Cavanaugh, Mallya and Brensinger 6 ), only two studies (one in children and one in adults) have systematically examined both foods and beverages actually purchased in corner stores( Reference Borradaile, Sherman and Vander Veur 7 , Reference Dannefer, Williams and Baronberg 8 ). Borradaile and colleagues( Reference Borradaile, Sherman and Vander Veur 7 ) assessed 833 food and beverage purchases made by 4th–6th grade students in twenty-four corner stores before and after school and found that students spent $US 1·07 for 1490 kJ (356 kcal) per purchase. The most popular items were chips, candy and sugar-sweetened beverages. The Healthy Bodegas Initiative( Reference Dannefer, Williams and Baronberg 8 ) found that among 294 adults, surveyed at ten corner stores, almost 30 % purchased snack items and 57 % purchased beverages. Overall, three studies( Reference Borradaile, Sherman and Vander Veur 7 – Reference Hoffman, Morris and Cook 9 ) have examined individual-level purchases at corner stores but one study examined only student purchases( Reference Borradaile, Sherman and Vander Veur 7 ), one tracked only beverages( Reference Hoffman, Morris and Cook 9 ) and one study( Reference Dannefer, Williams and Baronberg 8 ) did not include information about items’ nutritional characteristics or cost. A previous corner store inventory study( Reference Cavanaugh, Mallya and Brensinger 6 ) found very limited fresh fruit (mean 1·6 (sd 2·2) items) and vegetable (2·6 (sd 2·3) items) availability. Only 5·7 % of stores offered low-fat baked goods and only 35·2 % offered baked versions of chips. While these inventory findings suggest corner stores to offer few healthful food options, to our knowledge no studies to date have examined the nutritional characteristics of consumers’ purchases in corner stores at the individual level. Sampling individual-level purchases v. store-owner sales recall or store inventory allows for a more proximal measurement of consumer behaviour when compared with previous studies evaluating food access or availability. The purpose of the present study was to assess corner store purchases at the individual level (items, nutritional characteristics and amount spent) made by children, adolescents and adults in a large sample of corner stores in low-income urban neighbourhoods.
Experimental methods
Study design
Stores
Potential corner stores were identified using a list of SNAP (Supplemental Nutrition Assistance Program) and WIC (Special Supplemental Nutrition Program for Women, Infants, Children) certified businesses, though street canvassing by study staff and via advertisements. Corner stores were defined as independently owned businesses that primarily sold food, had one to four aisles, and had only one cash register( Reference Borradaile, Sherman and Vander Veur 7 , Reference Gittelsohn, Rowan and Gadhoke 10 ). Corner stores were eligible if they were located in high-poverty zip codes (≥20 % of the population had incomes below 100 % of the Federal Poverty Level)( Reference Cavanaugh, Mallya and Brensinger 6 ) and agreed to participate in the Healthy Corner Store Initiative (HCSI), a healthy food intervention programme designed and implemented by The Food Trust and by Get Healthy Philly, an initiative of the Philadelphia Department of Public Health. Data reported in the present study are from initial store intercept surveys. Out of approximately 1800 corner stores in Philadelphia( Reference Cavanaugh, Mallya and Brensinger 6 ), 221 of the approximately 630 corner stores (35 %) that participated in the HCSI were selected for assessment. Selected stores signed a memorandum to participate. We did not collect data at twenty-nine of those stores because stores closed or owners withdrew (n 21), or there were safety concerns (n 8). Study staff collected store characteristics (square footage, number of aisles) during store enrolment. Corner store owners were introduced to staff, who wore identifiable clothing (shirts and/or jackets).
Due to the difference in the timing of the intervention and evaluation funding, initial data collection occurred at the stores between 1 and 50 weeks after enrolment in HCSI. Approximately 30 % of initial intercepts were collected during months 1–3 and 70 % were collected in months 5 and 6 (median=166 d) of the intervention. The present study, however, is a cross-sectional examination of initial corner store purchases; details and results of the intervention after one year are not yet available. The intervention was implemented in four subsequent phases. Thus, at the time of the initial assessment, the intervention was only partially implemented. However, the date of initial intercept was not highly correlated with any nutritional characteristic in the current study (range r=0·006–0·03) and previous data showed that time since enrolment in HCSI was not associated with types of food available in corner stores( Reference Cavanaugh, Mallya and Brensinger 6 ).
Intercept interviews
Intercept interviewers participated in a standardized, protocol-based training at the research centre. Additionally, interviewers observed a previously trained interviewer in the field before conducting intercepts independently. Trained interviewers obtained verbal consent and asked shoppers for permission to itemize the food and beverages that were purchased. All corner store shoppers were asked to participate during the hours that study interviewers were present unless the store was very busy and the consumers outnumbered the interviewers at a given time. When parents shopped with their children, interviewers asked permission from parents and their children to record children’s purchases. Shoppers were asked to self-report how much their purchases cost and if they were shopping for themselves or others. Shoppers were also asked to identify their age category: (i) adults (≥19 years); (ii) adolescents (13–18 years); or (iii) children (5–12 years). Each intercept consisted of one or two evaluation staff and was approximately 1·5 min in duration. Evaluation staff assessed purchases between 08.00 and 17.00 hours for 15-min intervals if the store was not busy but stayed longer if there was a steady stream of shoppers.
Outcomes
Corner store purchases
Data were collected through intercept interviews and direct observation of purchases immediately outside corner stores in Philadelphia, PA, USA from February to July 2011. The school year in Philadelphia is from September to June and data were collected during school and non-school periods. Interviewers looked in shoppers’ bags to record the item’s name, product category, brand, weight/size, and recorded each food and beverage item purchased. Intercepts were not conducted if there were no food or beverage items (e.g. purchases that included only cigarettes, newspapers, cleaning supplies, etc.).
Nutrition information
Nutrition information was obtained for all items (packaged and prepared) purchased by children, adolescents and adults at the corner stores. In the case of packaged items, nutrition information was obtained by purchasing an identical item in the corner store and looking at the nutrition label. When items were no longer available for purchase or no nutrition label was present, evaluation staff contacted the product manufacturer or distributor directly for nutrition information (via website or telephone). When product information was not available directly from the manufacturer, data were obtained from online databases such as CalorieKing.com( 11 ). For items that were no longer available for purchase, the manufacturer could not be contacted or were not listed in databases such as CalorieKing.com, nutrition data were obtained on comparable items (similar in size, weight and ingredients). These items represented 1·5 % of total items, were typically from local vendors and had a very small distribution.
In the case of prepared items (e.g. deli sandwiches), evaluation staff purchased identical sandwiches as individual components (e.g. bread, deli meat, condiments) with the help of store staff to be sure that the typical amounts and types of items were included. The components were weighed and measured at the evaluation centre and recorded. Similar methods (described above) were used to obtain nutrition information for the prepared item.
The study was conducted according to the guidelines laid down in the Declaration of Helsinki and all procedures involving human subjects were approved by the Temple University’s and the Philadelphia Department of Public Health’s Institutional Review Boards. Verbal consent was obtained and participation was anonymous.
Statistical analyses
Descriptive statistics (i.e. mean and standard deviation) for continuous outcomes and percentages for categorical outcomes characterized quantity, types, costs and nutritional characteristics of the corner store purchases. Items were analysed by percentage of corner store shopper intercepts (n 9238; i.e. one customer visit). Percentages may total to greater than 100 %, as one store visit may include multiple items. Data were also analysed as a percentage of total items (n 20 244). The low store-level intra-class correlation coefficients for energy (0·07) and amount spent (0·04) supported an individual-level analysis. Regression models with dummy-coded variables examined differences in cost and energy consumption by age and sex. Age ranges were not available for thirty-six intercepts and were not included in age-related analyses. Data were analysed using Access and Excel (Microsoft®) and R (R Foundation for Statistical Computing).
Results
Stores
In the HCSI, 87 % of stores participated in SNAP and 40 % of stores participated in WIC. On average, the corner stores were 604 square feet and contained 2·10 aisles. Stores were visited an average of 13·9 (sd 17·3) times (range=1–110 visits) and the average intercepts per store visit were 2·4 (sd 2·1).
Surveys
Evaluation staff completed 9238 shopper intercept surveys (1 intercept=1 store visit/customer) from 6857 adults, 1430 adolescents and 915 children (thirty-six age unknown) in 192 corner stores. Participants were 58·6 % male and 41·4 % female. The 9238 intercept surveys contained 20 244 items. Only 14 % of consumer intercepts included items purchased for another person.
Quantity and cost
Corner stores shoppers spent an average of $US 2·74 (sd $US 3·52) on 2·2 (sd 2·1) items (1·3 (sd 2·0) foods and 0·9 (sd 0·9) beverages) per purchase (Table 1).
Corner store purchase characteristics by shoppers’ age (n 9238)Footnote *: intercept survey conducted at 192 corner stores in Philadelphia, PA, USA, February–July 2011

* Thirty-six surveys did not include age category and were included only in the total analyses.
† Regression analyses indicate that children spent significantly less than adolescents (P<0·01) and that adolescents spent less than adults (P<0·01).
Nutritional characteristics
The average total energy of items purchased was 2786·5 (sd 4454·2) kJ (666·0 (sd 1064·6) kcal) per intercept (Table 1). On average, 70·8 % of energy per intercept was associated with food items, while 29·2 % of energy was associated with beverages. Adults bought foods and beverages with the highest energy (2901·6 (sd 4545·9) kJ (693·5 (sd 1086·5) kcal)), followed by adolescents (2720·4 (sd 4610·8) kJ (650·2 (sd 1102·0) kcal)) and children (1990·3 (sd 2890·7) kJ (475·7 (sd 690·9) kcal); P<0·01). The purchases were very high in sugar (66·2 g) and sodium (921·1 mg) and low in fibre (2·5 g; Table 1).
Product type
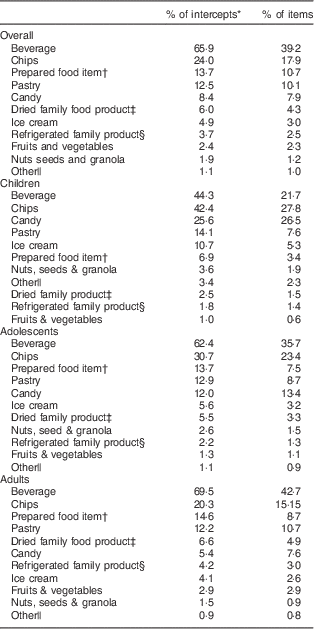
When examined as a percentage of total items (n 20 244), the five most frequently purchased food and beverage items at corner stores were beverages (39·2 %), chips (17·9 %), prepared food items (10·7 %), pastries (10·1 %) and candy (7·9 %; Table 2). Fruits and vegetables comprised only 2·3 % of items purchased. When the food and beverage data were examined by as a percentage of intercepts (n 9238), the five most popular product categories remained the same (Table 2).
Distribution of various product categories as a percentage of intercepts (n 9238) and items (n 20 244) overall and by shoppers’ age: intercept survey conducted at 192 corner stores in Philadelphia, PA, USA, February–July 2011
* Percentage equals number of intercepts with at least one product in each relevant category. Percentages may total to greater than 100 %, as one store visit may include multiple purchased items. Thirty-six surveys did not include age and were not included in age analyses.
† Prepared food item=items prepared at a deli counter or hot food station (sandwiches, bagels).
‡ Dried family food product=non-refrigerated products with >1 serving (macaroni and cheese, cereals).
§ Refrigerated family product=family-size refrigerated products (cheese, yoghurt, eggs, gallon of milk); soda not included.
|| Other=products that did not fit into the above categories (beef jerky, cough drops, single-serving noodles).
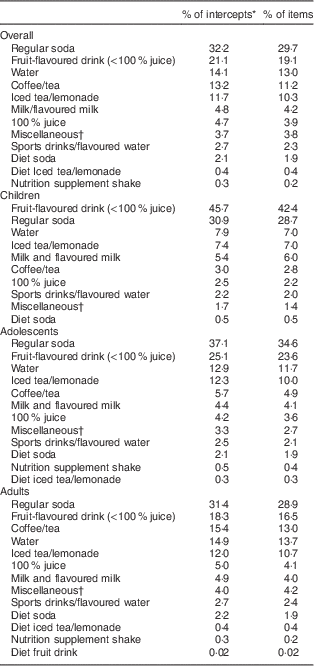
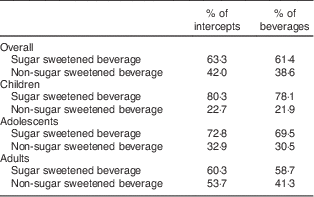
When examined as a percentage of intercepts (n 9238), beverages were purchased during 65·9 % of store visits (Table 2). Among intercepts that included a beverage (n 6084), the five most popular beverages were regular soda (32·2 %), fruit-flavoured drinks (<100 % juice; 21·1 %), water (14·1 %), coffee/tea (13·2 %) and iced tea/lemonade (11·7 %; Table 3). Whether examined by percentage of intercepts or by percentage of items, the five most popular beverages in the overall sample remained the same. Adults and adolescents most frequently bought regular soda, while children most frequently bought fruit-flavoured drinks (Table 3). Sixty-three per cent of intercepts that included a beverage and 61 % of beverage items were sugar-sweetened drinks (e.g. regular soda, fruit-flavoured drinks that were not 100 % juice, and teas, sports and energy drinks with added sugar; Table 4). Only 4·2 % of beverage items were milk-based products (3·2 % were whole or flavoured milk products and 1·0 % were low-fat or skimmed options). The average beverage size was 973·0 (sd 3321·1) ml (32·9 (sd 112·3) oz).
Percent of intercepts (n 6084) and items (n 7939) with various beverage types overall and by age: intercept survey conducted at 192 corner stores in Philadelphia, PA, USA, February–July 2011
* Percentage equals number of intercepts with at least one product in each relevant category. Percentages may total to greater than 100 %, as one store visit may include multiple purchased items. Thirty-six intercepts did not contain an age range and were eliminated from age-related analyses.
† Miscellaneous=slushies, sidral mundet.
Sugar-sweetened beveragesFootnote * by intercepts containing a beverage (n 6084) and total beverages purchased (n 7939) at corner stores overall and by ageFootnote †: intercept survey conducted at 192 corner stores in Philadelphia, PA, USA, February–July 2011
* Sugar-sweetened beverages included regular soda, fruit drinks that are not 100 % juice, and teas, sports and energy drinks with added sugar.
† Thirty-six intercepts did not contain an age range and were eliminated from age-related analyses.
When examining food items only, the five most frequently purchased food categories as a percentage of intercepts were chips (24·0 %), prepared foods (13·7 %), pastries (12·5 %), candy (8·4 %) and dried family products (6·0 %; Table 2). Results were the same when examined as a percentage of items in the overall sample. Chips were the most popular food item across age groups (Table 2).
Age and sex effects
Children ($US 1·61 (sd $US 1·83)) spent significantly less than adolescents ($US 2·38 (sd $US 3·37); b=−0·74, se=0·15, P<0·01), who spent less than adults ($US 2·96 (sd $US 3·67); b=−0·58, se=0·10, P<0·01). Males ($US 2·54 (sd $US 3·17)) spent significantly less than females ($US 3·04 (sd $US 3·94); b=−0·50, se=0·08, P<0·01) and purchased significantly less energy (males=2679·4 (sd 4196·1) kJ (640·7 (sd 1002·9) kcal), females=2939·3 (sd 4803·2) kJ (702·5 (sd 1148·0) kcal); b=−61·75, se=22·54, P<0·01). Children had significantly smaller (541·2 (1685·7) ml (18·3 (sd 57·0) oz)) mean beverage sizes (F(2)=8·8, P<0·001) compared with adolescents (958·2 (sd 3681·9) ml (32·4 (sd 124·5) oz)) and adults (1014·4 (sd 3297·4) ml (34·3 (sd 111·5) oz)).
Discussion
There were four principal findings from this study. First, corner store shoppers purchased an average of two items for 2786·5 kJ (666·0 kcal) at a cost of less than three dollars ($US 2·74) per visit. Assuming a typical daily intake of 8368 kJ (2000 kcal)( 12 ), one corner store trip yielded approximately one-third of total daily intake. Many popular items were snack foods, which is in accordance with recent findings that snacking prevalence has increased significantly over the last three decades in adults( Reference Piernas and Popkin 13 ) and that children are snacking up to three times per day( Reference Piernas and Popkin 14 ). Gittelsohn et al.( Reference Gittelsohn, Franceschini and Rasooly 2 ) reported that among urban adult consumers who frequented corner scores, 33 % visited corner stores three to four times per week, suggesting that, at least for some subgroups, corner store purchases may contribute to the disproportionately high rates of obesity in low-income and predominantly minority communities( Reference Flegal, Carroll and Kit 15 , Reference Wang and Beydoun 16 ).
Second, the majority of items frequently purchased across age groups were of low nutritional value. The five most commonly purchased items were sugar-sweetened beverages, chips, prepared foods, candy and pastries. Only 2·3 % of items were fruits and vegetables, only 1 % of beverages were low-fat or skimmed milk products, and only about 5 % were diet drinks or flavoured water. Overall, items were high in sugar (66 g) and sodium (921 mg) and low in fibre (2·5 g). The amount of sodium represents 40 % of the 2300 mg Na/d limit recommended by the 2010 Dietary Guidelines( 17 ) and the sugar content of purchases more than double the maximum intake of 32 g added sugar/d recommended by the American Heart Association( Reference Johnson, Appel and Brands 18 ) based on a 8368 kJ/d (2000 kcal/d) adult diet. The primary sources of added sugars in the American diet( Reference Johnson, Appel and Brands 18 ) are regular soda, candy, pastry items (cookies, pies and cakes) and fruit-flavoured drinks, which were items frequently purchased at corner stores in our study. While consumption of added sugar among adolescents and children nationally appears to be declining( Reference Slining and Popkin 19 ), corner store purchases in these age groups were still high in sugar (61·9 g and 43·1 g, respectively).
Third, there were differences in purchasing patterns by age and sex. Adults spent the most ($US 2·96) for the highest average energy (2901·6 kJ (693·5 kcal)). Men spent less than women, for less energy. Children spent on average $US 1·61 for 1990·3 kJ (475·7 kcal) at corner stores per visit, which is about 500 kJ (120 kcal) more than previously reported by Borradaile et al. in 2008 ($US 1·07 for 1492 kJ (356·6 kcal))( Reference Borradaile, Sherman and Vander Veur 7 ) for a similar number of items (2·1 v. 2·5). The current findings may differ from those because of price increases over three years, our wider child age range (5–12 years v. 4th–6th graders), or the larger number of corner stores in the current study (192 v. 24). Alternatively, increases in portion sizes or in the energy content of product offerings may account for these differences.
Fourth, beverages were the most frequently purchased item in corner stores (66 % of intercepts included a beverage, 39 % of items were beverages). These findings are consistent with a smaller study of adults (n 218) that found 57 % of corner store purchases included a beverage( Reference Dannefer, Williams and Baronberg 8 ). The beverage items most frequently purchased in our study were regular soda (30 %) and fruit-flavoured drinks (19 %). Almost two-thirds (61·4 %) of beverages purchased were sugar-sweetened drinks, with an even higher percentage among children (78·1 %). These results are troubling given the association of sugar-sweetened beverages with dental caries( Reference Tahmassebi, Duggal and Malik-Kotru 20 ) and some evidence that energy from liquids generates poorer energy compensation responses than that from solid foods( Reference Mattes and Campbell 21 ).
There are several public health implications of our findings. First, given that corner store shoppers most frequently purchased beverages, community-level interventions could target consumption of sugar-sweetened sodas through promotions of low- or no-calorie alternatives such as bottled water, flavoured no-calorie waters and diet soda at corner stores. Although a previous corner store intervention study examining beverage purchases by middle-school students resulted in little change in sugar-sweetened beverage purchases( Reference Hoffman, Morris and Cook 9 ), our data suggest sugar-sweetened beverages to be an important target for future corner store interventions. Second, the low frequency of fruit and vegetable purchases in our study (2 %) likely contributes to previous findings that neighbourhoods served primarily by corner stores are 25 % less likely to consume the recommended daily intake of vegetables than neighbourhoods with few corner stores( Reference Pearce, Hiscock and Blakely 22 ). The low rates of fruit and vegetable purchases in our study are also likely a reflection of limited inventory of these items( Reference Cavanaugh, Mallya and Brensinger 6 ). Greater fruit and vegetable subsidies may help make sales of these items in corner stores more profitable and encourage corner store owners to carry fresh produce. Third, our findings suggest that corner store purchases provide significant energy, which may contribute to the higher rates of obesity. At the environmental level, our findings provide further evidence that corner stores may be appropriate targets for future interventions. Ultimately, carefully controlled studies are needed to evaluate the efficacy of such interventions. Programmes at the federal, state and local levels to incentivize corner stores or subsidize necessary resources (e.g. refrigerators, storage) to stock healthier items may help address the disproportionate number of people living with obesity in low-income urban areas( Reference Moore and Roux 1 , Reference Lucan, Karpyn and Sherman 4 , Reference Bodor, Rice and Farley 23 ). More incentives to purchase healthier foods through WIC and SNAP may also drive consumer demand for healthier foods options in corner stores( Reference Gittelsohn, Rowan and Gadhoke 10 ).
Our study has multiple strengths. The large number of consumer intercepts (>9000) and stores (almost 200) represents the largest sample evaluated to date. Moreover, evaluations were based on direct observation and not on self-report. Ours was also the first study to evaluate corner store food and beverage purchases made by adolescents. Previous studies examined purchases by children only( Reference Borradaile, Sherman and Vander Veur 7 ), sampled a small number of stores or adult consumers( Reference Gittelsohn, Franceschini and Rasooly 2 , Reference Dannefer, Williams and Baronberg 8 ), or assessed what was available in corner stores( Reference Lucan, Karpyn and Sherman 4 , Reference Cavanaugh, Mallya and Brensinger 6 ) but not what was actually purchased.
Our study also has weaknesses. It is possible that shoppers changed their purchasing behaviours knowing that their items would be recorded by evaluation staff or as a result of the intervention that began before some initial intercept assessment collection began. However, this effect would inflate the number of healthy purchases made at corner stores and make our findings a high estimate of healthy purchasing behaviours, which is already extremely low. We did not track the frequency of corner store visits by consumer, so it is possible that the same consumer was intercepted more than once. Our study was also limited by the cross-sectional design, the collection of intercepts during daytime only and the collection of some intercepts during summer months when most children are not in school. Future studies could utilize automated sales information such as electronic cash register records, although corner stores do not typically utilize this type of technology. We did not record whether consumers shopped in corner stores alone or with others. Detecting differences in corner store purchasing patterns between individual consumers v. consumers shopping as dyads or in groups may also help to identify future intervention targets. Given that data were collected in one city, generalizability to other urban areas and rural or suburban areas is unknown.
The present cross-sectional evaluation of corner store purchases lays the groundwork for future interventions aimed at changing corner store purchasing behaviour. In 2012, Gittelsohn and colleagues( Reference Gittelsohn, Rowan and Gadhoke 10 ) reviewed corner store intervention studies to date and found that the majority of studies focus on inventory changes and not actual sales or consumer purchase data. Intervention studies aimed at changing consumer behaviour in corner stores that prospectively track individual-level purchases as well as healthy food inventory are needed.
Conclusion
In summary, these data from the largest evaluation of food and beverage corner store purchases to date, as well as the first among adolescents, revealed that low-income, urban shoppers spent almost $US 3·00 for nearly 3000 kJ (666 kcal) of nutrient-sparse items that were predominantly snack foods and sugar-sweetened beverages. Obesity prevention efforts may benefit from including interventions aimed at changing corner store food environments in low-income urban areas.
Acknowledgements
Financial support: This project was funded by Cooperative Agreement (number 3U58DP002626-01S1) from the Centers for Disease Control and Prevention (CDC) and Get Healthy Philly, and by the National Institutes of Health (NIH; grant numbers 1F32DK096756 and DK20541). The CDC and the NIH had no role in the design, analysis or writing of this article. The Philadelphia Department of Public Health (creator of Get Healthy Philly) contributed to the study design and the writing of this article. Conflict of interest: G.D.F. PhD served as a consultant to ConAgra Foods and Tate & Lyle during the time of this study. G.D.F. and S.V.V. are currently full-time employees of Weight Watchers. All other authors report no conflict of interest or financial disclosures. Authorship: M.R.L., T.S. and H.G.L. analysed data and wrote the manuscript. G.D.F., S.V.V., G.M., L.C., B.S., S.S. and J.W.-R. formulated the research question, designed the study and carried out the study. Ethics of human subject participation: The study was approved by the Temple University’s and the Philadelphia Department of Public Health’s Institutional Review Boards. Verbal consent was obtained and participation was anonymous.



