1 Introduction: re-centering the discussion on visual thinking
In the process of describing the world around us, not only language and verbal thought matter. In recent years, an interest has grown around the phenomenon of non-verbal thought, such as the use of visualization and visual thinking in reasoning in general and in scientific argumentation in particular. One motivation to pursue this study is the observation that, as Ferguson has suggested, ‘it has been non-verbal thinking, by and large, that has fixed the outlines and filled in the details of our material surroundings’ (Ferguson, Reference Ferguson1992: xi). In the process of understanding the world around us, it is indeed crucial also to understand the practices that have brought to it; nevertheless, at the beginning of the 20th century, the common tendency was to ignore the role of non-verbal thought in shaping the world, favoring a picture of human reasoning whose paradigm was the simple deduction from axioms. In fact, in the past century, the topic of visualization and visual thinking has suffered a certain neglect, for the very reason that a kind of ‘logocentric’ approach not only to reasoning, but to science in general, was heavily influential in the philosophical debate.
The world around us does not correspond to the formal mathematical world that this conception of science would put forward, and in the same way the human mind can not be assimilated to a machine making calculations. Since its beginnings, philosophy has been devoted to the investigation of the different forms of knowledge that are available to the human mind, and therefore to some extent it is not correct to claim that the interest in the visual forms of knowledge is totally new. Nevertheless, it is only thanks to the reconsideration of the 20th-century linguistic paradigm that an entire domain of research has reappeared in all its complexity.
Not only science, but also mathematics has been misrepresented by this logocentric approach. Without going into detail, the reasons for this distortion are found in the debate in philosophy of mathematics at the beginning of the 20th century about how to secure mathematics from crises such as the one triggered by the discovery of non-Euclidean geometry. The term ‘logocentric’ is found in Sheffer (Reference Sheffer1926) in his review of the second edition of Whitehead and Russell's Principia Mathematica, where he pointed out how throughout the four volumes the authors were concerned with proving the thesis that pure mathematics is an extension of formal logic, and is nothing elseFootnote 1. In the context of philosophy of mathematics, the same term reappears on the scene later on, in the logocentric ‘dogma’ according to which the diagram is only a heuristic to prompt certain trains of inference, but is dispensable as a proof-theoretic device and has no proper place in the proof as such; the proof, indeed, is a syntactic object consisting only of sentences arranged in a finite and inspectable way (as expressed in Tennant, Reference Tennant1984). This claim is not anymore about the foundations of mathematics Russell and Whitehead were concerned with, but has become a ‘dogma’ on the notion of proof.
As Barwise and Etchemendy (Reference Barwise and Etchemendy1996) argue, ‘despite the obvious importance of visual images in human cognitive activities, visual representation remains a second-class citizen in both the theory and practice of mathematics’ (Barwise & Etchemendy, Reference Barwise and Etchemendy1996: 3). If we accept this logocentric approach to mathematics, what would be left of its epistemology? To take into account the real mathematical activity, Barwise and Etchemendy presented their ‘heretical’ project, which ran counter to the received view: in logic and mathematics, visual forms of representation can be important not just as heuristic and pedagogical tools, but as legitimate elements of mathematical proofs. One of their motivations is sharply retraced in Shin (Reference Shin2004), and is based on the observation of students’ performances in their first-order logic course. These performances show that understanding semantic concepts can be of help for carrying out formal proofs in a deductive system. In fact, according to them, reasoning is a heterogeneous activity, and people use multiple representations of information while reasoning: those representations are often in non-sentential forms. Furthermore, bringing together the practical power of multi-modal reasoning with modern logic and its formalization and rigor is expected to have as a positive outcome the return to the unity of teaching and research, of what is taught to the student on the one hand and what is done by the working logician on the other. The more general aim is to expand the territory of logic—or maybe to give logic its lost territory back—freeing it from the use of a single mode of representation.
Let us now leave the domain of mathematics and logic, and yet retain this idea that reasoning is heterogenous since it relies on verbal as well as on non-verbal thought. Attempts such as these to point out how this heterogeneity of reasoning is important in understanding the world around us and in accounting for the practices of science, were nevertheless taken into consideration only by a small part of the philosophical community. Meanwhile, the domain of research on the investigation of the many forms of knowledge available to the human mind became of interest for other disciplines, such as psychology and cognitive science, as well as computer science. The result of this situation was the growth of many points of view, and of a vast number of different approaches to the subject of visual thinking, each of them having its own context of reference and its own objectives. This enormous richness of descriptions and deconstructions paved the way to a renewal of the importance of this topic. Nevertheless, in some cases, it also brought to a misunderstanding and to the birth of a new questionable point of view, which I may label as the new ‘visuocentric’ or ‘opticentric’ dogma, according to which it suffices to look at a diagram to get to its content and to the message it conveys. The main reason alleged for this dogma is that information in a diagram, compared to the content of a sentence, is ‘for free’ or ‘directly’ extracted. According to this new dogma, diagrams directly speak to the eyes. The discussion has lost its balance again: truth must lie somewhere in between the two dogmas.
It is precisely for this reason that it is now not anymore time for pioneers, but a kind of second phase in the investigation of visual thinking has begun. Verbal and non-verbal thought are both crucial in the process of understanding, but while verbal thought has been investigated in depth, the study of non-verbal thought needs to find a new systematization that would promote further discussion. We are not starting from zero: in fact, the richness of data that we now possess calls for a general framework, even if a very tentative one. The objective of this article is to provide such a framework in the form of a classification for the different kinds of diagrams that are commonly used to reason and to make inferences. The classification is delineated neither from a logocentric nor from a visuocentric point of view, but aims at combining the different variables that must be taken into consideration when describing our recourse to diagrams and visual displays. To determine what these variables are, I will first summarize the outcomes of the research up to now. I will argue that there are at least five things that the past years of research on visual thinking as well as on visualization techniques have taught us. In the next section, I will discuss these five achievements. In the remainder of the article, I will provide the tentative diagrammatic classification, and I will discuss more in detail why it is of use.
2 Five starting points and one starting objective
I will introduce here five claims that in my view summarize the major achievements in the theoretical investigation on visual thinking. Moreover, I assume that these achievements are cross-disciplinary, that is, they have come up in the discussion in many different fields where an interest for this topic has been shown.
1. Beyond the visual vs. non-visual dichotomy. First, there are reasons to think that it is not very fruitful to maintain the visual vs. non-visual opposition as the background assumption. In fact, things are more complex, and the focus on this opposition risks oversimplifying the respective features of linguistic items on the one side, and diagrams on the other. There are two sorts of considerations in favor of the idea that it is necessary to go beyond this dichotomy. First, the theoretical ones. The literature has shown that it is very difficult to give criteria for distinguishing sharply between sentential and graphical systems (see, e.g., Shimojima, Reference Shimojima2001). The reason for that is that possibly because of too much focus on their differences, their analogies have been forgotten: in fact, sentential and graphical systems constitute both tools for reasoning and external representations. Therefore, one possible consideration could be that it is necessary to keep in mind that both belong to the same class. Moreover, this dichotomy is often put forward by the scholars who accept what I called the visuocentric or opticentric dogma, and who stress—inadequately—that visual is on many important accounts better—that means quicker, easier, etc.—than non-visual. Nevertheless, neither compelling arguments nor conclusive evidence are given in favor of this. In addition, there is also an empirical worry. The visual vs. non-visual opposition is of no help for the individuation of appropriate experimental designs. Indeed, this opposition makes it difficult to properly account for the very common ‘hybrid’ cases of diagrammatic displays, such as, for example, labeled graphs and diagrams. Moreover, the second term of the opposition, ‘non-visual’, if interpreted as ‘linguistic’, does not represent a good touchstone for empirical research. In fact, subjects are in general continuously exposed to language, but that does not mean that they fully master it; conversely, though they may be not very familiar with most visual displays, they are surely familiar with some of them, such as maps or charts. Therefore, it would be difficult to simply evaluate the comparison between the efficiency of one format compared to the other.
2. Beyond descriptive approaches. The literature, though being very heterogenous, is also very rich. Nevertheless, this richness is due to the fact that the disciplines that have been interested in the subject, such as (philosophy of) mathematics, (philosophy of) science, cognitive science, computer science and so on, have interpreted visual reasoning in relation to their own different aims and purposes. For example, in mathematics or in science the problem has been to assess the role of visual thinking in valid reasoning or in explanations; in cognitive science the focus has been on the mechanisms that are in play when using a visual or spatial representation of some information; in computer science the possibility of implementing some forms of visual or spatial thinking in the computations of a machine has been taken into account. For this reason, in the exploration of the new domain, many descriptions on how subjects reason or make use of visual displays were put forward, but most of the times these reports were difficult to integrate and were not followed by the proposal of a general framework.
3. Case studies vs. general frameworks. An evident difficulty is methodological. To see what visual reasoning is, it is necessary to assume a pragmatic attitude and to evaluate when and where visual thinking is useful and in relationship to which tasks. This encourages a case study approach. At the same time, as a drawback, the case study approach can fail in providing a more general framework that, according to (2) is needed, since it is not clear which aspects can be generalized from particular case studies to all forms of visual thinking.
4. Toward the rehabilitation of (the interaction with) language. As explained in (1), opposing visual and non-visual, that is linguistic, does not help in considering the real cases which are most of the times neither totally graphic nor totally sentential. Therefore, it is now time to turn back to language, in order to rehabilitate not the logocentric approach but the importance of the continuous interaction among different modes of representation. There are very common hybrid cases in which diagrams or graphs contain letters as labels, for example, the letters A, B, C in a geometrical figure. These letters can be indexes, as Charles Sanders Peirce suggested, for the reason that what they affirm is nothing but ‘look over there!’: such an index ‘takes hold of our eyes… and forcibly directs them to a particular object, and there it stops’ (Peirce, Reference Peirce1885: 163). Labeled diagrams can be efficient only if a connection is created between the visual display—that means the objects in the visual display—and the subject who use them for reasoning.
5. Toward the exploration of the new domain. Once the limits of the logocentric approach have been shown, visual thinking becomes of interest for many different disciplines: the risk is to transform visual thinking in a subject which is too multifaceted to be investigated within a unitary framework. In this context, philosophy can serve as a therapy and offer some conceptual analyses to orient the research. The domain of visual thinking which has been (re)discovered is so vast that some directions for the explorer are needed.
Coherently with what I have summarized in (1)–(5), in the remainder of the article I will focus on the exploration of one specific region of this (almost) new domain on research: diagrams and diagrammatic reasoning. My objective will be to provide a diagrammatic classification, or more precisely a set of criteria and constraints to define what such a classification can be. In fact, in the literature the terms ‘diagram’ and ‘diagrammatic reasoning’ are commonly used, but their meaning is taken for granted, without too much concern for an explicit characterization.
Therefore, before discussing the classification, I will try to work out a characterization of diagrams, since in the literature there is no uncontroversial definition for them, supposing that such a definition exists. Maybe it is not possible to provide the necessary and sufficient conditions for something to be a diagram, but still we could imagine that all diagrams are related by family resemblances. The useful concept of ‘family resemblance’ has been introduced by Wittgenstein to characterize ‘a complicated network of similarities overlapping and criss-crossing: sometimes overall similarities, sometimes similarities of detail’ (Wittgenstein, [Reference Wittgenstein1953] 2001). This network of similarities recalls the various resemblances between the members of a family.
If this is the case, then we can ask: which are the overall features and which are the details that make all diagrams look alike? With this in mind, in the next sections my attempt will be to narrow down the territory of diagrams: I will discuss what diagrams are and what diagrams cannot be. To begin, I will point out that there are two respects in which a diagram can be investigated: indeed, the diagram is a representation of some piece of information, but at the same time it is also a tool that gets to be used by a subject. The classification will have to reflect this duality.
3 The domain (or at least the diagrammatic portion of it) in focus
3.1 What diagrams are
• A diagram is an external representation which is potentially public. It is possible to imagine an individual who chooses to use his or her personal notation which employs some particular (and idiosyncratic) diagrams. Still, this notation would be external to the mind of this individual and therefore potentially open to the public. Moreover, in the scientific activity it is common to find visual displays and diagrams which constitute a kind of jargon—even if not a properly linguistic one—which belongs to and is shared by some part of the scientific community.
• A diagram must be read to be understood; the activity of seeing that is in play when diagrams are considered is typically a seeing as (and not the seeing in which constitutes a typical problem for depictive images (e.g., Wollheim, Reference Wollheim2003)): each diagram has to be (correctly) interpreted to be used.
• A diagram is an artifact with a specific purpose. To be used, it must have been given by someone as a tool which is intended for someone else to some particular aim. This activity of giving as is an aspect that has been neglected by traditional points of view, which focused more on the possibility of getting to the propositional content of the diagram. Actually, before asking about content, it is necessary to acknowledge that a diagram is always given with some intention, that means that a diagram is an intended object: it is designed with a function in mind. This functionality and most of all the fact that the user understands it, is important for the reception of the very message conveyed by the diagram. Imagine I tell someone I am going to draw a diagram to show what the Pythagorean theorem is about. Then, I draw a triangle and three squares on its sides. Since I draw by free hand and I am not very good at it, my drawing will be only an approximation of what the geometrical notions of rectangular triangle and square prescribe. Nevertheless, if my intention of drawing a rectangular triangle and four squares is taken for granted, then there will be no problems in reading my drawing, even though it is not accurate, according to geometrical definitions.
• A diagram is a two-dimensional object which displays some information on the plane showing the spatial relationships among its elements, some of which are relevant for the treatment and the use of the contained information. The spatial relationships I consider here can be topological or geometrical. As Willats sums up, topological relations are the very basic spatial relations such as proximity or enclosure that would not change in a figure if a figure were printed on a rubber sheet and the sheet were stretched or twisted (Willats, Reference Willats1997: 70). For what regards geometrical relations, they identify properties such as the dimension or the shape of an element, in connection with the others. For the present purpose, I do not want to consider the existence of three-dimensional diagrams, even if it is possible to conceive them.
3.2 What diagrams are not
• A diagram is not a picture, in the sense of pictures as pictorial or recognitional artifacts. A diagram is a particular display that is intended to be used for managing some data, as, for example, extracting information or inferring some new conclusion from available knowledge. As I have already said, the typical activity of seeing which is involved in seeing a diagram is seeing as, and not seeing in. Therefore, a diagram is an artifact that is conceived as a memory aid or as an inferential aid.
• A diagram is not a linguistic array, and to some extent it has limited powers compared to a linguistic array. A claim has been circulated in the literature, according to which the diagram together with the eye, that is, the visual system, provides ‘perceptual’ inferences ‘at zero costs’ and produces all its elements ‘for free’ (Larkin & Simon, Reference Larkin and Simon1995: 99). This claim is actually misleading, because it dismisses the complex cognitive mechanisms that make the very diagrammatic reasoning possible. As Stenning et al. (Reference Stenning, Inder and Neilson1995) suggest, diagrams possess some expressive constraints. According to them, some graphics cannot express the abstractions which are necessary for some tasks. In such cases, these diagrams are proved pathological, and it is more convenient to replace them by a more expressive language. Nevertheless, if the graphics can express these abstractions, it can be predicted that their weak expressiveness will make them more efficient representations for performing the inferences needed. To express these abstractions, the topological and geometrical constraints on the two-dimensional surface of the graphics must interact with the ways in which these constraints are interpreted. In fact, it is necessary to distinguish between expressive efficacy, that is the capacity of expressing semantical properties such as consistency, or a restriction on the class of representable structures, and computational efficacy, that is low complexity of inference. Weakly expressive systems would be computationally more tractable. As explained in Stenning and Lemon (Reference Stenning and Lemon2001), an important issue for this theory is to understand to what extent properties of diagrammatic representations are to be explained in terms of their logical expressiveness, and how much in terms of the visual nature of the medium. The visual medium displays the cognitive properties of the graphics only in combination with the style of interpretation. Thus, it is the nature of interpretation of the medium, rather than the medium itself, which gives rise to the real differences between representational systems.
In the next section, I will present the variables that are relevant to define the classification I propose, and I will discuss some of the characteristic features of diagrams as I intend them.
4 The classification
4.1 Setting forth the variables
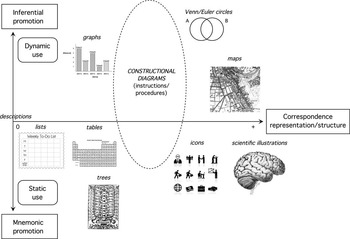
The classification I propose is represented in Figure 1. In what follows, I will discuss the constraints and the variables that I have considered to define it. First, I chose not to refer to the traditional coordinates that are familiar when dealing with information treatment, that is the couple syntax/semantics. In fact, this couple deals more with aspects concerning directly the content of the diagram, which can be expressed according to some explicit syntactic and semantic rules that are given in advance. By contrast, my hypothesis is that what is relevant here is the use of the diagram more than its content.
The diagrammatic classification

If the focus is on the use of diagrams for reasoning and inferring new conclusions, then there are three components to consider, and this is what multiplies the variables in play. First, there is the external diagram, the object, with contains both spatial relations and relevant objects that must be recognized as such in a global fashion; second, we have the diagram user, the subject, with her own background knowledge; finally, the diagram and the user are linked by a relation of interpretation. My attempt was to build these three components in the classification. The vertical axis represents the main possible uses that can be made of a diagram; the horizontal axis represents the relationship between the space displayed in the diagram and the data structure the diagram is intended to convey. The reason for distinguishing between the two different uses of a diagram is the importance that is given to the notion of diagram change or diagram manipulation. In fact, in my view, what is in question in diagrammatic reasoning is not a set of more or less explicit rules, but a set of procedures. What we learn when we learn how to use a system of representation for performing some inferences is a manipulation practice.
Therefore, the antidote against the logocentric approach to visual displays and diagrams in particular consists neither in finding the right set of rules nor in assuming an opticentric approach, but in considering that the most relevant aspect of diagrammatic reasoning is the way in which diagrams, figures, graphs, are manipulated to infer some new conclusion from them; this happens in continuous interaction with language. The classification I offer moves away from an approach to diagrams that has as its aim to answer to a question about the sufficient and necessary conditions for something to be called a diagram toward an approach that focuses more on the actual treatment of the data conveyed by the diagram—that is, an approach that has as its aim to answer to a more pragmatic question about the different uses that can be made of something that can be called diagram.
Thus, the classification incorporates a view that moves from a purely syntactic approach to a semantic and indeed pragmatic approach to problem solving. As Grosholz claims for the case of the epistemology of mathematics, there are reasons for pursuing this approach, which considers the use of language in terms of its representational role in an historical context of problem-solving (Grosholz, Reference Grosholz2007). In fact, the classification includes different sorts of diagrams that have different features and can be used with different objectives. Moreover, in order to respect the pragmatic approach, it must be pointed out here that diagrams may not convey the same information for different users, or they may be used with different intentions; therefore, the same diagram could be placed differently in the classification by users who differ in expertise and intention.
4.2 The two different axes
Concerning the vertical axis, I distinguish between two different—but not incompatible—uses of a diagram. The first use is a static use, the second is a dynamic one.
With static diagrams, the subject user simply extracts some piece of information from the object diagram. It is for this reason that the diagram promotes her memory. The area of the plan to consider is the one below the horizontal axis. Lists, tables, icons, are kinds of representations that serve as memory aid and therefore promote our mnemonic capacities. Among these static diagrams, there are also scientific illustrations, although I have claimed before that pictures are discarded. The reason is that scientific illustrations as I intend them are not depictive, for they, analogously to diagrams, are used as tools to represent some information. The aim for which scientific illustrations are given is to show the invariant characteristics of what they represent. If this is true, scientific illustrations are similar to maps, since they provide essential information, without showing all the details: they contain only information relevant to the task, that in this case is a mnemonic promotion or learning. Therefore, scientific illustrations are some sort of schema that visually displays some selected pieces of information about what it is intended to represent. In this respect, a well done scientific illustration will be the same kind of picture as, for example, the Copernicus’ drawing of the cosmos with the sun at the center: even if scientific illustrations are in general morphological, while Copernicus’ drawing represents the solar system, they will both have the same function, that is the one of presenting the spatial and structural organization of some aspects of reality, offering a kind of map of the properties that define them. I will come back to the case of scientific illustrations when I discuss the horizontal axis.
With dynamic diagrams, the user infers some new piece of information from the diagram, and does that by modifying—that is, manipulating—it. As Polya (Reference Polya1945) suggested, to solve a problem it is first necessary to understand the problem and only then it is possible to devise and carry out a plan. To this aim, a diagram or an external representation in general can be of help, since a detail which is pictured in the imagination of the user may be forgotten, but the detail traced on paper remains. For this reason, when the user comes back to the diagram, it reminds her of the previous remarks, saving her some of the trouble in recollecting her previous considerations.
Fischbein (Reference Fischbein1987) claimed that a diagram is dynamic when it implies a certain procedure and an experiment as a consequence of the application of that procedure. Informal inferences take very often the form of physical transformations of and on the diagram, but it is true that only some of all the possible transformations are legitimate. It is precisely when the user knows which manipulations are legitimate and meaningful and which are not, that she proves to master that system of representation. The rules typical of diagrammatic systems are therefore normally externalized as procedures. As a consequence, the user does not learn a single manipulation, but a set of procedures, not abstract rules, but instructions about how to act on the diagram, and thus to read and interpret it correctly. This is in line with what Peirce (Reference Peirce1906) was suggesting, when he claimed that it is not the statical diagram icon that shows the validity of some conclusion, but the diagram icon that has been constructed with an intention; moreover, it is its dynamic interpretant that determines a state of activity in the interpreter, and this mixture leads to experimentation.
Concerning the horizontal dimension, I chose to represent the correspondence between the particular diagrammatic format and the structure of data that it is meant to be expressed by using that particular diagrammatic format. This correspondence can have different values. It can have value 0 in the case of linguistic descriptions, which relate to the structure of the data they are meant to talk about only arbitrarily. By contrast, the correspondence can have a very high value in the case of scientific illustrations, which are precisely meant to exemplify the very structure of the data in question. As I have already suggested, scientific illustrations are similar to maps since their function is to show the organization of complex structures, at a sufficiently high level of abstraction. Of course, the designer, if she wants to succeed, must give the diagram or the scientific illustration as a diagram or a scientific illustration intended for some particular task. For this reason, she has to choose which pieces of information to favor, and different choices can give as a result different diagrams or scientific illustrations, depending on the aspects that are intended to be stressed. What are the needs of the user? What kinds of question does she want to ask to the image?
As I have already pointed out, I decided not to include in the classification other kinds of pictures such as, for example, depictive ones, because the target of the classification was meant to be only diagrams that are used to the aim of extracting information or inferring some conclusions. Nevertheless, there are some aspects of pictorial representations that are of interest here. In fact, there are two ways in which recognitional mechanisms can have some influence on diagrammatic reasoning.
The first case to consider is when the value of the correspondence on the horizontal axis is very high, and the user shows a tendency of considering the illustrations as depictive pictures as such and not as data representations, and therefore only as schemas. This is a challenge also for the illustrator, who must reproduce reality but at the same time is committed to the theory that constitutes the lens through which reality is presented. In fact, the expert user knows that even when the iconic level is high, and the illustration seems to ‘resemble’ and simply depict what it represents, it is still a schema.
A second kind of influence of recognitional mechanisms on diagrammatic reasoning appears also when the value of the correspondence is very low, but the user shows a tendency of seeing and recognizing things in the diagram. As a consequence, the data become ‘visible’ for her: for example, she sees a pie or a bar in a graph. In fact, it is at this level that a particular interaction with language is evident, in this use of metaphors to describe the diagrams. For example, imagine a visualization of the DNA: the user immediately refers to it as a code, or as a string, or as ‘the’ double helix. This happens because we have the tendency of looking for some more familiar shapes and structures in the less familiar ones. As in the case of the double helix for the DNA, some of these metaphors are so stable that we lost track of their metaphorical aspect when referring to particular diagrams.
Pinker (Reference Pinker1990) elaborates on the interaction between graphs and language, by introducing in his theory of graphs the notion of visual description, which is a structural description created by processes of visual encoding. His prediction is that a given sort of conceptual information is easily extractable from a graph when the graph encodes the desired conceptual information as an easily perceivable visual predicate and the correspondence between the two is easily represented in the mind of the reader; in other words, the reader possesses a linguistic label to describe it. For instance, it is precisely for this reason that it is very useful to represent changing flows with line graphs, since our language offers many attributes to describe line trends.
4.3 Manipulations, procedures and constructional diagrams
I will now focus on the dynamic use of diagrams. According to the classification I propose, diagrams such as graphs, Euler circles, Venn circles and even maps, belong to the portion of the classification above the horizontal axis, that is, the portion of diagrams which are used dynamically. In my view, the structure of deductive competence—that is, of using a diagram to acquire new knowledge—concerns these representations. For this reason, instead of making a distinction between syntactical and semantical content, my hypothesis is that it is more promising to consider the ways in which these inference-promoting diagrams are understood correctly only when they can be reproduced and correctly manipulated.
The user demonstrates to know how to use a graph when, once asked to reproduce it, she is to able to copy only its relevant spatial bits. Moreover, if the user adds a new element to the graph, it does not matter the way in which this insertion would change the visual aspect of the graph as long as this alteration respects the correct interpretation and the conceptual reading of it. In other words, the user must be able to get rid of what Tufte ([Reference Tufte1983] 2001) defines ‘chartjunk,’ that is the set of all visual elements that are not necessary to comprehend the information represented and that in some cases can even be distracting. The same goes for the Euler or Venn circles. Of course, they exploit some visual—or better perceptual—schema such as the ‘containment schema’, as Lakoff and Nuñez (Reference Lakoff and Nuñez2001) suggest. Nevertheless, they can be manipulated and reproduced correctly only when the user knows which of their spatial properties are invariant. Euler and Venn circles could be changed into squares, for example, but their intersections should be preserved; no color can be inserted in a Euler circle, while on the contrary the position of the color should be preserved in a Venn one. Also in the case of maps, in order to move and orient ourselves in them, the user should be aware not only of the shapes and lines she ‘sees’ on the map, but also of the fact that the map has an orientation which is relative to her present position, and therefore she can move it and rotate it so as to position herself onto it. Therefore, these diagrams, which can be used dynamically, and which can also still be used statically as memory aids—as I said at the beginning, the two uses are not incompatible—define an area more or less at the center of my classification ready to be explored that I will call the area of constructional diagrams.
I am taking the term ‘constructional’ from Maynard (Reference Maynard2005), who takes it in turn from Booker (Reference Booker1963). ‘Constructional drawings’ are drawings that are not given as depictive, but as tools to calculate and measure. As a consequence, they can be—and to some extent, must be—adjusted, reconsidered, pre-planned. According to Booker, these drawing have been neglected in modern times, since in studying drawing there has been the tendency to concentrate upon what is marked on pieces of paper and to forget what today we would call detail drawing, which was marked on the actual stone or wood in the past instead of paper. The shapes of constructional drawings may be understood as operations that are not visible in the final product: it is because we are able to make the drawing that we can understand the result it designs.
On this point, Ferguson claims that until the second half of the 20th century, engineering schools taught how to understand engineering drawings by teaching how to make such drawings; they built an appreciation of the nature of materials and machines through laboratory experience. As the author suggests, ‘the training of Filippo Brunelleschi, Francesco di Giorgio, and Leonardo da Vinci included apprenticeships in which they learned how to prepare and use the materials required to make drawings, paint pictures, and produce sculptures in stone and metal. Their knowledge was based on sensual observations, and they were guided by masters who showed the apprentices what to look for’ (Ferguson, Reference Ferguson1992: 153).
This is analogous to what is in play in considering constructional diagrams in my classification. In seeing constructional diagrams, we see a practice: knowing which is the correct procedure to apply makes us capable of distinguishing the legitimate manipulations of the diagrams among all the possible ones. The notion of manipulation is useful because it brings us beyond the dichotomies that have animated the traditional debates. If we look at the procedures which are applied once a practice is learnt, then we are not only able to overcome the dichotomies linguistic/visual and syntactic/semantic, which I have already discussed, but also to put other contrasts in a new perspective. The oppositions internal/external—is the diagram represented in our mind as it is on the piece of paper?—or mental/material—does diagrammatic reasoning happen all in our mind or in the external world?—are recomposed by considering the duality in diagrammatic reasoning between the object diagram and the subject user.
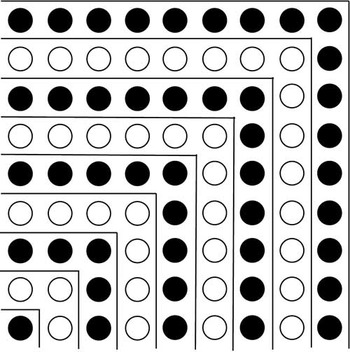
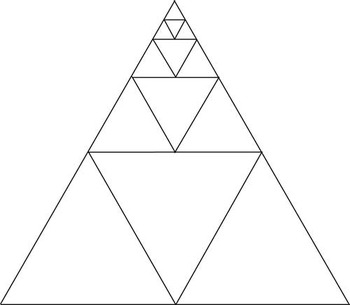
If constructional diagrams are inviting the user to perform some operation on them, that means that they are revealing all the information they contain in a global and synthetic way but not in a single instant, which is not the same thing. In fact, inferential diagrams are constructed step by step. The message they contain is about procedures of spatial organization to apply, both if the space is discrete and continuous.
The diagrams in Figures 2 and 3 contain a message on the next possible step to perform, but in the first case the instruction given is on how to add the next row of discrete white spots, while in the second one the instruction is on how to extend the continuous lines of the bigger triangle so as to make it contain more and more smaller triangles.
1 + 3 + 5 + ⋯ + (2n − 1) = 2n

 $$\[--><$>\frac{1}{4}\, + \,{{\left( {\frac{1}{4}} \right)}^2} \, + \,{{\left( {\frac{1}{4}} \right)}^3} \, + \, \cdots \, = \,\frac{1}{3} <$><!--$$

It is maybe not by chance that these two diagrams are on the book covers of Nelsen (Reference Nelsen1997, Reference Nelsen2001): these proofs are not ‘without words’ in the sense that there is no interaction with language in them, since, as we see in these two cases, they are intended to prove a theorem which is expressed in a formula of the language of mathematics; rather, they are without words because they simply exhibit the instructions on how to use the diagram, and do not describe them.
If this is true, work has to be done about diagrams which are used dynamically. First, it could be very useful to investigate whether their powers of inferential promotion depend on their spatial characteristics, and if this is the case, which of these spatial characteristics are more relevant. For example, in the procedures of manipulations, are their topological properties more relevant and invariant than the geometrical relations they display? Is the perception of symmetrical properties salient to learn how to change a diagram into another one? Another possibility will be to test people and look for empirical evidence of the fact that understanding diagrams really depends on their capacity of modifying them. Finally, it would be possible to ask whether there are typical manipulations which apply to particular types of diagrams in the classification.
5 Conclusions
In this article, I presented the lines for a diagrammatic classification. My background hypothesis was that it is time to explore in detail the domain of visual displays that has been recently and hopefully rehabilitated.
I chose to look at one region of this domain, which is the one inhabited by diagrams and diagrammatic displays. In my view, it is necessary to discard the traditional dichotomies and give an account of the duality of diagrammatic reasoning, that is of a reasoning that is performed by a subject—the user—by means of an object—the external diagram. It is not correct to think that it suffices to ‘see’ diagrams to extract information: by contrast, interpretation and intention play a very relevant role.
The coordinates I propose are the two different uses that can be given of diagrams—a static and a dynamic one—and the correspondence that is created between the spatial structure of the diagram and the structure that is given to the data to be represented by means of it. A particular role is played by the diagrams populating the area at the center of the classification, which I defined as constructional diagrams. Constructional diagrams contain, convey and exhibit the instructions on how to manipulate them to infer some conclusion about what they represent.
The distance to cover in exploring even this smaller portion of the territory of visual thinking is still long. To improve my classification, it is first possible to ask whether a single diagram can be considered independently from the system of representation it belongs to. Second, it is also possible to consider the kind of learning which is in play for each type of external representation, to see whether some of them or some systems of them can be used—that means, if I am right, correctly manipulated—more spontaneously, compared to others that need to be learnt more attentively. This would show what, if any, are the degrees of arbitrariness that slow down the learning processes of diagrammatic reasoning.
Some general—though tentative—framework is set: its exploration in depth is matter of further research.
Acknowledgements
I would like to thank Anouk Barberousse, Roberto Casati, Patrick Maynard, Elena Pasquinelli, Mario Piazza and Sandro Pignocchi for our discussions and their useful suggestions. I also thank the anonymous referees of the first version of this article for their accurate remarks. The research was supported by the European Community's Seventh Framework Program ([FP7/2007-2013] under a Marie Curie Intra-European Fellowship for Career Development, contract number No. 220686—DBR (diagram-based reasoning)).