Introduction
Sheep (Ovis aries) are domestic animals relevant to embryology research. Despite this contribution, there are fundamental tools not yet available to ensure the dissection of the ovine-specific developmental processes. For instance, the relative transcript abundance of genetic determinants (e.g. transcription factors) that control ovine preimplantation development remains poorly described. This fact is probably due to the interplay of several factors, such as limited availability of biological material and the stochastic nature of gene expression during preimplantation development (Li et al., Reference Li, Zheng and Dean2010; Wennekamp and Hiiragi, Reference Wennekamp and Hiiragi2012; Jeong et al., Reference Jeong, Kang, Gurunathan, Cho, Park, Seo and Kim2014).
Among the available tools for gene expression analysis, quantitative reverse transcription PCR (RT-qPCR) is widely used for accurate measurements of both relative and absolute gene transcript abundance (VanGuilder et al., Reference VanGuilder, Vrana and Freeman2008; Bustin, Reference Bustin2010; Moura et al., Reference Moura, Silva, Nascimento, Ferreira-Silva, Cantanhêde, Kido, Benko-Iseppon and Oliveira2019), even for loci of low transcript abundance (Derveaux et al., Reference Derveaux, Vandesompele and Hellemans2010). The RT-qPCR combines accuracy, specificity and reproducibility (Luchsinger et al., Reference Luchsinger, Arias, Vargas, Paredes, Sánchez and Felmer2014). However, RT-qPCR requires appropriate selection of housekeeping genes (HKGs) for normalization across experimental conditions (O’Connor et al., Reference O’Connor, Wilmut and Taylor2013). The correct identification of HKGs allow the elimination (or substantially reduction) of experimental bias from cell-intrinsic factors, experimental conditions, RNA extraction efficiency, and mRNA integrity, among other factors (VanGuilder et al., Reference VanGuilder, Vrana and Freeman2008; O’Connor et al., Reference O’Connor, Wilmut and Taylor2013; Wang et al., Reference Wang, Li, Song and Yang2017).
Despite the progress made to understand ovine preimplantation embryos (Bebbere et al., Reference Bebbere, Bogliolo, Ariu, Fois, Leoni, Succu, Berlinguer and Ledda2010; O’Connor et al., Reference O’Connor, Wilmut and Taylor2013; Jeong et al., Reference Jeong, Kang, Gurunathan, Cho, Park, Seo and Kim2014; Silva et al., Reference Silva, Moura, Silva, Nascimento, Silva, Ferreira-Silva, Cantanhêde, Chaves, Benko-Iseppon and Oliveira2018), to the best of our knowledge, there is no report describing the selection of HKGs for RT-qPCR normalization in ovine embryos. One report has used exogenous mRNA spiking (Masala et al., Reference Masala, Ariu, Bogliolo, Bellu, Ledda and Bebbere2018) and another relied on a single internal gene for data normalization (Hosseini et al., Reference Hosseini, Moulavi, Tanhaie-Vash, Asgari, Ghanaei, Abedi-Dorche, Jafarzadeh, Gourabi, Shahverdi, Dizaj, Shirazi and Nasr-Esfahani2016).
The aim of this study was to comprehensively select HKGs for RT-qPCR normalization and validate them by measuring the relative gene expression of zinc finger protein X-linked (ZFX) and developmental pluripotency-associated 3 (DPPA3) gene transcripts during ovine parthenogenetic preimplantation development. We chose DPPA3 and ZFX for RT-qPCR validation because of their contrasting temporal gene expression in sheep embryos (Bernardi et al., Reference Bernardi, Cotinot, Payen and Delouis1996; Hosseini et al., Reference Hosseini, Moulavi, Tanhaie-Vash, Asgari, Ghanaei, Abedi-Dorche, Jafarzadeh, Gourabi, Shahverdi, Dizaj, Shirazi and Nasr-Esfahani2016; Masala et al., Reference Masala, Ariu, Bogliolo, Bellu, Ledda and Bebbere2018).
Materials and methods
Oocyte collection and in vitro maturation
The ovaries were collected from local abattoirs (Pernambuco, Brazil) and transported in saline solution (0.9% NaCl) supplemented with 10 µg ml−1 penicillin and 50 µg ml−1 streptomycin (Gibco) at 38°C. The ovaries were washed three times with Dulbecco’s phosphate-buffered saline (DPBS; pH 7.0–7.2) and kept at 35°C. Follicles (3–6 mm) were aspirated with 10 ml syringes and 40 × 12 mm needles. The follicle content was placed in 15 ml conical tubes at 35°C. At least 5 min afterwards, the supernatant was removed from the conical tube and the pellet was resuspended in 10 ml DPBS. The cumulus–oocyte complexes (COCs) were placed in a Petri dish and examined under a stereomicroscope (Nikon, Tokyo, Japan).
COCs with homogeneous cytoplasm and at least one compact layer of cumulus cells were selected for in vitro maturation (IVM), as previously described by Silva et al. (Reference Silva, Moura, Silva, Nascimento, Silva, Ferreira-Silva, Cantanhêde, Chaves, Benko-Iseppon and Oliveira2018). The COCs were incubated at 38.5°C, under 5% CO2 in air and saturated humidity for 24 h.
Oocytes were denuded using 0.2% hyaluronidase after IVM and randomly allocated into two groups: (i) pools of 50 oocytes were transferred to microtubes containing 100 µl phosphate-buffered saline (PBS) without calcium and magnesium (PBS−Ca−Mg), snap frozen in liquid nitrogen and stored at −80°C for total RNA extraction; and (ii) pools of mature oocytes were subject to parthenogenetic activation (PA).
Parthenogenetic activation and embryo culture
Denuded oocytes were washed in synthetic oviduct fluid (SOF) medium and subjected to PA by 5.0 µM ionomycin in SOF medium for 5 min and washed once in SOF medium. Next, oocytes were incubated in 2 mM 6-dimethylaminopurine (6-DMAP) for 3 h as previously described by Silva et al. (Reference Silva, Moura, Silva, Nascimento, Silva, Ferreira-Silva, Cantanhêde, Chaves, Benko-Iseppon and Oliveira2018). Activated oocytes were extensively washed in SOF medium and transferred to a culture dish containing a cumulus cell monolayer.
The cleavage rate was determined at 48 h (Day 2) post-PA and 4-cell to 8-cell embryos were collected randomly and stored in microtubes (pools of 20 embryos in 100 µl PBS-Ca-Mg), snap frozen, and stored at −80ºC. At 120 h post-PA (day 5), embryos at the morula stage were transferred to microtubes (pools of 10 embryos in 100 µl PBS−Ca−Mg), snap frozen, and stored at −80ºC.
Total RNA extraction, RNA quantification and cDNA synthesis
Total RNA from mature oocytes (n = 50), cleavage-stage embryos (n = 20), and morula (n = 10) were obtained using an RNeasy Micro Kit (Qiagen) following the manufacturer’s instructions. RNA samples were quantified using a NanoDrop 2000 C spectrophotometer (Thermo Scientific). An amount of total RNA of each sample (20 ng) was subjected to reverse transcription (RT) immediately after RNA extraction using QuantiTect RT Kit (Qiagen), according to the manufacturer’s instructions. Genomic DNA elimination reaction was carried out at 42°C for 3 min, and the cDNA synthesis reaction was performed at 42°C for 30 min. Finally, samples were incubated at 95°C for 3 min (RT inactivation) and stored at −20°C.
Primer design
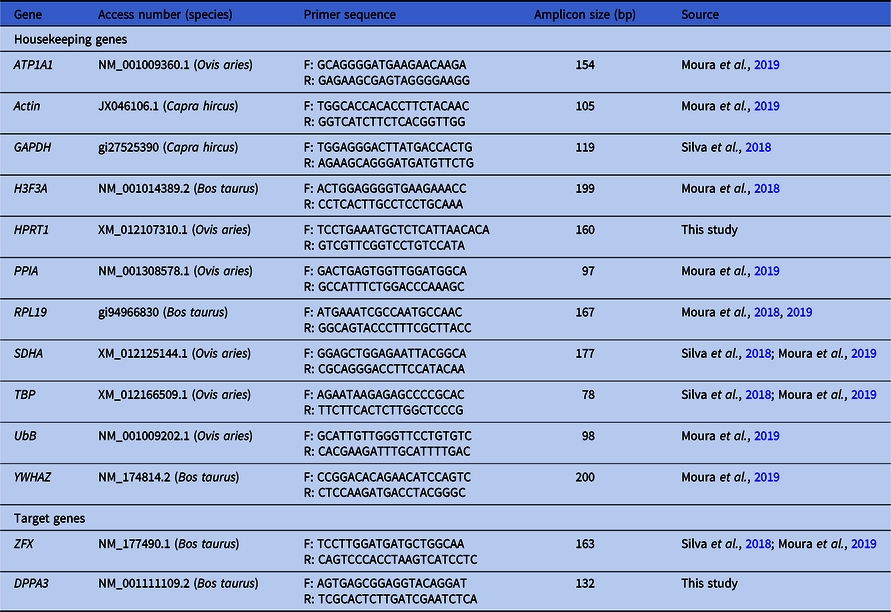
Primers were designed using Primer-BLAST and Primer 3 software (Rozen and Skaletsky, Reference Rozen and Skaletsky2000; Ye et al., Reference Ye, Coulouris, Zaretskaya, Cutcutache, Rozen and Madden2012). Primer design was based on the following criteria: amplicon size (70–200 bp), GC content (40–60%), primer size (19–23 bases), and avoiding primer dimers and hairpin loops (Table 1). Primer sequences were also obtained from previous reports (Moura et al., Reference Moura, Silva, Cantanhêde, Silva, Ferreira-Silva, Silva, Ramos-Deus, Pandolfi, Kido, Benko-Iseppon and Oliveira2018, Reference Moura, Silva, Nascimento, Ferreira-Silva, Cantanhêde, Kido, Benko-Iseppon and Oliveira2019; Silva et al., Reference Silva, Moura, Silva, Nascimento, Silva, Ferreira-Silva, Cantanhêde, Chaves, Benko-Iseppon and Oliveira2018).
Primers for RT-qPCR of housekeeping genes and target genes in ovine oocytes and preimplantation embryos

ATP1A1, ATPase Na+/K+ transporting subunit alpha 1; DPPA3, developmental pluripotency-associated 3; GAPDH, glyceraldehyde 3-phosphatedehydrogenase; H3F3A, H3 histone, family 3A; HPRT1, hypoxanthine phosphoribosyltransferase 1; PPIA, peptidylprolyl isomerase A; RPL19, ribosomal protein L19; RT-qPCR, quantitative reverse transcription polymerase chain reaction; SDHA, succinate dehydrogenase complex flavoprotein subunit A TBP, TATA-binding protein; UBB, ubiquitin B; YWHAZ, tyrosine 3-monooxygenase/tryptophan 5-monooxygenase activation protein zeta; ZFX, zinc finger protein X-linked.
Quantitative reverse transcription PCR (RT-qPCR)
RT-qPCR was carried out using the SYBR Green detection system in a Line Gene 9660 device (FQD-96A – Bioer). The qPCR reaction were prepared with 1 μl cDNA, 5 μl 2× Go Taq qPCR Master Mix (Promega), 3.4 μl ultrapure H2O, and 0.6 μl primers (2.5 μM) in a final volume of 10 μl. The cDNA was used as 1:10 diluted samples. Negative controls were obtained using qPCR reactions without RT, to exclude the possibility of amplification from residual genomic DNA. The RT-qPCR reactions were carried out with the following conditions: initial denaturation at 95ºC for 2 min and 40 cycles at 58ºC for 60 s. Dissociation curves (melting curves) were analyzed from 65 to 95ºC for 20 min after 40 cycles. Relative expression was determined using the number of cycles of quantification (Cq) during the log phase of the qPCR reaction.
Primer efficiency was calculated using the standard curve method: 100 (no dilution), 10−1 (1:10 dilution), and 10−2 (1:100 dilution) according to a previous report by Wang et al. (Reference Wang, Li, Song and Yang2017). The efficiency of each primer was determined (E = 10−1/slope), alongside the Pearson coefficient correlation (R), and y-intercept (y). Primers were used further if efficiency reached 90–110% (Silva et al., Reference Silva, Silva, Neto, Costa, Nardi, Chabregas, Burnquist, Kahl, Benko-Iseppon and Kido2014).
Relative gene expression was determined using the 2–ΔΔCt method using the relative expression software tool (REST) (Pfaffl et al., Reference Pfaffl, Horgan and Dempfle2002; Schmittgen and Livak, Reference Schmittgen and Livak2008). In total, three biological and two technical replicates were used in the study.
RT-qPCR normalization
HKGs were assessed using GeNorm software version 3.5 both for the most appropriate and the minimum number of HKGs required for normalization (Vandesompele et al., Reference Vandesompele, De Preter, Pattyn, Poppe, Van Roy, De Paepe and Speleman2002) based upon the raw Cq data from these reactions. GeNorm software determines an HKG stability value (M-value) and also calculates an HKG index with increasing number of HKGs. The M-value was a parameter for ranking the HKGs (Vandesompele et al., Reference Vandesompele, De Preter, Pattyn, Poppe, Van Roy, De Paepe and Speleman2002).
Bioinformatics
Reference DPPA3/STELLA mRNA and protein sequences of ovine (Ovis aries) and bovine (Bos taurus) were retrieved from GenBank (www.ncbi.nlm.nih.gov/genbank/). The mRNA and protein alignments were carried out using MUSCLE (www.ebi.ac.uk/Tools/msa/muscle/). The mRNA motifs and regulatory sequences were predicted using RegRNA 2.0 software (http://regrna2.mbc.nctu.edu.tw/). Protein domain identification was performed using COBALT (www.ncbi.nlm.nih.gov/tools/cobalt/) and protein secondary structure was predicted using SMART (http://smart.embl-heidelberg.de/).
Results
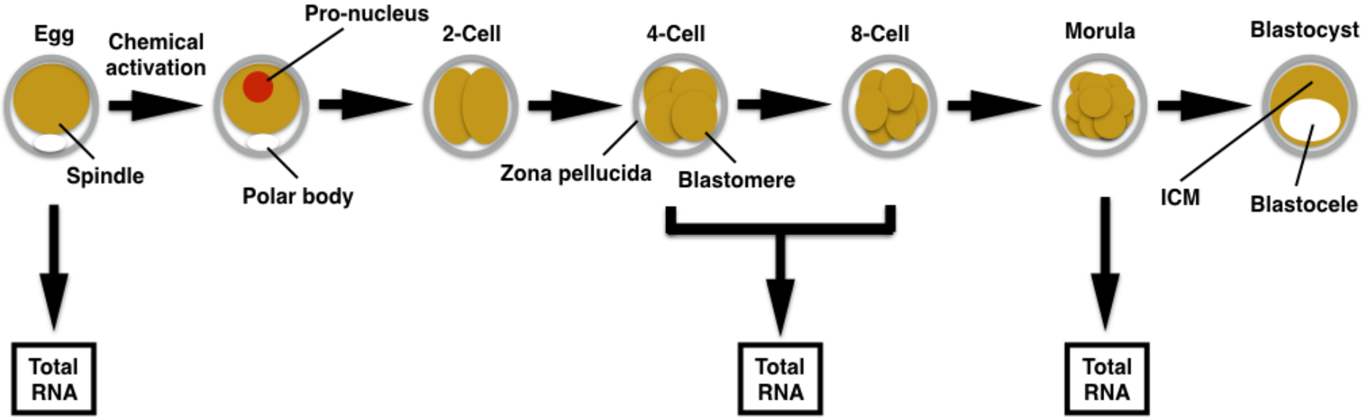
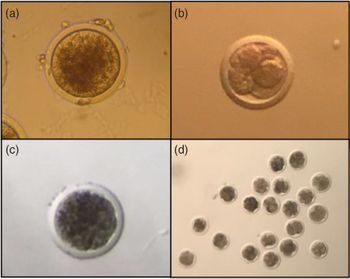
Experimental design is outlined for dissecting gene expression in ovine parthenogenetic embryos (Fig. 1). Ovine parthenogenetic embryos were produced in vitro (Fig. 2). Total RNA was extracted and quantified (Table S1), although cDNA synthesis was carried out with identical RNA input (see Materials and methods). Eleven HKGs were tested using absolute RT-qPCR reactions (Table 1). All qPCR reactions displayed a single melting curve, and therefore suggested specific amplification of the intended PCR product (Fig. Supplementary 1).
Experimental design. Ovine preimplantation development to the blastocyst stage. Total RNA extraction in specific developmental stages. ICM, inner cell mass.

Ovine preimplantation development. (a) Oocyte after in vitro maturation. (b) Cleavage-stage embryo. (c) Morula-stage embryo. (d) Pool of 20 embryos used for RNA extraction. ×160 (a–c) and ×40 (d) magnification.

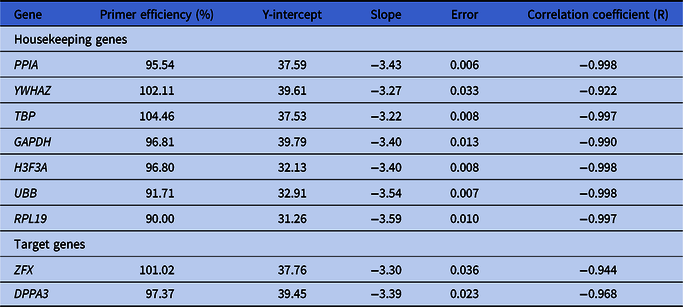
To rule out any primer-based bias, primer efficiency was determined using the standard curve (serial dilution) method (Fig. S2). Based on this method, HKGs displayed varying efficiencies (Table 2). From the initial HKG pool, seven reached efficiency threshold (97.20–104.46%), with correlation coefficients from −0.922 to −0.998, and a slope from −3.22 to −3.59 (Table 2). Therefore, these seven HKGs displayed adequate parameters for potentially establishing RT-qPCR normalization. Similarly, both target genes chosen for RT-qPCR validation (Table 2) reached primer efficiency threshold (Fig. S2).
Primer efficiency determined using the standard curve method

DPPA3, developmental pluripotency-associated 3; GAPDH, glyceraldehyde 3-phosphatedehydrogenase; H3F3A, H3 histone, family 3A; PPIA, peptidylprolyl isomerase A; RPL19, ribosomal protein L19; TBP, TATA-binding protein; UBB, ubiquitin B; YWHAZ, tyrosine 3-monooxygenase/tryptophan 5-monooxygenase activation protein zeta; ZFX, zinc finger protein X-linked.
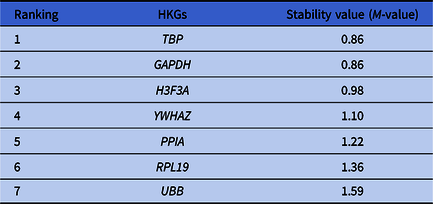
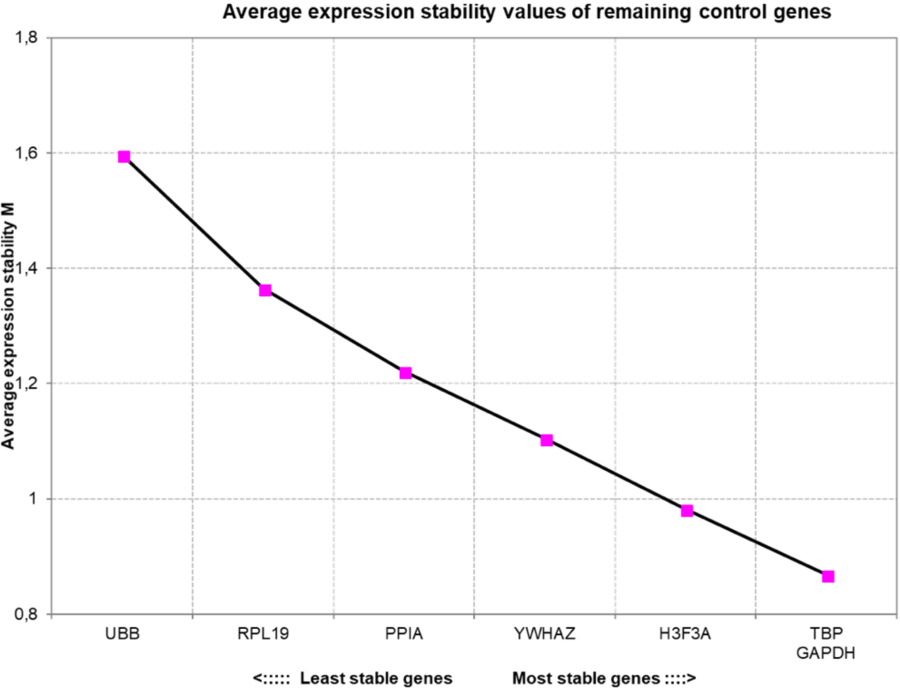
GeNorm ranked the HKGs based on its stability score (Table 3). Further, GeNorm showed that the combination of GAPDH and TBP was the best ranked HKG pair, while the H3F3A was the third most stable HKG (Fig. 3). In contrast, the UBB was the least stable HKG (Fig. 3). The most appropriate number of HKGs for RT-qPCR normalization was also estimated using GeNorm (Fig. 4). Therefore, it was demonstrated that four or five HKGs would be more efficient for RT-qPCR normalization, as these HKG numbers would reach stability values more similar to the 0.15 arbitrary cut-offs (Fig. 4). RT-qPCR normalization was tested using two and three HKGs (Fig. 5).
Housekeeping gene (HKG) ranking using GeNorm
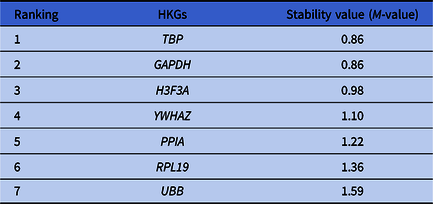
GAPDH, glyceraldehyde 3-phosphatedehydrogenase; H3F3A, H3 histone, family 3A; PPIA, peptidylprolyl isomerase A; RPL19, ribosomal protein L19; TBP, TATA-binding protein; UBB, ubiquitin B; YWHAZ, tyrosine 3-monooxygenase/tryptophan 5-monooxygenase activation protein zeta.
Housekeeping gene stability values determined by GeNorm during early ovine preimplantation development.

Most appropriate number of housekeeping genes determined by GeNorm for RT-qPCR normalization during early ovine preimplantation development.

(a–c) Relative expression of DPPA3 and ZFX gene transcripts using REST and different RT-qPCR normalization settings (GAPDH and TBP or GAPDH, H3F3A, and TBP). GAPDH, glyceraldehyde 3-phosphate dehydrogenase; H3F3A, H3 histone, family 3A; TBP, TATA-binding protein; REST, relative expression software tool.

YWHAZ was investigated for relative gene expression analysis as it was not detected in ovine cleavage-stage embryos (Fig. 5). This fact strongly suggested that the YWHAZ transcript may hold stage-specific developmental control. YWHAZ gene transcript abundance was similar between mature oocytes and morulae stages (Fig. 5). This fact therefore suggested that the failure of detection during the cleavage-stage was likely to be the cause for ruling out YWHAZ as an HKG for RT-qPCR normalization.
RT-qPCR validation was carried out initially by the relative expression of the ZFX transcript (Fig. 5). ZFX was downregulated both on cleavage-stage embryos (P = 0.191) and morulae (P = 0.142) in comparison with oocytes when using two HKGs for RT-qPCR normalization. Similar results were found between mature oocytes and morulae (P = 0.071), between mature oocytes and cleavage-stage embryos (P = 0.092). Furthermore, no difference was found between cleavage-stage embryos (P = 0.191) and morulae (P = 0.0728) using three HKGs (Fig. 5). In summary, the ZFX gene transcript levels were undistinguishable among these developmental stages.
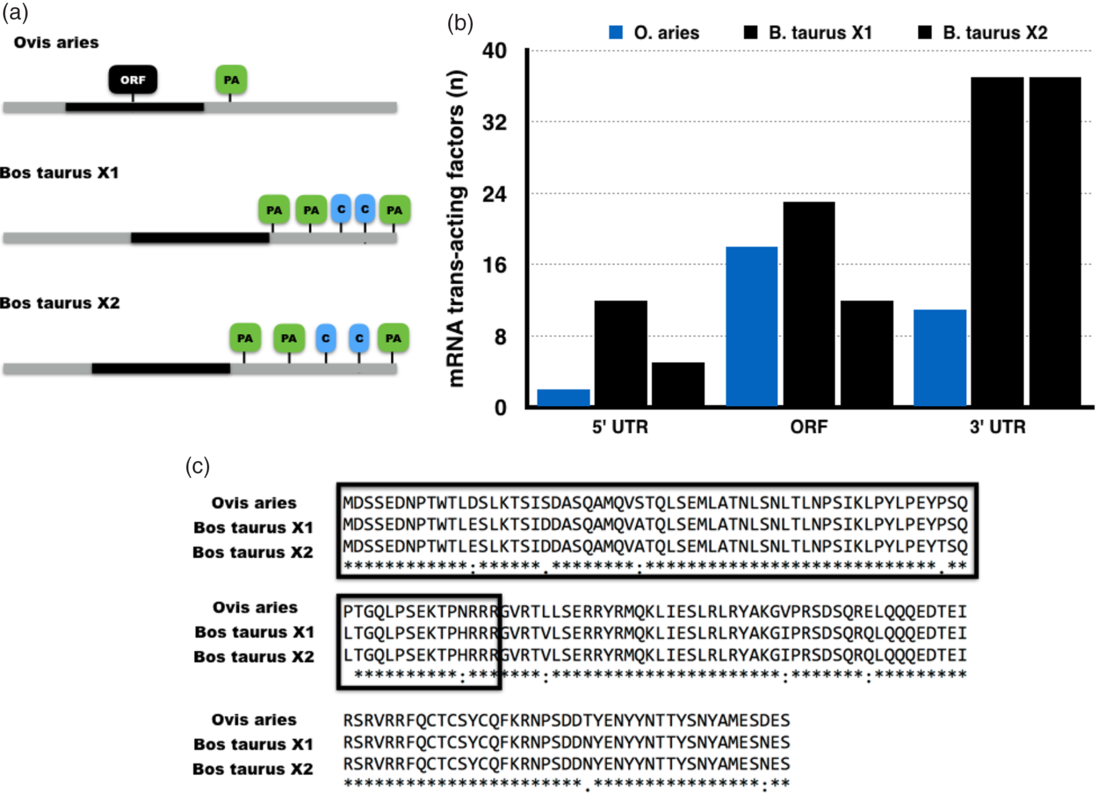
The second target gene used for relative gene expression validation was DPPA3/STELLA. Irrespectively of the RT-qPCR normalization settings, DPPA3 did not show any difference in gene transcript levels among developmental stages (Fig. 5). Curiously, this suggested that DPPA3 may not hold a maternal gene expression pattern. To explore the potential sources of such difference and gain insight into the regulatory mechanisms of ovine DPPA3, both mRNA and protein sequences were characterized and compared with the bovine orthologues by bioinformatics (Fig. 6). Ovine DPPA3 mRNA alignment with the two bovine isoforms revealed substantial sequence variation (Fig. S3). Nonetheless, greater conservation was found between the ovine mRNA and the bovine X2 isoform (Fig. S3), although the regulatory sequences are more conserved between bovine isoforms (Fig. 6). The protein sequence alignment revealed a high conservation between ovine and bovine orthologues (Fig. 6). More importantly, the chromatin binding sequence was nearly identical among the ovine and bovine DPPA3 orthologues (Fig. 6).
In silico characterization of the ovine DPPA3 mRNA and protein. (a) Schematic representation of the ovine and bovine DPPA3 mRNAs. (b) Number of predicted RNA-binding proteins (trans-acting factors) by RegRNA 2.0. (c) Alignment of ovine and bovine DPPA3 protein orthologues by MUSCLE. The DPPA3 N-terminal sequence is highlighted as it is predicted to bind to chromatin (Nakamura et al., Reference Nakamura, Liu, Nakashima, Umehara, Inoue, Matoba, Tachibana, Ogura, Shinkai and Nakano2012). C, CPE-like sequence; ORF, open reading frame; PA, polyadenylation site.

Discussion
Ovine preimplantation development has been explored at the molecular level using gene expression analysis of developmentally important genes (Thurston et al., Reference Thurston, Taylor, Gardner, Sinclair and Young2008; Hosseini et al., Reference Hosseini, Moulavi, Tanhaie-Vash, Asgari, Ghanaei, Abedi-Dorche, Jafarzadeh, Gourabi, Shahverdi, Dizaj, Shirazi and Nasr-Esfahani2016; Masala et al., Reference Masala, Ariu, Bogliolo, Bellu, Ledda and Bebbere2018; Silva et al., Reference Silva, Moura, Silva, Nascimento, Silva, Ferreira-Silva, Cantanhêde, Chaves, Benko-Iseppon and Oliveira2018). However, there was no systematic identification of HKGs for accurate RT-qPCR normalization. Alternative approaches were carried out to measure relative expression of ovine gene transcripts (Thurston et al., Reference Thurston, Taylor, Gardner, Sinclair and Young2008; Hosseini et al., Reference Hosseini, Moulavi, Tanhaie-Vash, Asgari, Ghanaei, Abedi-Dorche, Jafarzadeh, Gourabi, Shahverdi, Dizaj, Shirazi and Nasr-Esfahani2016; Masala et al., Reference Masala, Ariu, Bogliolo, Bellu, Ledda and Bebbere2018) but their accuracy remains unknown. Nonetheless, it has become evident across multiple experimental settings that no single internal gene can accurately allow for RT-qPCR data normalization (Chapman and Waldenström, Reference Chapman and Waldenström2015). Rather, a small set of HKGs allows for accurate RT-qPCR normalization (Vandesompele et al., Reference Vandesompele, De Preter, Pattyn, Poppe, Van Roy, De Paepe and Speleman2002; Remans et al., Reference Remans, Smeets, Opdenakker, Mathijsen, Vangronsveld and Cuypers2008; Bustin, Reference Bustin2010; O’Connor et al., Reference O’Connor, Wilmut and Taylor2013; Chapman and Waldenström, Reference Chapman and Waldenström2015).
The study described above found that GAPDH, TBP, and H3F3A were the most stable HKGs. Rather curiously, different reports of HKG validation using oocytes or embryos have found GAPDH both as a stable or an unstable HKG (Goossens et al., Reference Goossens, Van Poucke, Van Soom, Vandesompele, Van Zeveren and Peelman2005; O’Connor et al., Reference O’Connor, Wilmut and Taylor2013; Luchsinger et al., Reference Luchsinger, Arias, Vargas, Paredes, Sánchez and Felmer2014), depending upon the experimental setting. These contrasting results highlighted the risk of relying on a single gene for RT-qPCR normalization without prior validation. The HKGs described here were identified using the GeNorm software. Several validations of HKGs for RT-qPCR in embryos have relied on different software for HKG selection, although the criteria for software eligibility were not described. The choice for GeNorm in this study was based on its greater statistical power (Vandesompele et al., Reference Vandesompele, De Preter, Pattyn, Poppe, Van Roy, De Paepe and Speleman2002; O’Connor et al., Reference O’Connor, Wilmut and Taylor2013). GeNorm pointed to a more accurate RT-qPCR data normalization using four or five HKGs. Although sound, due to the stochastic nature of gene expression during preimplantation development (Wennekamp and Hiiragi, Reference Wennekamp and Hiiragi2012), it does not seem practical to rely on more than three HKGs for RT-qPCR normalization.
ZFX transcript abundance differed when using two or three HKGs. The temporal expression of ZFX was described in ovine embryos without relative expression analysis (Bernardi et al., Reference Bernardi, Cotinot, Payen and Delouis1996; Hosseini et al., Reference Hosseini, Moulavi, Tanhaie-Vash, Asgari, Ghanaei, Abedi-Dorche, Jafarzadeh, Gourabi, Shahverdi, Dizaj, Shirazi and Nasr-Esfahani2016). This stable ZFX transcript abundance could possibly be due to a balance between newly synthesized mRNA after genome activation versus degradation and translation-coupled decay from maternally derived transcript stock.
The DPPA3 gene transcript abundance did not fluctuate during ovine parthenogenetic development. DPPA3 is required for full-term development and plays a role in protecting the maternal genome from active DNA demethylation after fertilization (Payer et al., Reference Payer, Saitou, Barton, Thresher, Dixon, Zahn, Colledge, Carlton, Nakano and Surani2003; Nakamura et al., Reference Nakamura, Arai, Umehara, Masuhara, Kimura, Taniguchi, Sekimoto, Ikawa, Yoneda, Okabe, Tanaka, Shiota and Nakano2007, Reference Nakamura, Liu, Nakashima, Umehara, Inoue, Matoba, Tachibana, Ogura, Shinkai and Nakano2012; Zhao et al., Reference Zhao, Xu, Liu, Cui, Li and Liu2018). Steady DPPA3 mRNA levels were also found during bovine preimplantation development (Bakhtari and Ross, Reference Bakhtari and Ross2014). In contrast, a report using ovine embryos showed a maternal gene expression pattern for DPPA3 (Masala et al., Reference Masala, Ariu, Bogliolo, Bellu, Ledda and Bebbere2018). In turn, the discrepancy between this study and the report by Masala et al. (Reference Masala, Ariu, Bogliolo, Bellu, Ledda and Bebbere2018) is probably due to differences in RT-qPCR normalization or other technical/experimental factor, as the predicted DPPA3 amplicons are nearly identical. The dissection of such discrepancy in DPPA3 gene expression analysis should deserve further experimental investigation.
The ovine orthologue was characterized to prospect evolutionary-driven differences that may explain the variation in transcript abundance due to the low conservation of DPPA3 among mammalian species (Thélie et al., Reference Thélie, Papillier, Pennetier, Perreau, Traverso, Uzbekova, Mermillod, Joly, Humblot and Dalbiès-Tran2007; Bakhtari and Ross, Reference Bakhtari and Ross2014), Ovine and bovine DPPA3 mRNA orthologues differ in the number of polyadenylation sites and regulatory motifs that may ultimately affect transcript turnover (Thélie et al., Reference Thélie, Papillier, Pennetier, Perreau, Traverso, Uzbekova, Mermillod, Joly, Humblot and Dalbiès-Tran2007). However, it remains to be determined how such differences may effect DPPA3 mRNA abundance. In conclusion, GAPDH, TBP, and H3F3A are stable HKGs in ovine parthenogenetic embryos and allow accurate RT-qPCR-based gene expression analysis.
Financial support
We would like to acknowledge the National Council for Scientific and Technological Development (CNPq), Fundação de Amparo a Ciência e Tecnologia de Pernambuco (FACEPE; Grant APQ-1101–5.05/15) and Coordination of Higher Level Personnel (CAPES; Finance Code 001) for financial support for this study and for scholarships/fellowships.
Conflict of interest
No conflict of interest.
Ethical standards
The experiment was evaluated and approved by the Animal Ethics Committee (Comissão de Ética no Uso de Animais – CEUA) at the Rural Federal University of Pernambuco – UFRPE, under the licence number 124/2016.
Supplementary material
To view supplementary material for this article, please visit https://doi.org/10.1017/S0967199420000295