Introduction
Brazil has the third largest herd of horses in the world with ~5.9 million animals, second only to China with 7.9 million and Mexico with 6.2 million. The equine generates about 640 000 direct jobs and if we consider indirect jobs about 3.2 million, according to ESALQ/USP (2006).
The Crioula horse of southern Latin America is a direct descendant of the horses brought to the New World by the Spanish and Portuguese conquistadores during the sixteenth century (Rodero, Delgado and Rodero, Reference Rodero, Delgado and Rodero1992). Many horses escaped or were abandoned, and returned to a wild state. These were Portugese, Barbe and Spanish (particularly Andaluse) horses.
Studies with Uruguayan (Kelly et al., Reference Kelly, Postiglioni, De Andrés, Vega-Plá, Gagliardi, Biagetti and Franco2002) and Argentinian Crioulas (Mirol et al., Reference Mirol, Peral García, Vega-Pla and Dulout2002) using blood group and protein polymorphism variants that are considered to be breed markers of Spanish Pure-bred and Barb horses were detected in the Crioula breed but some microsatellites and protein polymorphisms alleles were found uniquely in the Crioula horse. Argentinean Crioula horses shared two haplotypes with the Peruvian Paso from Argentina, and the commonest haplotype of the Crioula horses is identical to one of the Andalusian horses. Even when there was substantial subdivision between breeds with highly significant Wright's Fixation Index (F ST), the parsimony and distance-based phylogenetic analyses failed to show monophyletic groups and there was no clear relationship in the trees between the South American and any of the other horses analysed. Although this result could be interpreted as mixed ancestry of the South American breeds with respect to the Spanish breeds, it is probably indicating the retention of very ancient maternal lineages in the breeds analysed.
The South American horse breeds form two main groups, the Crioula types (including Brazilian, Argentinean and Uruguayan) and the other Brazilian breeds (Cothran et al., Reference Cothran, Santos, Mazza, Lear and Sereno1998) and the Crioula is most closely related to Iberian Sorraia, Andalusian, Paso Fino and Lusitano breeds. The pairing of the Sorraia with the Argentine Crioula was probably due to the combination of low variability of the Sorraia, small sample size of the Argentine Crioula and the fact that an Argentine Crioula stallion was used in the regeneration of the Sorraia.
According to the Brazilian Association of Crioula Horse Breeders (ABCCC), from 2001 until the end of 2010 there was an increase of 143.7 percent in applications for registration of temporary records, jumping from 10 271 in 2001 to 25 020 in 2010. Based on this growth, the Association estimates that this number could reach 57 502 in the year 2020, an increase of approximately 129.82 percent over 2010. Trade of animals increased 985 percent between 2001 and 2010, rising from $9.2 to $100 million, respectively, and this number could exceed $300 million in the year 2020, according to data from the ABCCC.
According Laat (Reference Laat2001), population aspects of horse herds, especially those related to inbreeding and effective size, present peculiarities since the horse herds are generally small, selection does not have well-defined goals and economic characteristics to evaluate progress, and sports prizes, morphology and associated functionality are not objectively measured. Furthermore, the low uses of reproductive biotechnologies such as artificial insemination, embryo transfer and IVF – which are prohibited by the Association of Crioula breeders, affect population parameters.
Despite its importance, no studies on the level of inbreeding and population structure of the Crioula breed and, therefore, the objective of this study was to analyse the current situation of the breed using population genetics parameters, focusing especially on some aspects of genetic variability and population structure.
Material and methods
The analysis was based on data from the studbook where the population was 341 616 animals that included all registered animals (final and interim) by the Brazilian Association of Crioula Horse Breeders (ABCCC) since its foundation up to 8th April 2011 (154 663 males and 186 843 females). Data were analysed using ENDOG programme to calculate population parameters for the breed. The following parameters were calculated: the pedigree completeness level was computed as the proportion of ancestors known per parental generation (MacCluer et al., Reference Maccluer, Boyce, Dyke, Weitkamp, Pfenning and Parsons1983); The number of equivalent to discrete generations (t) for each individual in a pedigree (Boichard, Maignel and Verrier, Reference Boichard, Maignel and Verrier1997); The inbreeding coefficient (F) (Malécot, Reference Malécot1948); average relatedness coefficient (AR) (Goyache et al., Reference Goyache, Gutiérrez, Fernández, Gomez, Alvarez, Díez and Royo2003; Gutiérrez, Goyache and Cervantes, Reference Gutiérrez, Goyache and Cervantes2009). The probability of gene origin was characterized by computing the following parameters: effective number of founders (f e) (James, Reference James1977) computed from the genetic contribution of founders to the descendant gene pool of the population (Lacy, Reference Lacy1989); effective number of ancestors (f a), defined as the minimum number of ancestors, not necessarily founders, explaining the complete genetic diversity of a population (Boichard, Maignel and Verrier, Reference Boichard, Maignel and Verrier1997); the founder genome equivalents (Ballou and Lacy, Reference Ballou, Lacy, Ballou, Gilpin and Foose1995) obtained by the inverse of twice the average coancestry of the individuals within the population (Caballero and Toro, Reference Caballero and Toro2000); Effective population size (N e) was computed following Gutiérrez, Goyache and Cervantes (Reference Gutiérrez, Goyache and Cervantes2009); F-statistics where a population has a population structure of two levels; one from the individual (I) to the subpopulation (S) and one from the subpopulation to the total (T). F-statistics describe the amount inbreeding-like effects within subpopulations F IS, among subpopulations F ST, and within the entire population F IT. In this case Wright's F-statistics are obtained according to Caballero and Toro (Reference Caballero and Toro2000, Reference Caballero and Toro2002); The within-breed coancestry (f ii ) and the between-breeds coancestry matrix (f ij ) were computed averaging all pairwise coancestry coefficients of the individuals belonging, respectively, to a given breed i or to two different breeds i and j. Following Caballero and Toro (Reference Caballero and Toro2000, Reference Caballero and Toro2002) the between-breeds Nei's minimum distance (Dm) matrix was also computed as Dm = ((f ii + f jj )/2) − f ij where f ii and f jj are the average coancestry within two breeds i and j and f ij the coancestry between two breeds i and j. In the present study, municipalities, farms and sires were considered separate populations; the effective number of founders in an animal's pedigree was calculated using the genetic conservation index, genetic conservation index (GCI; Alderson, Reference Alderson and Alderson1991): GCI = 1/ΣP i 2 where P i is the proportion of genes of founder animal i in the pedigree. Subsets were also analysed using sires with more than 100 offspring (803) giving 163 817 foals, the fathers of these animals (196) giving 53 632 foals. Farms (106) and municipalities with more than 500 horses registered were also investigated.
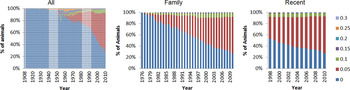
Two further reference populations were created – families of stallions with more than 500 offspring (184 005 animals – FAMILY) and animals registered since 1998 (184 669 animals – RECENT). In the latter two populations 135 449 animals appeared in both. Patterns of inbreeding in the three populations studied (ALL, RECENT, FAMILY). Levels of inbreeding were grouped (0.00, 0.001–0.05 (0.05), 0.051–0.10 (0.10), 0.101–0.15 (0.15), 0.151–0.20 (0.20), 0.201–0.25 (0.25) and >0.25 (0.30).
Results
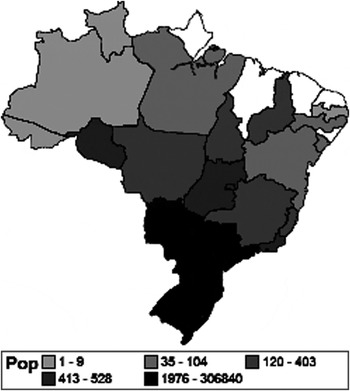
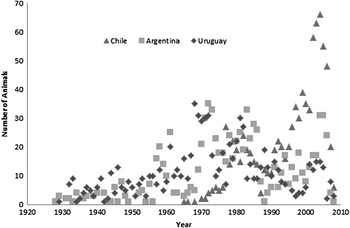
The Crioula horse is present in 23 of the 27 states of the Federative Republic of Brazil (Figure 1). The Crioula horse does not have animals born in states of Alagoas, Maranhão, Rio Grande do Norte and Amapá. The largest producers are the three southern states of the country that together add up to 96.34 percent, and Rio Grande do Sul, the largest producer with 89.85 percent, 3.81 percent in Paraná and Santa Catarina with 2.67 percent of the population total. Horses were also imported from Argentina (866), Chile (868) and Uruguay (852) of which ~80 percent were females. While horses from Argentina and Uruguay have been imported since the start of breed registration, those from Chile have been more recent becoming the most important source of importation (Figure 2).
Geographical distribution of the population (Pop) of Crioula horses in Brazil.

Number of Crioula horses imported per year from Uruguay, Argentina and Chile.

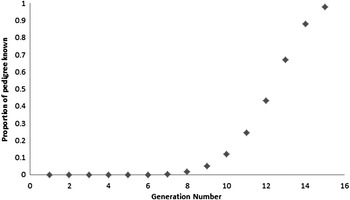
Of all registered animals, 97.98 percent have their pedigrees fully known. The number of known pedigrees has increased over the generations with emphasis on the growth of the ninth generation. In the following, six generations this increased from 4.95 percent of the known pedigrees to 97.98 percent in the current 15th generation (Figure 3).
Percentage of known generation pedigrees of the Crioula horse in Brazil.

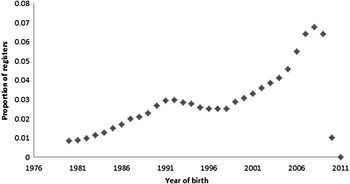
The increase in the number of records per year is evident (Figure 4). Since the 1970s there has been a steady growth in the breed until the mid-1990s, more precisely in 1992. Before 1980, 9.3 percent of all animals were registered. In this year, there was a decrease in the number of records of animals to 1996. From 1996 to 1998 the number of records was almost stable, and from 1999 there was a higher growth than seen in the 1970s and 1980s. From the year 2005, growth has intensified, with an increase in 3042 animals from 2006 to 2007. The numbers of records for the years 2010 and 2011 should be disregarded, since the data were collected in April 2011 and most of the animals born in the spring of 2010 onwards had not been through technical inspection on the date on which the data were gathered.
Percentage of records by year of birth for the Crioula horse in Brazil.

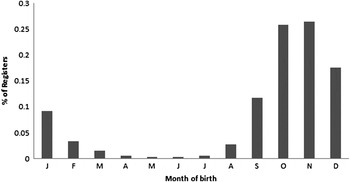
Of the animals recorded by the ABCCC, 54.71 percent are female and 45.29 percent are males, in a total of 341 497 observations. As for the month of birth, 90.71 percent of registered animals are born between September and January, the largest concentration in the months of October and November where we find, respectively, 25.85 and 26.44 percent of births (Figure 5).
Percentage of records by month of birth for the Crioula horse in Brazil.

Farms with the largest number of animals were registered for Estância Nazareth (3930), Cabanha Tupambaé (3114), Cabanha Paineiras (2994), Cabanha St. Angelo (2370) and Estância San Francisco (2252), and these five farms, from a total of 7949, were responsible for 4.5 percent of registered animals. When you consider the 50 largest farms, they, together, represent 19.67 percent of the animals reared in the country, reaching 63 977 for a total of 325 301 animals.
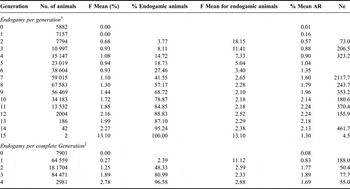
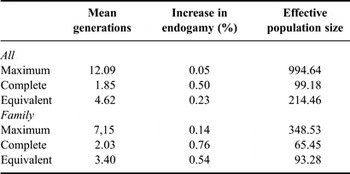
The inbreeding coefficient was calculated at 0.88 percent and the AR was 0.65 percent in the total population (animals born in Brazil and imported). With the increase of generations, an increase in inbreeding was observed (Table 1). This increase is evident from the first generation, and especially observed in the fourth generation full generation. 96.58 percent of the animals which have some degree of inbreeding and inbreeding coefficient in this generation was 2.78 percent. There is an increasing trend up to 100 percent of animals in the 15th generation being inbred, which is not complete since the animals can be registered definitively up to 4 years after birth. The number of generations, complete and equivalent, shows that the breed is expanding (Table 2). Large variations in effective herd size per generation are an indication of animals being imported into the herd (for example, from Uruguay, Chile or Argentina).
Inbreeding (F), average relatedness (AR) and effective population size (Ne) per generation in Brazilian Crioula Horse.

1Maximum number of generations traced.
2Complete generations traced as defined by Gutiérrez, Goyache and Cervantes (Reference Gutiérrez, Goyache and Cervantes2009).
Average number of generations, inbreeding per generation and effective population size for the Brazilian Crioula horse.

The highest level of inbreeding was 0.41 with 6755 animals with a value >0.1. These animals were on average in the seventh generation, but there were animals in the second generation with high levels of inbreeding. Analysing the full herd, 72 (0.02 percent) animals were from crosses between full-sibs, 3047 (0.89 percent) between half-sibs and 1784 (0.52 percent) between parents and offspring.
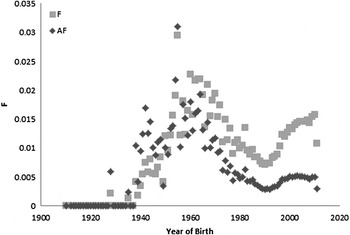
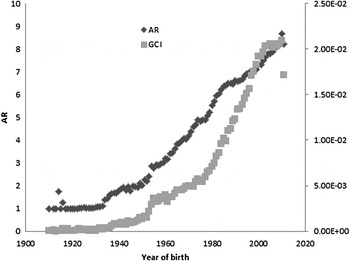
The mean coefficient of individual relatedness showed an increase in population over the years, especially after the1950s, reaching 2.09 percent in animals born in the year 2010 (Figure 6).
Mean individual inbreeding (F) and Average individual change in inbreeding (AF) by year of birth for the Brazilian Crioula horse.

An increase in average individual relatedness was found from the 1940s until 1970, the largest observation in 1955 was 3.11 percent. In recent years, there was an average increase of inbreeding about 0.50 percent (Figure 7).
Genetic conservation index (GCI) and average relatedness (AR) average per year of birth for the Brazilian Crioula horse.

An increase in the average individual coefficient of inbreeding was found in animals born after the 1940s, and in 1955 an average rate of 2.95 percent was seen. After 1970 there was a reduction in the coefficient of average individual inbreeding, and the animals born in the past decade had rates of ~1.50 percent (Figure 7). An increase in the average rate of genetic conservation was seen in animals born after the year 1927 until 2010, which had the highest average GCI, 8.67 percent (Figure 7).
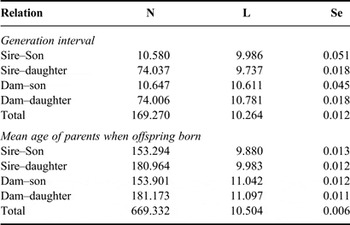
The interval between generations (Table 3) was higher for mares than stallions. This indicates that mares are kept longer for reproduction or start reproductive life later.
Generation interval and the average age of parents when their offspring born for the Brazilian Crioula horse.

N is the number of animals, L is the generation interval and SE is the standard error.
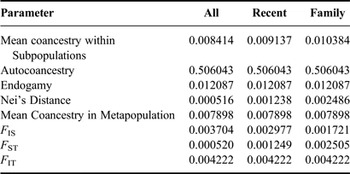
There was no significant genetic differentiation between the states of the federation where animals are raised when considered sub-populations (not shown). Average coancestry within subpopulations was 0.0084 and average coancestry in the metapopulation was 0.0079. Wright parameters show that the inbreeding in the population is greater than expected if matings were performed at random and which occur between the mating subpopulations.
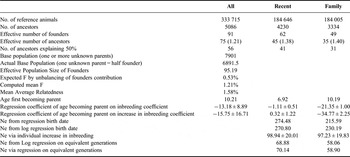
The effective population size of founders was 95.19 animals, expected inbreeding due to an imbalance in the contribution of founders was calculated as 0.53 percent and the mean inbreeding coefficient computed was 1.21 percent for the population of 341 616 animals and the base population (animals with one or more parents unknown) was 7901 (Table 4). The ratio of founders to ancestors was 1.21 (91/75) meaning that in general no specific lineages were created within the Crioula population.
Measures of genetic variation and Wright's statistics (F IS, F ST and F IT) for Brazilian Crioula Horse.

The reference population (both parents known) was smaller than that used for the analysis of founders. The number of ancestors contributing to this population was 5086 for a reference population of 333 715 animals, where 56 ancestors explained 50 percent of the genetic diversity of the breed. Animals 9838, 5174, 18 182, 5178, 5532, 5497, 5208, 5418, 5439 and 5449 had the largest contribution to the herd, reaching ~25 percent of the total genetic variation. The largest number of offspring per stallion was 1428 (sire 63 592) with four animals (9838, 97 059 and 5208) with more than 1000 offspring. Animals 63 592 and 97 059 are offspring of 9838, and eight stallions had more than 500 offspring (forming the second reference population – FAMILY). Animal 9838 had the highest average relatedness. Mare 49 893 had the most offspring (20), but more than 12 292 mares had more than ten offspring, showing the prolificacy and longevity of the breed.
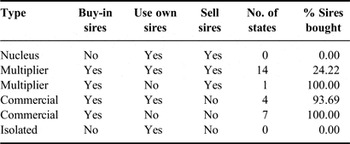
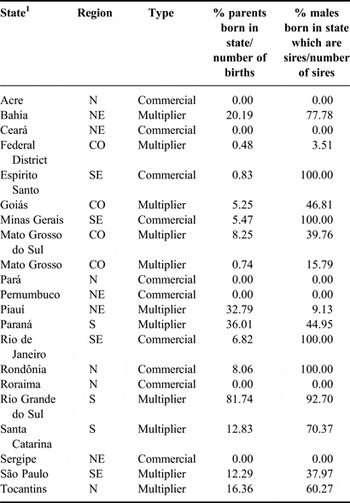
The total population of animals was divided by their state of birth and these subpopulations were analysed for type (Table 5) and structure (Table 6).
Number of herds by type and characteristics for the Brazilian Crioula horse.

Structure of the Brazilian Crioula Horse herds by state.

1Brazilian States; N, North; NE, Northeast; S, South; SE, southeast; CO, Midwest.
Only Commercial and Multiplier herds were seen, with no nuclei or disconnected herds. Most multiplier states (14/15) use their own breeding males, buy in animals and sell sires to other states. As for commercial herds, 63.64 percent (7/11) did not use their own sires for reproduction, while 36.36 percent (4/11) using both purchased and own males for reproduction. Rio Grande do Sul state (RS) had the highest percentage of sires born in the State, which is not surprising as this is the home state for this breed.
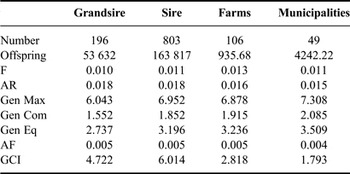
Even when subpopulations are studied, genetic parameters (F, AR, AF) vary little from the mean (Table 7), showing that sires are imported into farms as a general rule. GCI was significantly higher than herd average for those stallions that left more offspring, as expected.
Genetic variation by subpopulation (sires and grandsires with largest number of offspring, farms and municipalities) for the Brazilian Crioula horse.

Genetic conservation index (GCI), average relatedness (AR), mean individual inbreeding (F) and average individual inbreeding (AF), GenMax, maximum number of generations; Gen_Com, common number of generations; Gen_Eq, equivalent number of generations.
More recently animals are becoming parents at a relatively younger age. This may be a reflection of the rapid expansion of the breed and the need for breeding females to reproduce (Table 8). Effective population sizes were similar for different subgroups. This is a reflection of the fact that the major sire families produce a large proportion of the recently born animals, reflected by the large number of animals in common in both groups.
Population data depending on recently born (from 1998) or family of sires with largest offspring numbers (family) in Crioula horses from Brazil.

Ne, effective population size.
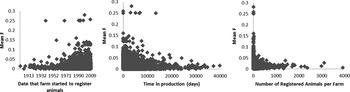
It can be seen that the more recently farms started to register animals the higher mean F (Figure 8, Figure 9). This is also reflected in the longer the farm has been registering animals and the higher the number of animals registered the lower the mean F.
Percentage of animals registered per year depending on inbreeding level on all (ALL) animals registered, those from the major families (FAMILY) and the present generation (RECENT)
Levels of inbreeding (0.00 (0.0), 0.001–0.05 (0.05), 0.051–0.10 (0.10), 0.101–0.15 (0.15), 0.151–0.20 (0.20), 0.201–0.25 (0.25) and greater than 0.25 (0.30).

Mean inbreeding (F) of Crioula Horse depending on the date the farm started to register animals, the period of time the farm registered animals and the number of animals registered per farm.

Discussion
Due to their high commercial value, the horses, especially those used for sports, need have their pedigree known, both for registration and purchase. Confirmation of genealogy is extremely important, not only for ensuring the ascendancy of the animals, but also because a pedigree can reliably enable the buyer to identify the origin of genetic problems in the herd and reduce or eliminate them (Coelho and Oliveira, Reference Coelho and Oliveira2008). The study of genetic variability and population structure in some horse breeds using pedigree analysis, alone or in combination with information such as genetic markers, has grown in recent years (Chiofalo et al., Reference Chiofalo, Portolano, Liottal, Rundo Soteral and Finocchiaro2003; Valera et al., Reference Valera, Molina, Gutiérrez, Gómez and Goyache2005).
The results on the distribution of this breed in Brazil were in accordance with expected, with a high concentration of animals in the southern region, since the breed was developed in Southern Latin America, a region known as South American Pampa (Argentina, Southern Brazil and Uruguay). The increase in the use of the Crioula Horse in southeastern states such as Sao Paulo, as well as in Northern and Northeastern Brazil is also seen. This reflects the expansion and distribution of the breed, where the largest breeder (Estância Nazareth) has only 1.2 percent of the animals, unlike other local breeds, such as the Pantaneiro Horse, where the largest breeder has 7.25 percent of animals recorded.
The amount of information on the Crioula has increased with the number of generations. These data are consistent with those found in studies with other breeds where the most distant generations have less genealogical information, as this may have been lost over the years or were not recorded (Valera et al., Reference Valera, Molina, Gutiérrez, Gómez and Goyache2005). Vicente, Carolino and Gama (Reference Vicente, Carolino and Gama2009), as here, found an increase in complete Lusitano pedigrees over ten generations.
The increase in the number of records per year is evident (Figure 2), mainly due to two factors: (a) partnership between the Breeder's Association and the Rural TV Channel, where the most important competition involving the Crioula, Freio de Ouro (which involves several tests, such as breed standard, gait, barrel racing, separating cattle, lassoing, horse control and obedience), is televised across the country and worldwide over the internet. This channel also televises most of the auctions with these horses, so farmers from distant regions can acquire animals without leaving home; (b) projects developed by the ABCCC, such as Vaquejada Project (A northeastern tradition where horses are used to drive cattle in a confined space.), created to insert Crioula horse in this activity in the northeast. The number of registers in the last two years (2010 and 2011) should be disregarded as the animals are subjected to technical inspection until they are nine months old and most of the animals born in this period had not passed inspection at the time of data collection. The greater number of females compared to males can be explained by fact that some breeders do not register males which do not meet their specifications.
In domestic animals some individuals assume importance in the origin of the breed and its development (Fletcher, Reference Fletcher1945, Reference Fletcher1946; Rhoad and Kleberg, Reference Rhoad and Kleberg1946; Gazder, Reference Gazder1954) as evidenced in this population. This is due to several factors, such as propaganda, success in auction rings and competitions as well as functional and morphological traits.
The concentration of births in the months from September to January is mainly due to the occurrence of marked photoperiod in southern Brazil (Winter, Reference Winter2007). Most mares show anestrus and transitional phases in summer and autumn and, under natural conditions, the transition ends near or after the equinox, in September and October.
The mean coefficient of inbreeding found in Crioula was lower compared to other local breeds. Schurink, Arts and Ducro (Reference Schurink, Arts and Ducro2012) found average inbreeding coefficient of 0.053 while the Crioula horse was found 0.88 percent for the total population (including imported) and 1.21 percent for those born in Brazil. Wolc and Balińska (Reference Wolc and Balińska2010) also found much higher values (5.9, 5.1 and 5.6 percent) on three farms breed Polish Konik. Abrahão et al. (Reference Abrahão, Mota, Oliveira and Madureira2002) found similar levels of inbreeding (0.8 percent) to those found in Crioula when studying inbreeding in Thoroughbred mares reared in Brazil. Low levels of inbreeding found in Crioula in Brazil can be explained by the large population base, large number of founders and ancestors, and the introduction of animals from other countries (Argentina, Uruguay and Chile), introducing different racial strains.
The number of inbred animals found in the full third generation (80.99 percent of the population) was similar to that found by Mota et al. (Reference Mota, Prado and Sobreiro2006) found that 88.0 percent of inbred animals in Mangalarga horses in the period 1936–2003. The results in Crioula show a clear increase in the number of inbred animals, reaching 100 percent at the 15th generation, although there are only two animals in this generation. Inbreeding of 10 percent was estimated for ethnic breeds such as Spanish Purebred (Valera et al., Reference Valera, Molina, Gutiérrez, Gómez and Goyache2005) and Lipizzano (Zechner et al., Reference Zechner, Sölkner, Bodo, Druml, Baumung, Achmann, Marti, Habe and Brem2002), and after the closing of the studbook this parameter has aggravated (Vicente et al., Reference Vicente, Carolino and Gama2009). For Mangalarga inbred animals, the mean coefficient of inbreeding was 5.7 percent, with a maximum of 46.9 percent (Costa et al., Reference Costa, Bergmann, Resende and Fonseca2005), similar to those found by Procópio et al. (Reference Procópio, Bergmann and Costa2003) in the Campolina.
The increase of inbreeding (Boichard, Maignel and Verrier, Reference Boichard, Maignel and Verrier1997) can be used to derive the effective size of a population. However, this method reflects mainly the long-term effects of selection and, furthermore, is very sensitive to incomplete information from a pedigree. An alternative would be additional parameters based on the probability of gene origin, and the effective number of founders and effective number of remaining genomes are commonly used in wild populations, but less common in studies of domestic animals. However, there are several studies in domestic species and different breeds, such as in cattle (Faria et al., Reference Faria, Vercesi Filho, Madalena and Josahkian2002; Vercesi Filho et al., Reference Vercesi Filho, Faria, Madalena and Josahkian2002; Pereira et al., Reference Pereira, Mercadante, Albuquerque and Razook2005; Vozzi et al., Reference Vozzi, Marcondes, Magnabosco, Bezerra and Lôbo2006, Reference Vozzi, Marcondes, Bezerra and Lôbo2007; Hammami et al., Reference Hammami, Croquet, Stoll, Rekik and Gengler2007; Martínez, García, and Gallego, Reference Martínez, García and Gallego2008), in horses (Costa et al., Reference Costa, Bergmann, Resende and Fonseca2005), sheep (Goyache et al., Reference Goyache, Gutiérrez, Fernández, Gomez, Alvarez, Díez and Royo2003), pigs (Toro et al., Reference Toro, Rodrigañez, Silio and Rodriguez2000) and even donkeys (Gutiérrez et al., Reference Gutiérrez, Marmi, Goyache and Jordana2005), based on some sort of pedigree analysis. Ideal levels of inbreeding range from 0.05 (Nicholas, Reference Nicholas, Hill and Mackay1989) to 0.01 (FAO, 2000) per generation, and the Crioula are below these levels.
Moureaux et al. (Reference Moureaux, Verrier, Ricard and Mériaux1996) reported that when studying inbreeding in horse breeds, two groups can be distinguished: a group of international breeds, with values ranging from 0.81 to 2.89 percent, and another group with small population sizes with values ranging from 2.25 to 14.7 percent. The high variation in mean individual levels of inbreeding and inbreeding rate seen here between 1940 and 1970 may have been a reflection of the lack of breeding animals, the difficulty in finding stallions of the breed as well as in moving between farms, since the increase in effective herd size came after 1970 (Figure 3).
The mean coefficient of relatedness (kinship) increased from the start of breed registration until about the year 2003. These results can be explained by selection of animals which showed excellent results in morphological and functional competitions, and therefore many breeders sought to acquire its offspring. Mean coefficient of relatedness provides additional information to explain relations between relatives (Gutiérrez, Goyache and Cervantes, Reference Gutiérrez, Goyache and Cervantes2009). In conservation genetics, knowledge of relatedness is required to optimize conservation strategies. Coancestry relationship is expressed relative to the base population in which all alleles are not defined as being identical by descent, so that the population coancestry base is zero by definition (Falconer and Mackay, Reference Falconer and Mackay1996; and Lynch Walsh, Reference Lynch and Walsh1998). Kinship average here was low compared to other breeds of horse (Zechner et al., Reference Zechner, Sölkner, Bodo, Druml, Baumung, Achmann, Marti, Habe and Brem2002; Valera et al., Reference Valera, Molina, Gutiérrez, Gómez and Goyache2005). Valera et al. (Reference Valera, Molina, Gutiérrez, Gómez and Goyache2005) found average values of inbreeding and AR of the Andalusian horse population were, respectively 8.48 and 12.25 percent, while Cervantes et al. (Reference Cervantes, Molina, Goyache, Gutiérrez and Valera2008) found inbreeding average of 7 percent to Spanish Arabian.
The average individual inbreeding and variation in inbreeding increased from the mid-1930s to mid-1970s, and remained relatively constant thereafter. This can be explained by an intense exchange of animals between Brazil, Argentina, Uruguay, and especially Chile, where different strains were incorporated into the local population after the 1970s.
When comparing inbreeding in the three populations studied (ALL, FAMILY and RECENT), a clear increase in the percentage of animals with relatively low levels of inbreeding (0.05). The percentage of animals with F > 0.05 has not grown since the late 1990s and although an increase in inbreeding (F > 0.1) was seen in the ALL population in the 1940s to 1980, this has largely disappeared. Higher levels of inbreeding are not seen in RECENT or FAMILY. The percentage of animals with no inbreeding has steadily decreased in all populations and should increase with the closure of the herd book.
In Andalusian horses, Valera et al. (Reference Valera, Molina, Gutiérrez, Gómez and Goyache2005) found 39.6 effective founders and 27 ancestors, with only six animals responsible for 50 percent of genetic variability in the breed. The situation of Crioula is better, with nearly 95 founders, but this is lower than for Pantaneira (McManus et al. Reference McManus, Santos, Dallago, Paiva, Saraiva, Braccini Neto, Marques and Abreu2013), perhaps due to rapid expansion of the breed in recent years. The small number of founder animals highlights the need for monitoring of inbreeding of the herd studied, control of breeding and introduction of animals that have no direct relationship with the principal ancestors identified in this study. Alderson (Reference Alderson and Alderson1991) used the GCI to calculate an effective number of founders in the pedigree of an animal. The higher the value GCI better it is for use in conservation of a breed. The GCI can be used both by individual breeders as an aid in selecting breeding stock, or within a breed to formulate a comprehensive improvement program. However, the index has limitations, as it is not representative of any concentration of breeding animals for non-founders in subsequent generations and cannot be used without pedigree records (Alderson, Reference Alderson and Alderson1991).
The interval between generations found in Crioula was higher when compared with other breeds such as Costa (Reference Costa2002) and Gonçalves (Reference Gonçalves2010), who evaluated animals Mangalarga Marchador found generation interval of 8.9 and 8.98 years, respectively. This may be due to the prohibition of use of reproductive biotechnologies until 2011, as well as the large number of morphological and functional competitions in which these horses compete, means that these horses begin reproductive life at a later age. As natural breeding is still used, many mares exposed to the stallion do not impregnate. Vicente, Carolino and Gama (Reference Vicente, Carolino and Gama2009) also found a high generation interval for the Lusitano breed (10.4 years: males 11.2 and females 9.6 years), also possibly due to use after the end of their sporting career. McManus (Reference McManus2013) found lower intervals between generations in the Pantaneiro horse and considered this was because this breed is used on-farm animals instead of sports and therefore enter reproduction earlier.
The use of artificial insemination and embryo transfer are beginning to become more widely used in horse populations (2011 in Crioula) but less frequently than in other farm animals (Laat, Reference Laat2001). The population aspects of horses, especially those related to inbreeding and effective size therefore have an individual character (Costa et al., Reference Costa, Bergmann, Resende and Fonseca2005) and continued monitoring is necessary to avoid future problems.
Vinocur et al. (Reference Vinocur, Brass, Rubin and Silva2003) determined the allele frequencies of seven blood group systems and eight protein systems in six herds of Crioula horses raised in Rio Grande do Sul of State. The herds presented a significant component due to isolation (F ST = 0.0866, p < 0.01). They found high values for average heterozygosity (0.4631). When all herds were considered in the analysis, the inbreeding level (F IS) was zero, in line with seen here where values near zero indicate that levels of genetic variability of the flock are high, since these values indicate an excess of heterozygous animals, both within and paternal lineages (subpopulations) and for the population as a whole (metapopulation). For the F ST index, the value calculated was 0.000, demonstrating that there is no differentiation between the parental strains with the formation of subpopulations. The Crioula is not at risk status (FAO 1998; Database http://dad.fao.org DAD-IS) as opposed to other breeds of naturalized horses (Luís et al., Reference Luís, Cothran, Oom and Bailey2005). The integration of herdbooks from other countries with Crioula horses used for crossing with the Brazilian Crioula (such as Uruguay, Argentina and Chile) could help to identify some genetic bottlenecks that may exist but were not seen here.
The fact that the smaller, younger farms have higher levels of inbreeding may reflect a policy of the larger farmers to import stallions or sell off inbred animals to those starting up in the business. It may also reflect a lack of breeding policy by the smaller farmers who may have a single stallion. This is also from the case seen with some pig breeds in the USA (Welsh et al., Reference Welsh, Stewart and Schwab2010) but to a lesser extent.
Conclusion
The indices obtained from the genetic data of genealogical record of the Crioula Breed show that in general inbreeding is under control in the total population and the effective population size is not at a critical level. Recent decrease in generation intervals may be a reflection of the rapid expansion of the breed and the need for mares for reproduction.
Acknowledgements
Thanks are due to the Breeder's Association for the Crioula Horse, INCT – Pecuária (CNPq, FAPEMIG, MCT) and CAPES for scholarships.
Statement of interest
No conflicting interests were identified.