Introduction
The Military Macaw Ara militaris, Linnaeus 1766 has the northernmost distribution of all macaws (Forshaw Reference Forshaw1989, BirdLife International 2014), with three recognized subspecies: (Ara militaris bolivianus, Reichenow 1908), (Ara militaris, Linnaeus 1766), and (Ara militaris mexicanus, Ridgway 1915) (Forshaw Reference Forshaw1989, Howell and Webb Reference Howell and Webb1995). It is the most studied Psittacidae species in Mexico with more than 60 publications and reports, but to date there has been no nationwide conservation assessment of the species (Avilés-Ramos Reference Avilés-Ramos2016).
The historical distribution of the species in Mexico included the Pacific slope from northern Sonora to coastal Chiapas, and the Atlantic slope from Nuevo León to Oaxaca (Álvarez del Toro Reference Álvarez del Toro1952, Gardner Reference Gardner1972, Binford Reference Binford1989, Russell and Monson Reference Russell and Monson1998). The known populations are scattered across the Sierra Madre Occidental from Sonora to Michoacan, west Guerrero, and across the Sierra Madre Oriental from eastern Nuevo León to north-west Querétaro, and north-western Oaxaca (Bonilla-Ruz et al. Reference Bonilla-Ruz, Reyes-Macedo and García2007b, Monterrubio-Rico et al. Reference Monterrubio-Rico, Charre-Medellín, Pacheco-Figueroa, Arriaga-Weiss, Valdez-Leal, Cancino-Murillo, Escalona-Segura, Bonilla-Ruz and Rubio-Rocha2016). The species is listed as endangered in Mexico, is listed in Appendix I of CITES and is considered ‘Vulnerable’ by IUCN (SEMARNAT 2010, BirdLife International 2019).
During the last decade, several ecological niche models were generated for the species in Mexico (Ríos-Muñoz and Navarro-Sigüenza Reference Ríos-Muñoz and Navarro-Sigüenza2009, Marín-Togo et al. Reference Marín-Togo, Monterrubio-Rico, Renton, Rubio-Rocha, Macías-Caballero, Ortega-Rodríguez and Cancino-Murillo2012, Rivera-Ortíz et al. Reference Rivera-Ortíz, Oyama, Ríos-Muñoz, Solórzano, Navarro-Sigüenza and Del Coro Arizmendi2013, Monterrubio-Rico et al. Reference Monterrubio-Rico, Charre-Medellín, Pacheco-Figueroa, Arriaga-Weiss, Valdez-Leal, Cancino-Murillo, Escalona-Segura, Bonilla-Ruz and Rubio-Rocha2016). These studies suggested that habitat loss within the historical distribution was from 29% to 43%, likely due to poaching and forest loss (Snyder et al. Reference Snyder, Mcgowan, Gilardi and Grajal2000). This range contraction was assumed to be the most solid evidence of the species’ decline (Snyder et al. Reference Snyder, Mcgowan, Gilardi and Grajal2000, BirdLife International 2014).
Preliminary findings indicated six breaks in the genetic structure of the species in Mexico associated with a possible fragmentation of the range (Rivera-Ortíz et al. Reference Rivera-Ortíz, Solórzano, Arizmendi, Dávila-Aranda and Oyama2017). The main break separates macaws from eastern and western Mexico. The other four breaks are less distinct, but they indicate divisions between the northern and southern Pacific slopes, and northern and southern Atlantic slopes, which could become genetic conservation units. The species’ vulnerability is also evidenced by an analysis of genetic diversity, revealing the small effective population size of Ara militaris, indicating genetic separation between the Central Plateau and the Trans-Mexican Volcanic Belt (Rivera-Ortíz et al. Reference Rivera-Ortíz, Solórzano, Arizmendi, Dávila-Aranda and Oyama2017).
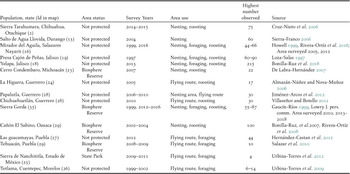
The global population size is uncertain, with recent estimates ranging from a high of 10,000–19,999 to a recent total of 2,000–7,000 individuals, with no indication of how these correspond to each subspecies, subpopulation, or country (BirdLife International 2019). South American populations are patchily distributed with less than 50 individuals locally from Argentina to Venezuela and Colombia and the highest abundances estimated for Bolivia and Colombia (Juárez et al. Reference Juárez, Marateo, Grilli, Pagano, Rumi and Silva-Croome2012). In Mexico, the viability of this species remains uncertain, as there is no comprehensive national-level species assessment. Published estimates indicate a series of isolated populations ranging from four macaws in the Sierra de Nanchititla to 215 at Yelapa in the central western Pacific, (Bonilla-Ruz et al. Reference Bonilla-Ruz, Reyes-Macedo and García2007b, Rivera-Ortíz et al. Reference Rivera-Ortíz, Contreras-González, Soberanes-González, Valiente-Banuet and Arizmendi2008, Jiménez-Arcos et al. Reference Jiménez-Arcos, Santa Cruz-Padilla, Escalona-López, Del Coro Arizmendi and Vázquez2012, Urbina-Torres et al. Reference Urbina-Torres, Monroy-Vilchis, González-Martínez, Amador-Solís and Celis-Murillo2012, Villaseñor and Botello Reference Villaseñor and Botello2012, Bonilla-Ruz et al. Reference Bonilla-Ruz, Cinta-Magallón, Monterrubio-Rico and Avilés-Ramos2018).
In this article we provide a nationwide assessment that combines 10 years of field survey efforts and monitoring programmes by academic institutions, biosphere reserve personnel, non-governmental organizations, and community partners (Monterrubio-Rico Reference Monterrubio-Rico2013, Rubio-Rocha Reference Rubio-Rocha2014). The specific objectives were to 1) analyze the geographical distribution of the macaw groups to delineate the number of populations in Mexico; 2) to determine the number of individuals per population in four geographic regions of Mexico to provide baseline information for future surveys; 3) examine trends in population size for populations with multiple surveys over time; 4) examine suitable habitat availability and climatic parameters for each macaw population; 5) evaluate the threat status of the species at the national level using IUCN criteria (BirdLife International 2014, IUCN Standards and Petitions Subcommittee 2017).
Methods
Field surveys
A first round of nationwide field surveys was conducted from 2004 to 2010, including the compilation and analysis of historical records from the literature and unpublished records from the Comisión Nacional para el Conocimiento y Uso de la Biodiversidad (CONABIO) as a part of a project to assess the Psittacidae distribution in Mexico (Ridgely Reference Ridgely and Pasquier1981, Villaseñor-Gómez Reference Villaseñor-Gómez1988, Forshaw Reference Forshaw1989, Howell and Webb Reference Howell and Webb1995, Howell Reference Howell1999, Marín-Togo et al. Reference Marín-Togo, Monterrubio-Rico, Renton, Rubio-Rocha, Macías-Caballero, Ortega-Rodríguez and Cancino-Murillo2012, Monterrubio-Rico et al. Reference Monterrubio-Rico, Charre-Medellín, Pacheco-Figueroa, Arriaga-Weiss, Valdez-Leal, Cancino-Murillo, Escalona-Segura, Bonilla-Ruz and Rubio-Rocha2016). A second period of field surveys, focused on evaluating abundance, could not replicate the first-round efforts (2004–2010) due to safety concerns and limited funds, so it focused on counts in areas with confirmed macaw activity on the Pacific coast (2010–2015), and on the Gulf coast (2012–2015). We excluded areas with ongoing monitoring and recent published abundance estimates, such as the Tehuacan-Cuicatlán (Bonilla-Ruz et al. Reference Bonilla-Ruz, Reyes-Macedo and Cruz2007a). Nevertheless, we resurveyed areas for which we had abundance information from before the year 2000, such as the Sótano del Barro in Querétaro (Gaucín-Ríos Reference Gaucín-Ríos1999), and Presa Cajón de Peñas in Jalisco (Carreón-Arroyo Reference Carreón–Arroyo1997).
Most surveys occurred before and during the nesting season, usually in the dry season (December to May in Oaxaca, April to August in Sinaloa, November to March in Jalisco, May to July in Queretaro) for each region, where the localities are accessible by road and macaw activity concentrated near the nest or roost sites. When funds were available, greater survey effort was invested in areas with large Military Macaw groups (two counts per month from October to March as in Yelapa) by local research groups where the macaws remain in the area year-round (Bonilla-Ruz et al. Reference Bonilla-Ruz, Cinta-Magallón, Monterrubio-Rico and Avilés-Ramos2018), or five monthly counts during the entire year from 2013 to 2018 in Sierra Gorda Biosphere Reserve monitoring programme (J. Lowry pers. comm.). A reduced number of surveys (five or less) were conducted for small flocks or areas located within a larger population perimeter of 15 km. However, each area was surveyed in at least two different years between 2010 and 2016. For each site, the exact point count location sometimes varied due to security constraints or social conflicts.
Military Macaws occur at low local abundance in social groups and perform daily long-distance movements (Bonilla-Ruz et al. Reference Bonilla-Ruz, Reyes-Macedo and Cruz2007a). They also occur in areas with very rugged topography as the Upper Balsas Basin (Monterrubio-Rico et al. Reference Monterrubio-Rico, Labra-Hernández, Ortega-Rodríguez and Villaseñor-Gómez2011, Monterrubio-Rico et al. Reference Monterrubio-Rico, Charre-Medellín, Pacheco-Figueroa, Arriaga-Weiss, Valdez-Leal, Cancino-Murillo, Escalona-Segura, Bonilla-Ruz and Rubio-Rocha2016). As a result, we were unable to use the Distance survey method, which is best suited to more common species, regularly distributed in the landscape, in relatively flat areas (Marsden and Pilgrim Reference Marsden and Pilgrim2003, Berkunsky et al. Reference Berkunsky, Daniele, Kacoliris, Díaz-Luque, Silva Frias, Aramburu and Gilardi2014). Instead, we conducted our surveys using fixed elevated observation points (Howell Reference Howell1999, Bibby et al. Reference Bibby, Burgess, Hill and Mustoe2000, Snyder et al. Reference Snyder, Mcgowan, Gilardi and Grajal2000, Marsden and Pilgrim Reference Marsden and Pilgrim2003).
To determine where to conduct the counts from the best possible unobstructed elevated sites, we requested support from rural inhabitants and authorities to locate areas with intensive macaw activity and safe observation areas. We also asked about the diurnal and seasonal movements and presence in the area.
Counts were initiated at sunrise and lasted for three hours. The sites presented good visibility and were adjacent to nesting, roosting, foraging, and/or regular flight routes, detection distances ranged from 300 to 400 m (Bonilla-Ruz et al. Reference Bonilla-Ruz, Reyes-Macedo and Cruz2007a, Rivera-Ortíz et al. Reference Rivera-Ortíz, Contreras-González, Soberanes-González, Valiente-Banuet and Arizmendi2008, Reference Rivera-Ortíz, Oyama, Villar-Rodríguez, Contreras-González and Arizmendi2016, Jiménez-Arcos et al. Reference Jiménez-Arcos, Santa Cruz-Padilla, Escalona-López, Del Coro Arizmendi and Vázquez2012, Bonilla-Ruz et al. Reference Bonilla-Ruz, Monterrubio-Rico, Avilés-Ramos and Cinta-Magallon2014). Time, date, weather, number of individuals, and activity such as perching, courtship, flying, feeding, were recorded for each sighting (Marsden Reference Marsden1999, Bibby et al. Reference Bibby, Burgess, Hill and Mustoe2000, Snyder et al. Reference Snyder, Mcgowan, Gilardi and Grajal2000). When possible, we also recorded with video in main flyways and/or colonial roosting areas. In secure areas, additional evening counts were conducted at sites where the birds congregated as in Jaumave, Tamaulipas, where macaws forage on nut trees (Eisermann Reference Eisermann2003, Cougill and Marsden Reference Cougill and Marsden2004, Vaughan et al. Reference Vaughan, Nemeth, Cary and Temple2005, Bonilla-Ruz et al. Reference Bonilla-Ruz, Reyes-Macedo and García2007b, Matuzak and Brightsmith Reference Matuzak and Brightsmith2007).
Potential distribution
The baseline distribution for the species used for the study was the Maxent distribution model generated during the assessment for the family Psittacidae in Mexico (Phillips et al. Reference Phillips, Anderson and Schapire2006, Monterrubio-Rico et al. Reference Monterrubio-Rico, Charre-Medellín, Pacheco-Figueroa, Arriaga-Weiss, Valdez-Leal, Cancino-Murillo, Escalona-Segura, Bonilla-Ruz and Rubio-Rocha2016). The map originated from the model incorporating the locations from 2000–2015 survey data. Records available in the Global Biodiversity Information Facility (GBIF) obtained after 2016 were analyzed to detect unnoticed localities (differing from our occupancy areas) or unusual numbers of macaws in the context of the distribution model and our survey results (Table S1 in the online supplementary material).
Regional division of the range
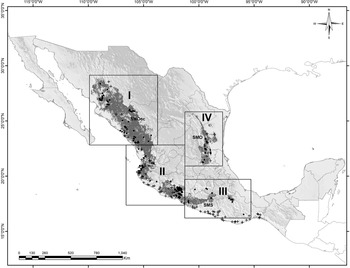
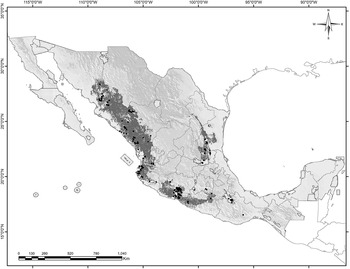
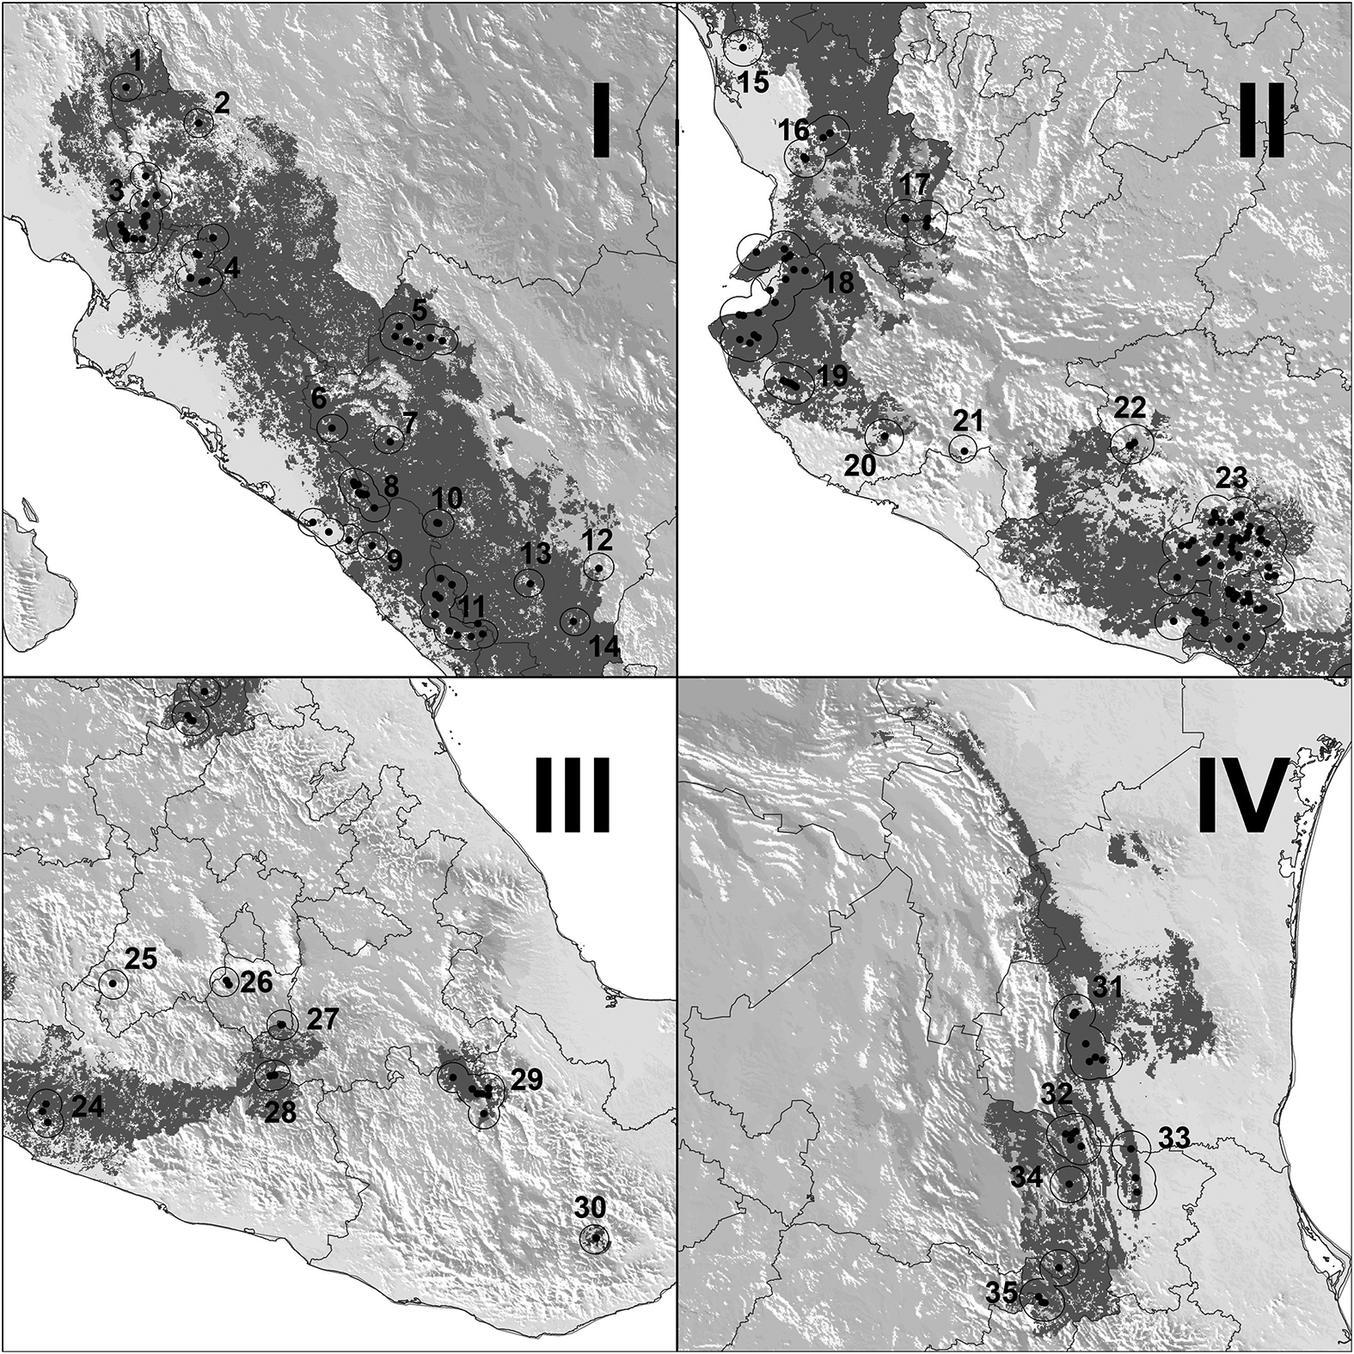
The range of the Military Macaw is usually considered to consist of two parts: the Pacific slope and the Atlantic slope (Howell and Webb Reference Howell and Webb1995). However, the Pacific slope area covers a broad array of ecological regions differing in biotic, climatic, and geomorphological characteristics. Although the distribution model for the Pacific indicates continuity of suitable conditions (Figures 1-2), genetic analysis suggests there are meaningful divisions in the range on both slopes (Rivera-Ortíz et al. Reference Rivera-Ortíz, Solórzano, Arizmendi, Dávila-Aranda and Oyama2017). For practical reasons, we analyze the Pacific slope range of the species in three separate conservation regions (North, Central and Upper Balsas Basin).
Distribution of the Military Macaw in Mexico. The potential distribution of Military Macaw is shown in grey. Presence (points) and absence (cross) points are shown as compiled by the authors. The range is divided in to four main regions: I Northern Pacific, II Central Pacific, III Upper Balsas Basin, and IV Gulf of Mexico. SMOcc= Sierra Madrer Occidental; SMO= Sierra Madre Oriental; and SMS= Sierra Madre del Sur.

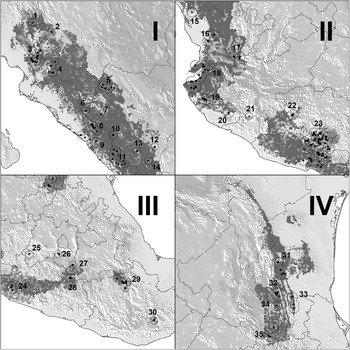
Regional level ranges of the Military Macaw in Mexico. The presence points are shown with 15 km buffers for each geographic region: I. Northern Pacific, II Central Pacific, III Upper Balsas Basin, and IV Gulf of Mexico. See figure 1 for the geographic location of each region.
Areas of occupancy
We have no way of knowing if the Military Macaw groups recorded in this study are reproductively isolated or not, so population limits were determined by the distance between occupied locations. Seasonal movements of Military Macaws in Mexico may be up to 150 km, but daily movements of Military Macaws in Mexico are normally <10 km (Bonilla-Ruz et al. Reference Bonilla-Ruz, Reyes-Macedo and Cruz2007a, Lowry and Pérez-Elissetche Reference Lowry and Pérez-Elissetche2016). Although not always roosting or nesting together, neighbouring macaws congregate for daily foraging (Bonilla-Ruz et al. Reference Bonilla-Ruz, Monterrubio-Rico, Avilés-Ramos and Cinta-Magallon2014) and we assume that groups separated by <15 km are very likely in regular contact. As a result, we established the geographical limits of each population by applying a 15km buffer around each site where we recorded the species. Locations with overlapping 15km buffers were considered part of the same population and the occupancy area for each population was defined as the area covered by the combined area of all overlapping buffers.
Dispersion among localities
Distances between neighbouring areas were measured using a Geographic Information System (GIS). The amount of forest was estimated using a digital vegetation cover map “Series IV” from the National Institute of Geography and Informatics (INEGI 2010). A nearest neighbor analysis using “Euclidian distances” was implemented to examine the spatial patterns of dispersion, testing the hypothesis for random, uniform, or clumped dispersion using the “Distance matrix” in QGIS 2.18.13 software (QGIS Development Team 2016). To evaluate the degree of habitat and macaw protection in officially designated natural protected areas, we first examined federal level protected areas, such as Biosphere Reserves or Flora and Fauna Protection Areas (CONANP 2019), followed by state level protected areas, as long as evidence of macaw presence and area polygons were available.
Based on the IUCN geographic criteria (BirdLife International 2014), we considered the distribution to include four regions; Northern Pacific (Sierra Madre Occidental), Central Pacific (Sierra Madre del Sur-Central Volcanic Belt), the Upper Balsas Basin (Balsas basin) and Gulf of México for the Sierra Madre Oriental distribution (Figure 1).
Abundance
To estimate the population size for the species in Mexico we used our count data to estimate minimum and maximum population sizes. The minimum population estimate was calculated by determining the single largest simultaneous count for each population (as defined above) even when this population included multiple sites a similar approach as performed by Tobias and Brightsmith (Reference Tobias and Brightsmith2007). The maximum population size was estimated by summing the maximum count for each site (whether or not that site was within 15 km of other sites and part of a larger population).
Relative abundance parameters were obtained for each population including the average flock size in each locality, average abundance (average of the maximum counts for each survey at each site), and encounter rate (number of macaws per survey hour). We also calculated the “apparent density,” (maximum number of macaws/population area), because macaw numbers “vary dynamically making any density estimate temporal” (Newton Reference Newton1998). Relative abundance was not calculated for the Upper Balsas Basin region populations as all the results are available from published sources and differ in survey procedures.
Assessment of populations using IUCN criteria
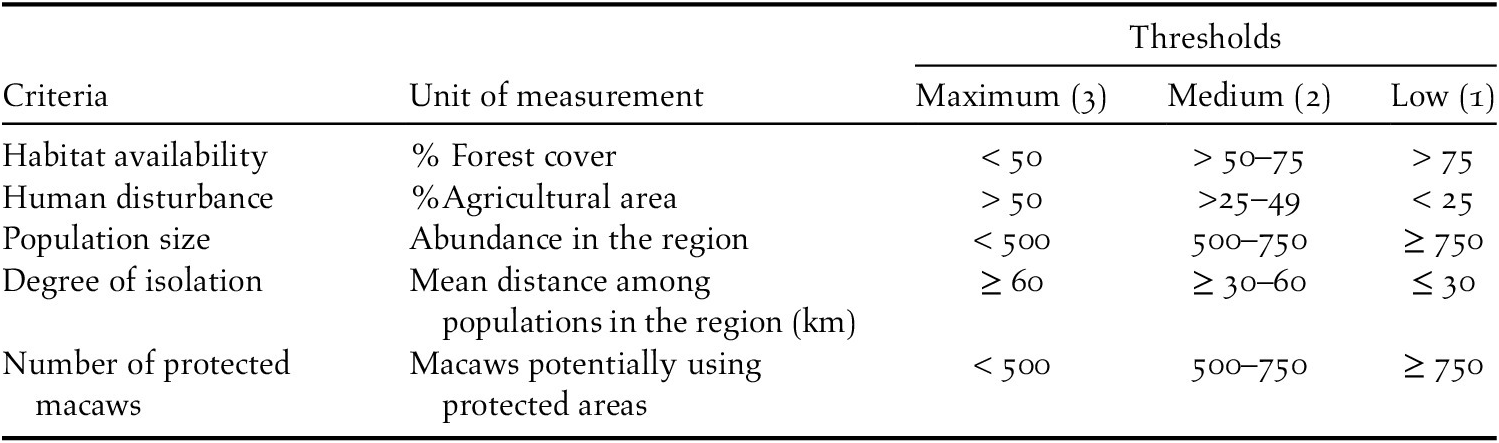
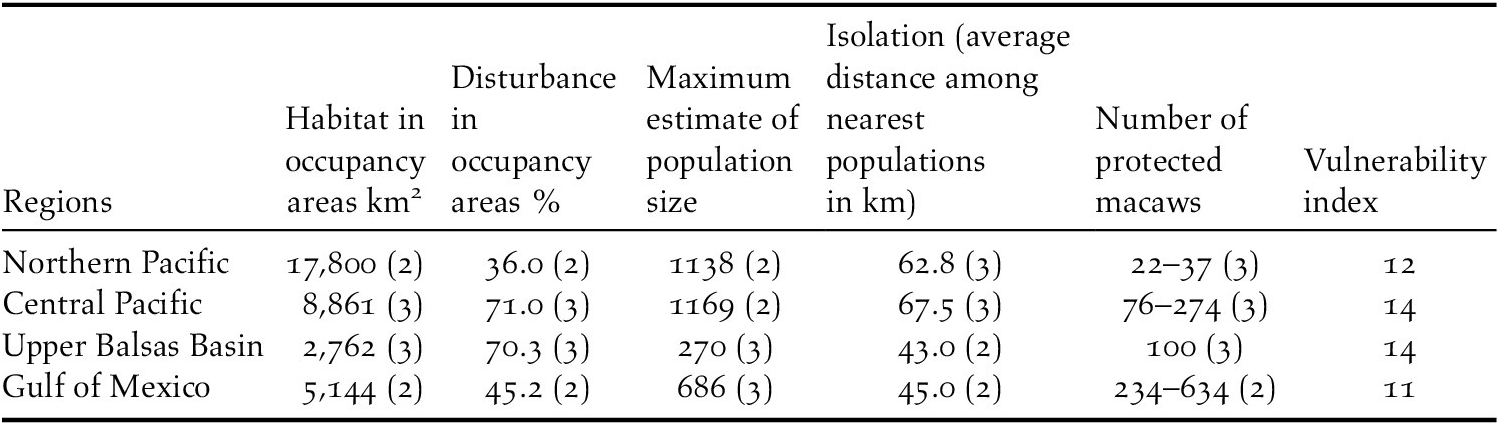
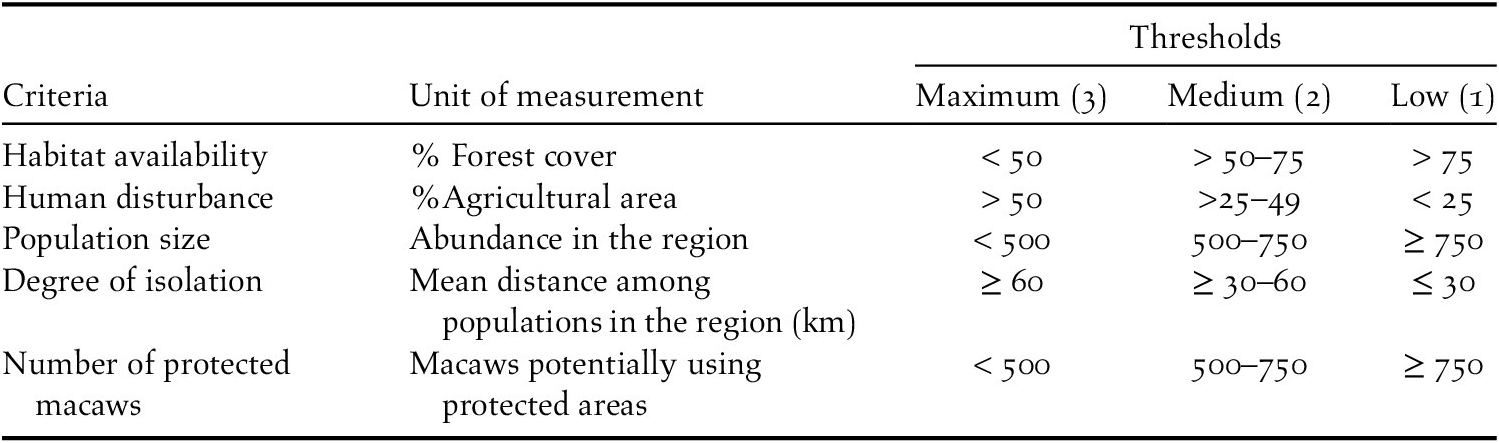
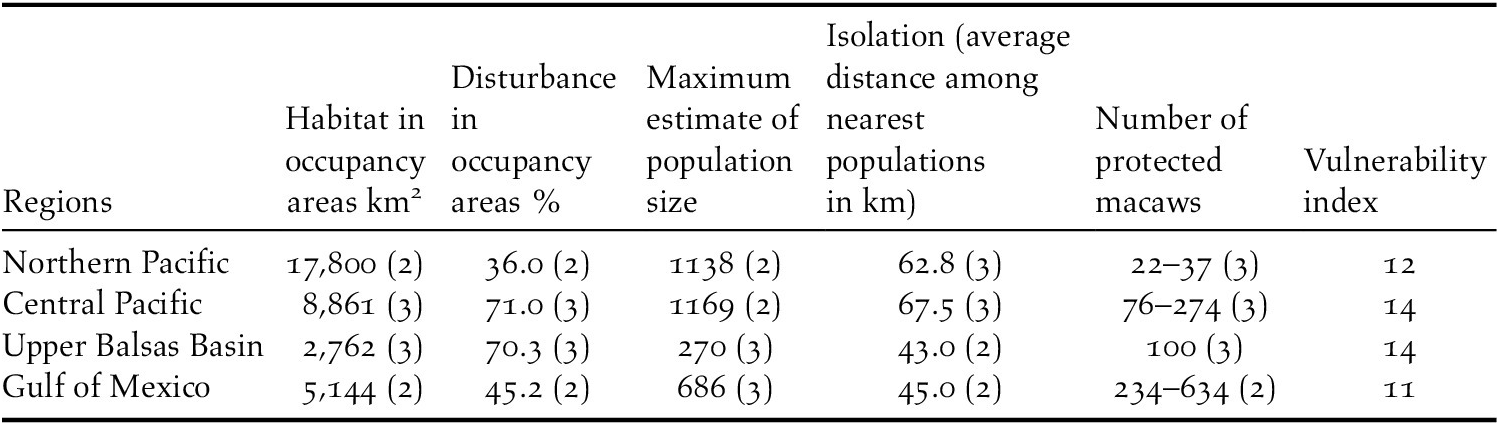
We assessed the status of populations independently for each of the four conservation regions in Mexico using five key IUCN criteria (IUCN Standards and Petitions Subcommittee 2017): habitat availability (primary forest cover in the areas of occupancy), human disturbance (agricultural area in the areas of occupancy), population size (measured as the macaw abundance of occupancy areas in a region), degree of isolation among macaw populations (mean distance among populations), and population protection (the percentage of the total number of macaws occurring in protected areas). The status was also defined as a vulnerability index, scored on a scale of 1 to 3 according to the levels of these criteria presented in Table 1. Each region could potentially have a maximum score of 15; a higher number implies higher vulnerability.
Criteria to assess the vulnerability of the species by data from the occupancy areas. A higher cumulative score obtained means a higher risk for the species (vulnerability index).
Climatic profile of the Military Macaw populations at regional level
To determine the range of climatic conditions used by Military Macaws in each region, we calculated the average and standard deviation for mean annual temperature and mean annual precipitation for each site within each region. Data for each site were from WorldClim (Hijmans et al. Reference Hijmans, Cameron, Parra, Jones and Jarvis2005).
Statistical analysis
We evaluated the correlations between macaw abundance in each of the 32 occupancy areas and primary forest cover, distance to nearest population, encounter rate, and average flock size with Pearson correlation coefficients and non-experimental linear and multiple regression analysis. For the multiple regression model, the dependent variable was the maximum abundance estimate for each occupancy area, and the independent variables were forest cover, distance to nearest occupancy area, average abundance in the population, flock size, and encounter rate. Statistical analyses were conducted using PROC CORR and PROC REG in the SAS software platform (Cody and Smith Reference Cody and Smith1991). The data are presented as mean ± standard deviation unless otherwise noted and alpha level was 0.05 (Cody and Smith Reference Cody and Smith1991).
Results
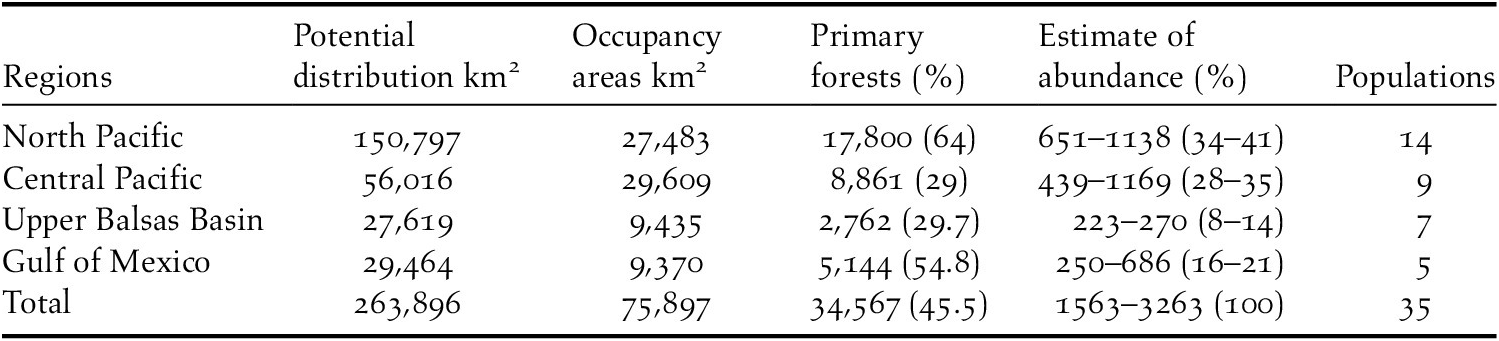
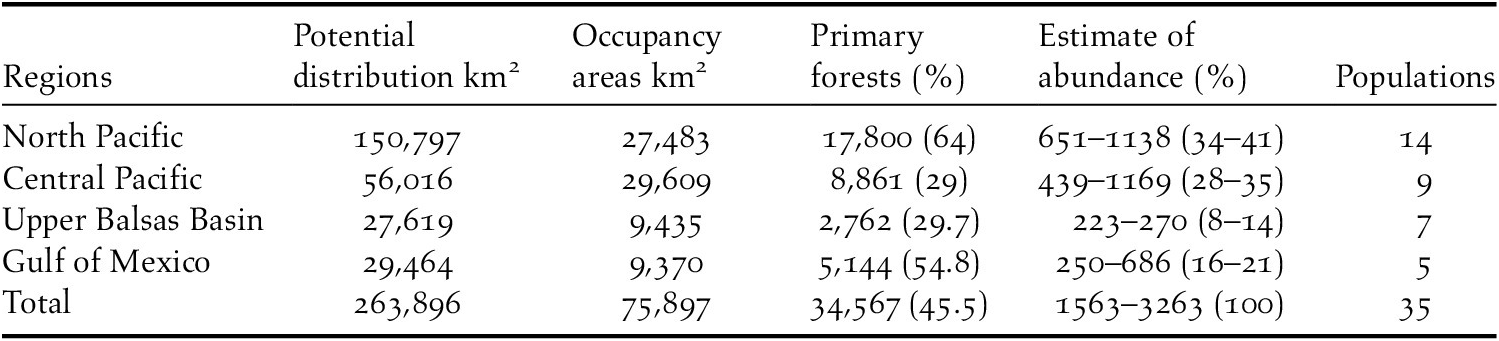
The Military Macaw was recorded in 203 localities grouped into 35 populations across the four regions in Mexico in which the species occurs (Table 2; Figures 1-2). The species is still found along the Sierra Madre Occidental, the Sierra Madre Oriental, and the central and northwest of the Sierra Madre del Sur (Figures 1-2). Macaws occurred in 54 municipalities in 16 states (Table S2). Unfortunately, extirpation of the species was confirmed from coastal areas of Chiapas to Sinaloa, except for the northern Jalisco coast around Bahia de Banderas (Monterrubio-Rico et al. Reference Monterrubio-Rico, Labra-Hernández, Ortega-Rodríguez and Villaseñor-Gómez2011, Marín-Togo et al. Reference Marín-Togo, Monterrubio-Rico, Renton, Rubio-Rocha, Macías-Caballero, Ortega-Rodríguez and Cancino-Murillo2012).
Potential distribution (obtained by the ecological niche model), extent of occupancy areas (area defined for each population by applying a 15 km buffer around sets of neighboring localities), forest cover (forest amount in occupancy areas), and estimated abundance interval by region (minimum and maximum estimates obtained in the counts for each population).
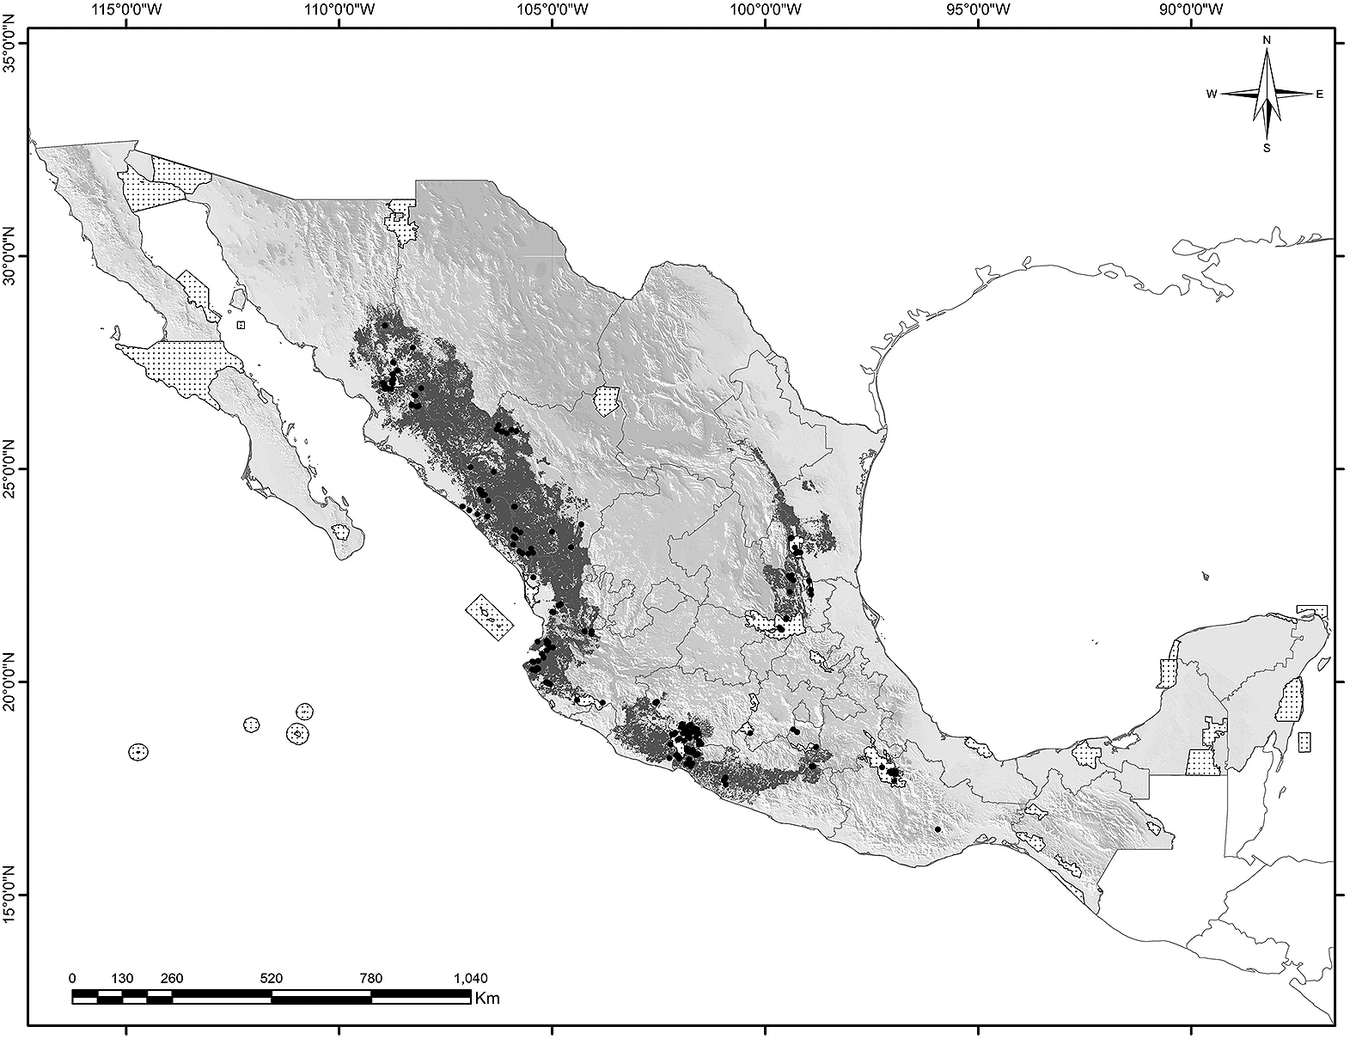
The combined extent of occurrence was 75,899 km2, only 29% of the 263,919 km2 area containing suitable climatic conditions for the species according to the recent niche models (Monterrubio-Rico et al. Reference Monterrubio-Rico, Charre-Medellín, Pacheco-Figueroa, Arriaga-Weiss, Valdez-Leal, Cancino-Murillo, Escalona-Segura, Bonilla-Ruz and Rubio-Rocha2016). Forest constitutes an even smaller area, representing 13% (34,567 km2) of the suitable climatic range. The average elevation of the species localities was 743 ± 588 m (n = 203), with 30% of localities situated in the 501–1,000 m elevation band, 27% in the 200–500 m band, 22% in 0–200 m, and 21% ≥1,500 m. The locality with the highest elevation was Cerro Prieto, Durango, at 3,011 m. The lowest elevation was 14 m, in Las Palmas near Puerto Vallarta, Jalisco. Macaw populations overlapped five Federal Biosphere Reserves, one Flora and Fauna Protected Area, and at state level, one Biosphere Reserve (El Cielo in Tamaulipas), and two state parks with a combined total area of distribution covered by in protected areas of 16,037 km2 (Figure 3 and Table S2).
Observations of Military Macaw populations (points) and the protected areas (white stippled areas) are shown overlaying the species potential distribution (dark grey).
Geographical dispersion of the occupancy areas
The average distance among the populations was 68 km ± 28.5 STD (n = 35); seven areas containing 39% of the macaws were located less than 45 km from the nearest population (Table S2). Only 22% of the macaws occur in populations 65 km or more from their nearest neighbour. The longest average distance between populations was observed in the Upper Balsas Basin (95 ± 43 km, n = 7), and the shortest distance on the Gulf Coast (45.8 ± 16.6 km, n = 5; Figure 2). The results from the nearest-neighbour analysis using “Euclidian distances” revealed that the localities in each region presented clustered patterns of distribution, not a random or uniform distribution (Euclidian distance analysis: Z-scores Northern Pacific = –16.5; Central Pacific = –25.1; Upper Balsas Basin and Gulf of Mexico = –7.73, P ≤ 0.00001 for all regions).
Population abundance
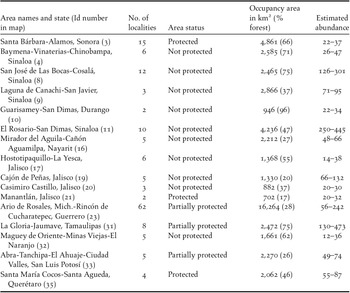
Combining the results of 913 count sessions and data from 13 published sources, the overall population size in Mexico is estimated to fall between 1,563 and 3,263 individuals (Table 2), of which 502–677 come from previously published sources (Table 3). The highest abundance was observed in the northern Pacific region (14 populations with 651–1,138 macaws, or 34–41% of the total). Noteworthy estimates of abundance are Rosario-Prado Mesillas (Id 11; Figure 2) with a maximum of 445 macaws, and the area of San José las Bocas-Cosalá with 301 macaws (Id 8; Figure 2; Table 4).
Published estimates of local abundance of Military Macaw.
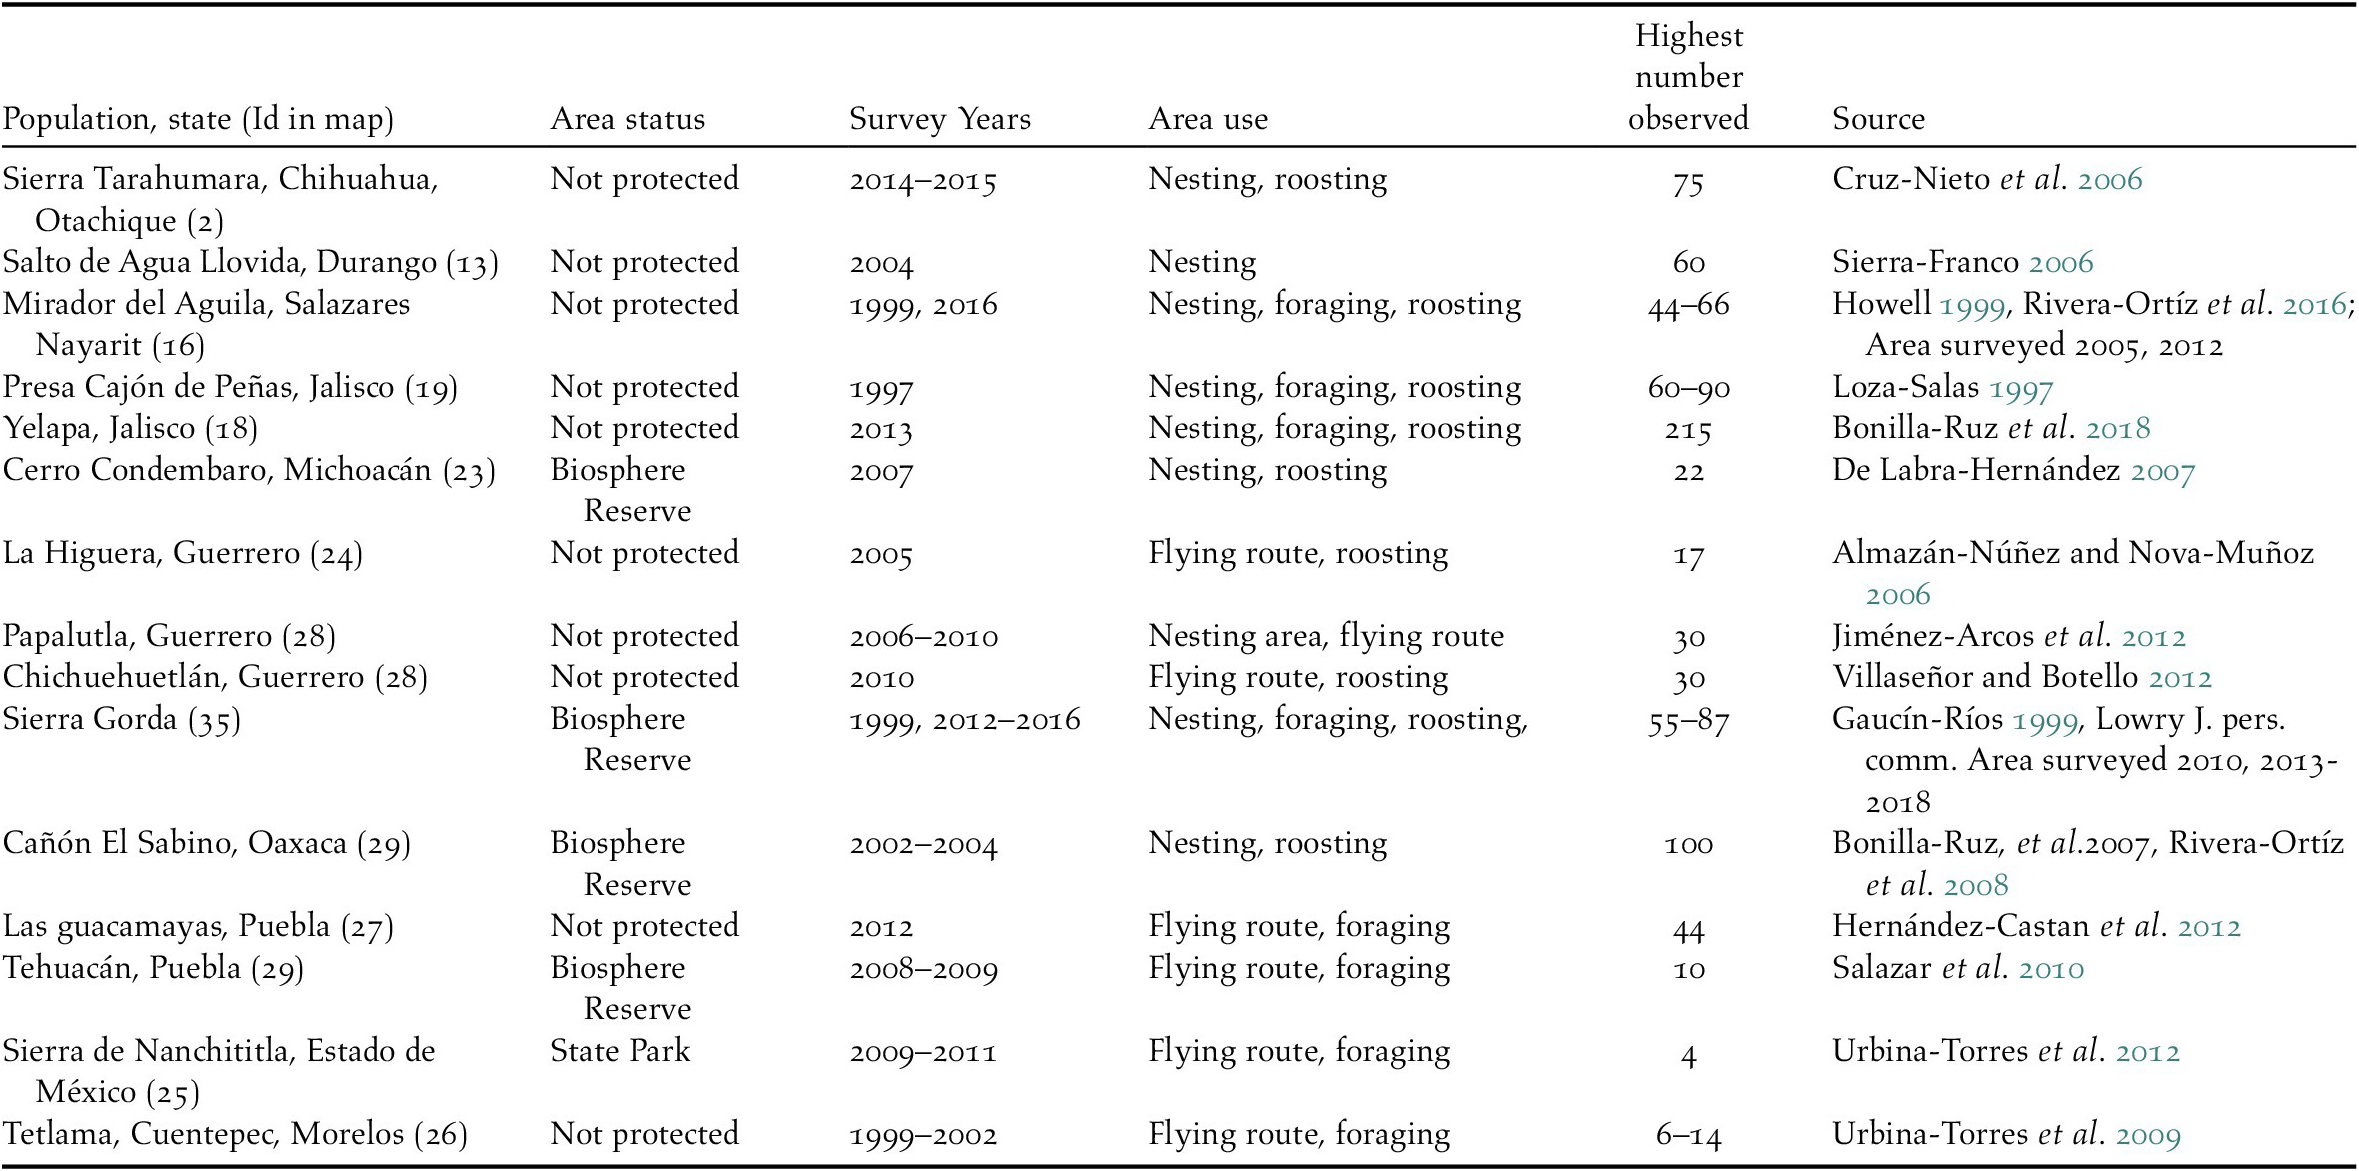
Identified populations using occupancy areas with ≥ 30 macaws for which no published assessments exist. Number of localities is the number of sites with macaws within a population (Partially protected consideration refers to areas where only some localities are within reserves).
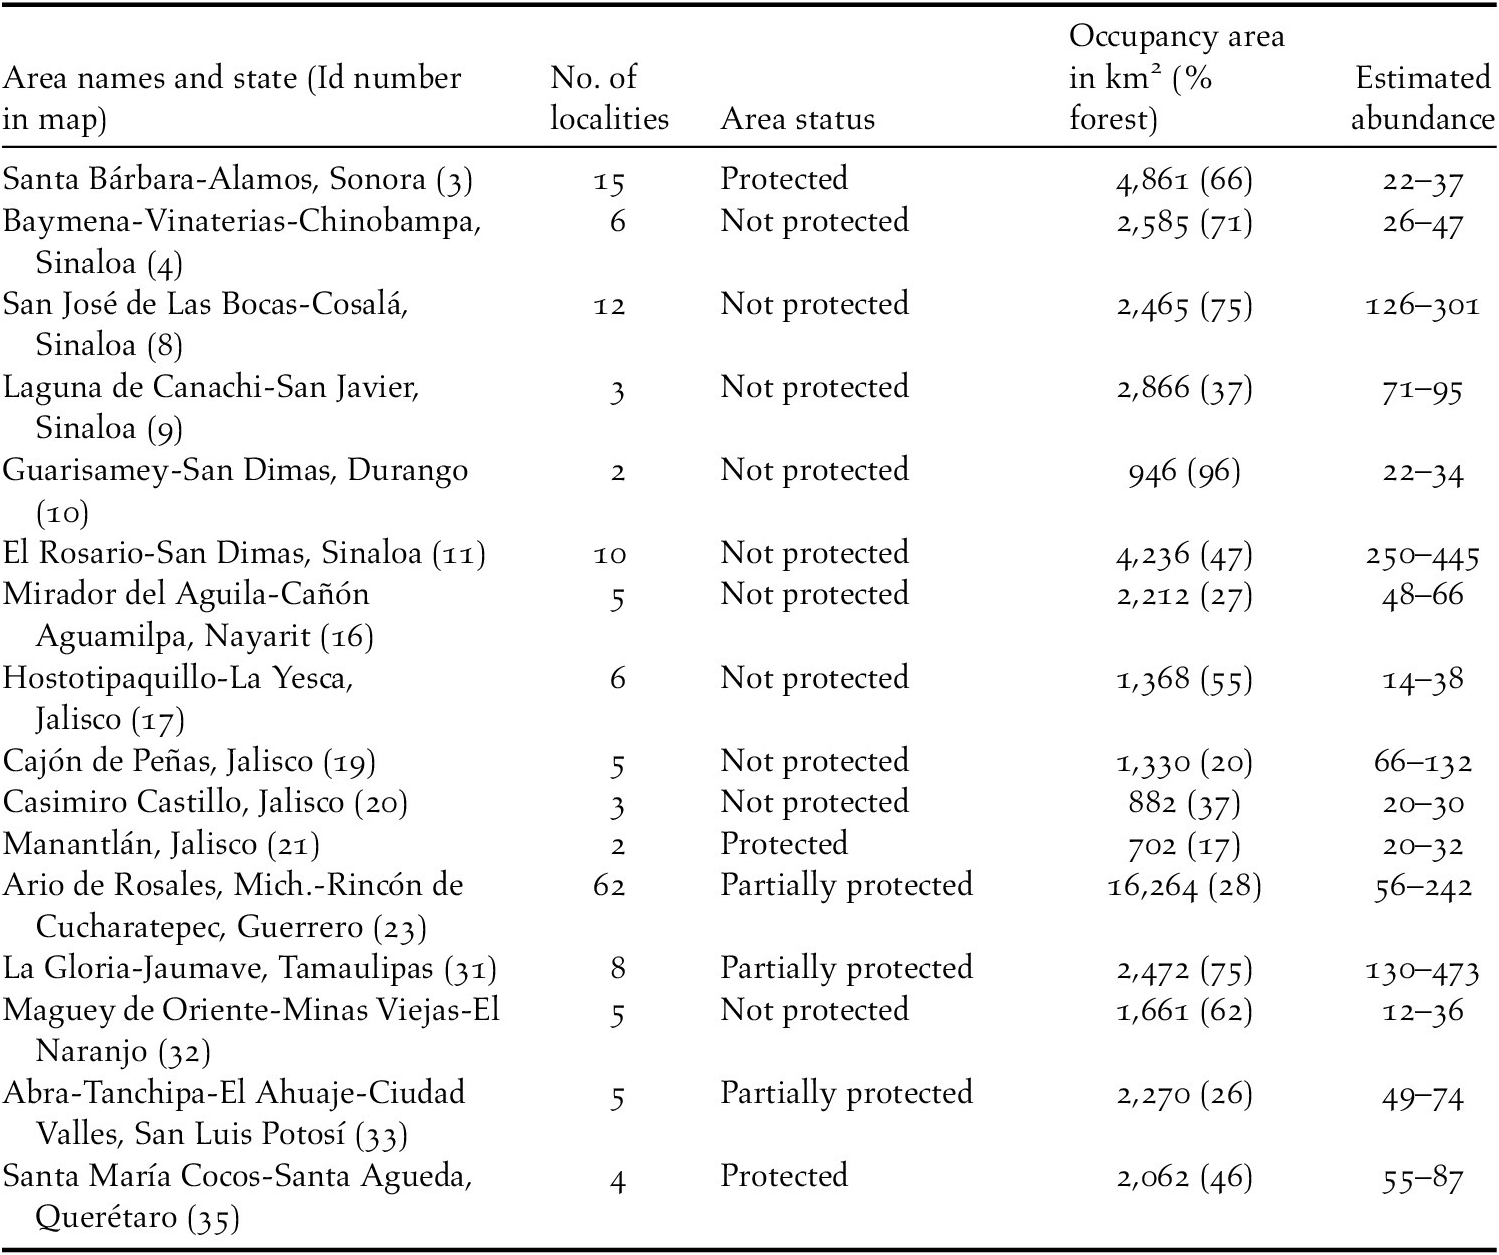
The Central Pacific presents the second highest abundance with 439–1,169 macaws in nine populations. In this region the largest population occurs in the Yelapa-Bioto-Los Sauces population (215–616, Id 18 in Figure 2, Table 2). The Gulf Coast region is third in abundance (five populations, 23 sites and 250–686 macaws; Table 2). The highest abundance in the Atlantic corresponds to the Jaumave-Alta Cima area, which includes six localities with a maximum of 473 macaws (Id 31in Figure 2; Table 4). The lowest number corresponds to the Upper Balsas Basin region, with 473 macaws distributed across in seven populations (Figure 2; Table 2).
Relative abundance
Macaw abundance and primary forest cover were positively correlated r (33) = 0.49, P = 0.0023). There was a low negative correlation between macaw abundance and distance to the nearest neighboring population r (33) = –0.21, P = 0.21). Encounter rates, among other statistics obtained in the counts, showed the highest correlation with maximum abundance estimates of the populations and constitute the best predictor of abundance, r (33) = 0.80, P = 0.0001), followed by the average abundance among localities in a population r (33) = 0.78, P = 0.0001) and a moderate relation with average flock size r (33) = 0.50, P = 0.008).
The highest encounter rates were observed for the Central Pacific with 1.9 macaw/hour (± 1.45 STD n = 528), presenting a broad variation; with low rates of 0.8 (± 0.33 STD n = 20) in Chorros del Varal, and 11.5 (± 13.5 STD n = 20) for the Yelapa-Bioto-Los Sauces which was the highest rate observed in Mexico. In general encounter rates per occupancy area were ≤1.0 macaws/survey hour (Table S3).
Average flock size also varied, averaging 7.9 macaws in the Gulf coast region, with highest local average of 20 macaws at the Sótano del Barro in Querétaro (Id 35 in Figure 2), to a low of 3.3 San Nicolás de los Montes (Tamasopo). Average flock size was similar between the Northern and Central Pacific (3.8 and 3.7 macaws per flock respectively) (Table S3).
Macaw abundance in Natural Protected Areas
Nine protected areas overlap our calculated macaw occupancy areas, and the combined number of macaws (hereafter “protected macaws”) range from 440 to 1,053, representing 13.4% to 32% of the estimated national population. However, the estimated percentage of macaws occurring in protected areas differs by region, ranging from 2.9% in a single protected area (Id 3 Figure 2-I) in the northern Pacific, to 75% spread across three protected areas (Ids 33 and 35 Figure2-IV) in the Gulf Coast region.
Conservation status of the populations
The vulnerability index we calculated for each region ranged from 11 in the Gulf Coast Region to 14 in the Upper Balsas Basin (out of a maximum score of 15). This suggests that the species is moderately to highly vulnerable nationwide. In the Upper Balsas Basin the low overall regional population is scattered in small numbers (≤ 50) across a highly transformed landscape with low forest cover in most of the areas occupied, with protected macaws found only in Tehuacan-Cuicatlan Reserve (Id 29 in Figure 2). In contrast the Gulf of Mexico region (eastern range) contains a more protected and intact landscape, but overall macaw numbers are low (Table 5).
Conservation status of populations at regional level (points scored).
Climatic profile of at the regional level
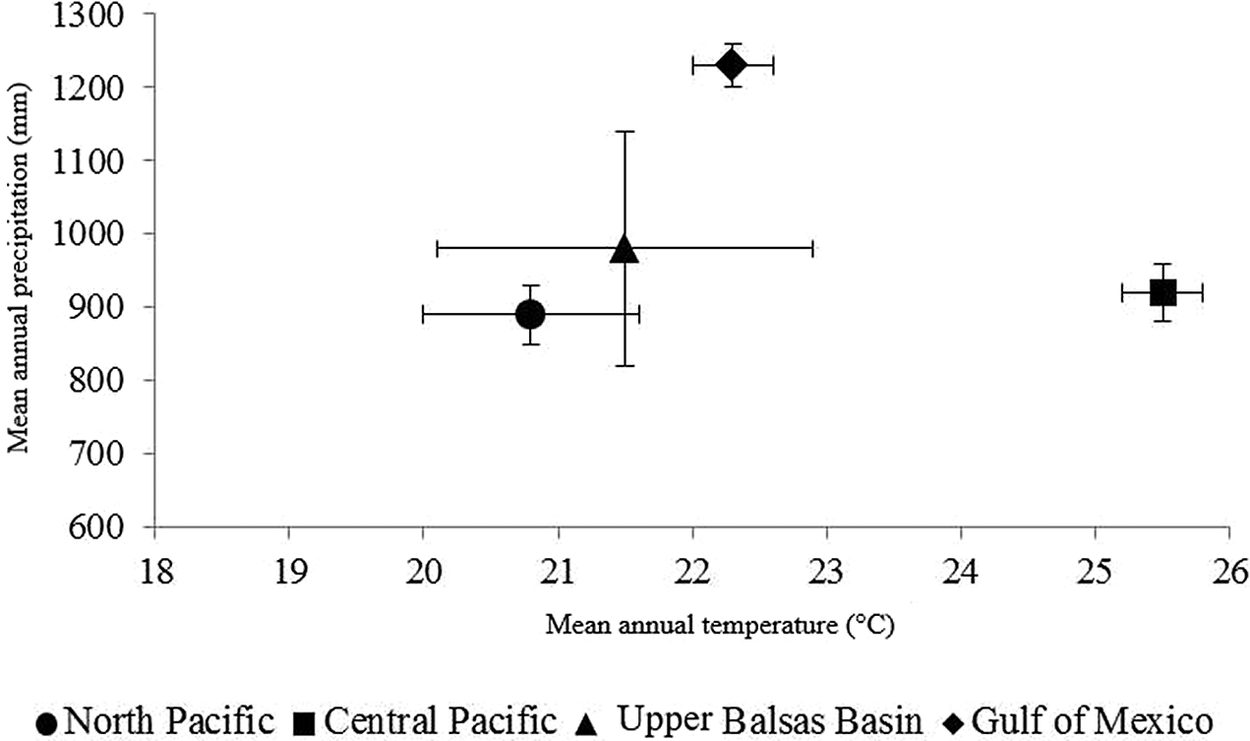
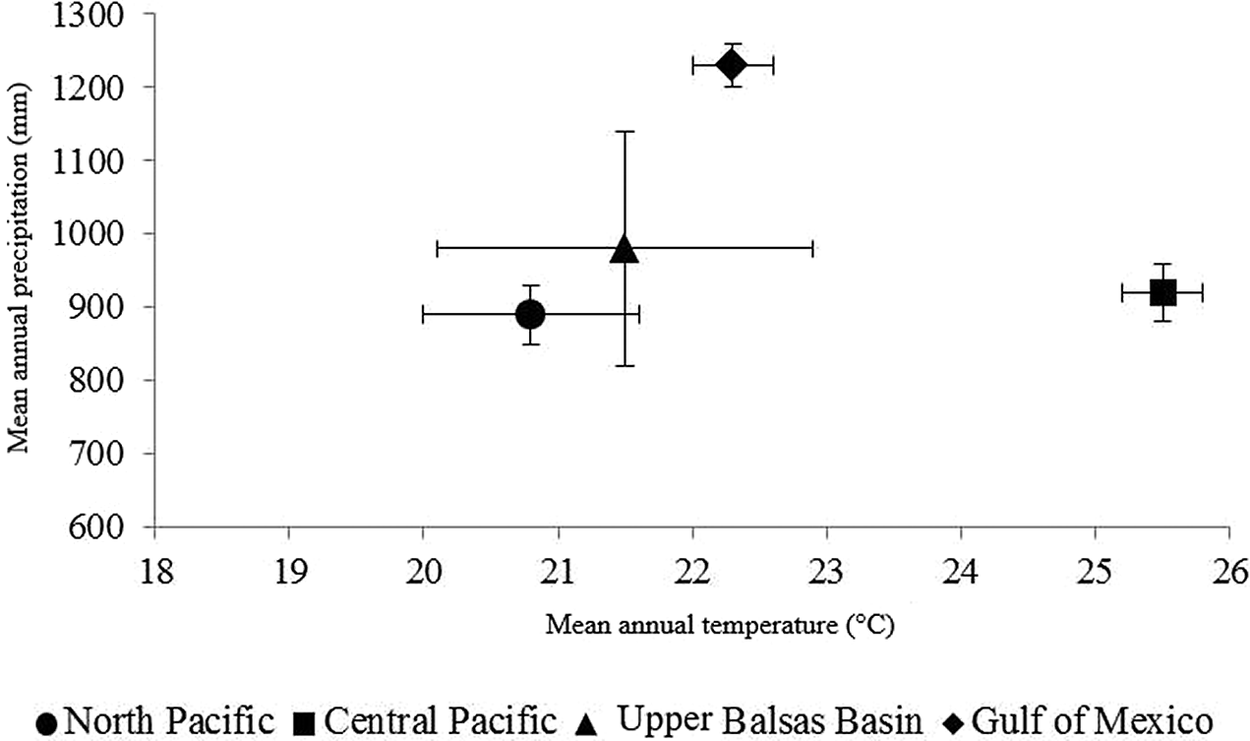
The Military Macaw populations in Mexico occur in heterogeneous landscapes and climatic regimes. The mean precipitation and temperature for the localities nationwide is 950 mm (407–1,546 mm range, n = 203) and 23°C (10–29°C range, n = 203). The localities on the Gulf of Mexico are the most uniform in climatic conditions (mean annual precipitation 1,200 mm and annual temperature 22°C). This is also the region with the highest precipitation for the species in Mexico. The localities of the Central Pacific have the highest mean annual temperature (26C°), with some localities presenting the hottest and driest temperatures for the species. The localities of the Upper Balsas Basin exhibit the highest variability in both parameters (Figure 4).
Climatic ranges of Military Macaws in Mexico. The figure shows the climatic conditions (mean annual precipitation and temperature) of sites occupied by Military Macaws in Mexico. The mean for each region is shown as the central dark point and the lines represent the range.
Discussion
This is the first national level assessment of Military Macaw in Mexico providing a comprehensive analysis of unpublished field survey data and published information. Although the species has one of the largest potential distributions among Mexican Psittacine, only 29% is occupied (Ríos-Muñoz and Navarro-Sigüenza Reference Ríos-Muñoz and Navarro-Sigüenza2009, Rivera-Ortíz et al. Reference Rivera-Ortíz, Oyama, Ríos-Muñoz, Solórzano, Navarro-Sigüenza and Del Coro Arizmendi2013, Monterrubio-Rico et al. Reference Monterrubio-Rico, Charre-Medellín, Pacheco-Figueroa, Arriaga-Weiss, Valdez-Leal, Cancino-Murillo, Escalona-Segura, Bonilla-Ruz and Rubio-Rocha2016). At a country-wide scale, the populations are scattered across their range, but within each region, neighbouring localities form clusters with macaws sharing a territory that we consider analogous to the IUCN definition of area of occupancy (Figures 1–2). This pattern is similar to the descriptions provided in the late 1970s-80s, which noted the irregularity in distribution and abundance of the species across Mexico. Forshaw (Reference Forshaw1978) defined the species as common in the north-east and north-west, but rare and declining in the south. Our analysis indicates that the north-east still maintains one key population (Id 31 in Figure 2-IV; La Gloria-Jaumave), and the north-west has regular presence with 14 occupancy areas (Table S3).
Ridgely (Reference Ridgely and Pasquier1981) observed early morning flocks containing 70–174 macaws in San Luis Potosí, while today the species is still present but at lower numbers (Id 33–34 in Figure 2-IV) (Table 4). Ridgely (Reference Ridgely and Pasquier1981) also described a “uniform distribution throughout the western range”, having higher abundance near irregularly distributed nesting and roosting cliffs, but absent from large areas. Today some similarities are seen, with high abundance and regular activity occurring around the cliff crevices of Sótano del Barro, Quéretaro, the Tehuacan-Cuicatlán Biosphere Reserve Oaxaca, Mirador del Aguila Nayarit, and in old growth forest in Yelapa, Jalisco (Table 3). In South America the species exhibits a similar pattern, with locally high abundances associated with nesting cliffs, but mostly in remote parts of protected areas where large blocks of primary forest remain (Arcos-Torres and Solano-Ugalde Reference Arcos-Torres and Solano-Ugalde2008, Juárez et al. Reference Juárez, Marateo, Grilli, Pagano, Rumi and Silva-Croome2012, U.S. Fish & Wildlife Service 2019).
Ridgely (Reference Ridgely and Pasquier1981) documented a declining trend for Oaxaca and Chiapas and unfortunately our surveys for the Pacific confirmed their extirpation across coastal areas from Chiapas to Colima (Ridgely Reference Ridgely and Pasquier1981, Villaseñor-Gómez Reference Villaseñor-Gómez1988, Marín-Togo et al. Reference Marín-Togo, Monterrubio-Rico, Renton, Rubio-Rocha, Macías-Caballero, Ortega-Rodríguez and Cancino-Murillo2012). One hypothesis explaining the general pattern of dispersion is the local extinction of populations caused by decreasing forest quality, poaching pressure, and behavioural responses differing in each area.
Unfortunately, local extinctions can go unnoticed and may have been occurring across the entire range, accentuated in some regions such as the coastal Pacific of Michoacán and Jalisco, where the species vanished during the 1980s even though the area retained forest cover comparable to areas where macaws still persist (Villaseñor-Gómez Reference Villaseñor-Gómez1988, Del Coro Arizmendi et al. Reference Del Coro Arizmendi, Márquez-Valdemar, and Ornelas, Noguera, Vega-Rivera, García-Aldrete and Quesada-Avendaño2002, Monterrubio-Rico et al. Reference Monterrubio-Rico, Charre-Medellín, Pacheco-Figueroa, Arriaga-Weiss, Valdez-Leal, Cancino-Murillo, Escalona-Segura, Bonilla-Ruz and Rubio-Rocha2016).
Our analysis shows that populations occur in clusters of neighbouring sites with small numbers of pairs. This pattern may be due to the absence of optimal conditions for nesting (clusters of cliff crevices or areas with many large tree cavities). In this case, we hypothesize that a behavioural response to this shortage may be to disperse in small groups to adjacent areas, but still maintain regular contact with birds in adjacent areas (Juniper and Parr Reference Juniper and Parr1998). Communication and contact among macaws in neighbouring areas was evidenced by observations of coordinated flights from neighbouring nesting and roosting sites in Jalisco (Bonilla-Ruz et al. Reference Bonilla-Ruz, Monterrubio-Rico, Avilés-Ramos and Cinta-Magallon2014), and in Oaxaca where distances from nesting, roosting, and neighbouring groups to feeding sites were shorter than 10 km (Bonilla-Ruz et al. Reference Bonilla-Ruz, Reyes-Macedo and Cruz2007a).
Determining how the availability and dispersion of suitable habitat influence mobility and connectivity among local and regional macaw populations may require the use of satellite telemetry. Although ideal, determining flyways and movements of populations may be cost prohibitive; collars cost on average about 3,000 USD and 20–50 USD for data download per macaw per month (North Star Science and Technology 2019).
Factors influencing the patterns of geographical distribution of the species also influence their abundance, as forest structure and food supply are determined by climatic conditions. Higher macaw abundance is correlated with landscapes where annual precipitation is greater than 1,100 mm and a forest extent of 1,800 km2, with the presence of tropical semi-deciduous and pine-oak forests at higher elevations. The populations of Yelapa-Bioto (616 macaws), El Rosario-San Dimas (445 macaws), San José de las Bocas-Cosala (301), and La Gloria-Jaumave (473 macaws) share these conditions (Table 4). However, most of the species’ range in Mexico seems to constitute sub-optimal habitat as the precipitation averages 950 mm across the range, with 55% of the localities receiving lower than that figure. Some localities have some of the lowest precipitation levels documented for any macaw, for example Chachacuaxtle, Durango with an average of 503 mm per year.
Neotropical landscapes where macaw populations are abundant consist of highly productive tropical forests where annual precipitation is high (≥2,000 mm), containing dense forest stands with emergent trees such as in the Peruvian or Brazilian Amazon (Roth Reference Roth1984, Haugaasen and Peres Reference Haugaasen and Peres2008, Vigo et al. Reference Vigo, Williams and Brightsmith2011, Orbe-Alvan Reference Orbe-Alvan2017). However, some mixed macaw communities (Ara glaucogularis, Ara ararauna and Ara chloropterus) also occur in remote and isolated non-forested areas but with pristine landscapes (tropical savanna, and Pantanal), with minimal human presence (Berkunsky et al. Reference Berkunsky, Daniele, Kacoliris, Díaz-Luque, Silva Frias, Aramburu and Gilardi2014), or inside large Biosphere Reserves as in the Ecuadorian Tiputini reserve (Karubian et al. Reference Karubian, Fabara, Yunes, Jorgenson, Romo and Smith2005). In contrast, the Military Macaw range in Mexico is mostly highly seasonal and irregular in seed and fruit production; therefore we assume the species adopted a nomadic behaviour when not nesting. Seasonal productivity seems to influence the spatial use of habitat at different geographic scales as documented for the macaws in Oaxaca (Bonilla-Ruz et al. Reference Bonilla-Ruz, Reyes-Macedo and Cruz2007a), or Coastal Jalisco (Bonilla-Ruz et al. Reference Bonilla-Ruz, Cinta-Magallón, Monterrubio-Rico and Avilés-Ramos2018).
Based on the spatial distribution of the occupied sites, we assume that macaws at the regional level operate as a large set of metapopulations (Hanski et al. Reference Hanski, Moilanen and Gyllenberg1996). In each region few populations with high abundance exist, and there are many nearby small satellite populations (≤40) which are likely in contact for mate exchange (Table S2). Such a geographic population structure makes a viable complex system, as long as “source populations” do not decline.
The overall number of macaws estimated in this study (1,563–3,263) is the highest documented for the species to date in Mexico or anywhere across its range. The number is slightly higher than the lower limit of the global population size (2,000–7,000) provided by BirdLife International (2019) and it represents 46% of the estimated maximum population size (BirdLife International 2019). In contrast, our findings are smaller than the global estimates of 6,000–13,000 by U.S. Fish & Wildlife Service (2019).
For Mexico the overall number may be higher, given that some areas were inaccessible for surveys, and that undetected areas with macaws are still likely, considering the large and inaccessible nature of the species’ potential range (Figures 1-2). However, if these macaws exist, they most likely comprise small numbers, considering that localities with ≥50–100 macaws were uncommon in the surveyed range (Tables 3 and 4).
Conservation perspectives
The percentage of macaws in protected areas is 32% (1,045 out of 3,263), but when examining each region, high vulnerability is evidenced. Some regions contain a high proportion of forest occupied by macaws in protected areas such as the Gulf of Mexico, but the overall number of macaws is low. In addition, the percentage of macaws in protected areas is lower that the percentage of protected habitat (42%) in occupied areas. The most critical situation is observed in the Northern Pacific, where only 3.2% of macaws are protected (Table 5). Clearly, the establishment of new protected areas is needed for the Central and Northern Pacific regions. Reserves are urgently needed for the southern portion of Bahia de Banderas bay in Jalisco where mature forest contains a breeding source population of 215 individuals (Bonilla-Ruz et al. Reference Bonilla-Ruz, Cinta-Magallón, Monterrubio-Rico and Avilés-Ramos2018), and for central and southern Sinaloa, where two populations contain more than 300 macaws (Table 4).
Research, management, and conservation actions require implementation at different spatial scales. Connectivity among macaw populations in isolated areas should be improved by forested corridors along canyons and ravines, benefiting also terrestrial species (Meffe and Carroll Reference Meffe and Carroll1997). The levels of macaw productivity and habitat characteristics should be measured locally and across regions, identifying forest structure associated with high macaw abundance and nesting success (Bonilla-Ruz et al. Reference Bonilla-Ruz, Cinta-Magallón, Monterrubio-Rico and Avilés-Ramos2018, Flores-López Reference Flores-López, Montero-Castro, Monterrubio-Rico, Ibarra-Manríquez, López-Toledo and Bonilla-Ruz2020). Although nest box use by military macaws in Mexico has not been attempted in the wild, ongoing efforts are being implemented to maintain tree cavity availability for the nesting population at Yelapa where poaching reduced nest sites recently (Bonilla-Ruz pers. comm.) (Table 3). A similar strategy provided moderate success in seasonal forests of western Costa Rica where Ara macao was affected by poachers (Vaughan et al. Reference Vaughan, Nemeth and Marineros2006). If successful, increasing the number of nesting pairs in protected high quality forest fragments should be encouraged but is only possible with community collaboration and surveillance (Bonilla-Ruz et al. Reference Bonilla-Ruz, Monterrubio-Rico, Avilés-Ramos and Cinta-Magallon2014, Reference Bonilla-Ruz, Cinta-Magallón, Monterrubio-Rico and Avilés-Ramos2018).
Efforts to increase the species’ abundance in Mexico should consider a conservation target of ≥10,000 macaws in the country and maintain the actual distribution (Traill et al. Reference Traill, Bradshaw and Brook2007). To achieve such results, rural communities could assist in monitoring programmes and habitat restoration projects, as the support of community monitors living in locations near the sampling sites made possible the access to the sites, security, logistics, and counts. Federal reforestation and rural employment programmes should also be promoted to restore forests in macaw occupancy areas for local populations.
The species’ long-term viability in Mexico is uncertain as the vast majority of the 35 populations identified contain less than the 500 individuals recommended to reduce the impacts of demographic and environmental stochasticity (Shaffer Reference Shaffer1981). Even at the national level, the overall population is slightly below the range of 3,577–5,129 individuals recommended to maintain viable populations in long-lived vertebrates (Traill et al. Reference Traill, Bradshaw and Brook2007). In addition, the large separation of the eastern and western regions makes the prospects for long term survival lower, especially for the eastern range with only 686 individuals (Table 4). Although the macaws in central and western Mexico could possibly be managed as a single unit, it seems more reasonable to recognize the existing genetic break (Rivera-Ortíz et al. Reference Rivera-Ortíz, Solórzano, Arizmendi, Dávila-Aranda and Oyama2017) and manage to maintain the long-term viability of each region.
Replacement of native forest by grassland should be halted in areas where key populations survive in coastal Jalisco and Tamaulipas, as those areas may constitute key source populations reliant on the remaining forest. Range-wide assessments should be implemented every five years to revise the species’ status using the data provided in this analysis. Given the relatively large numbers of remaining birds, the long-term conservation of the species is possible. However, actions should be initiated soon to avoid reaching critically low numbers, as exemplified by Ara macao in Mexico which is nearly extinct in the wild (Estrada Reference Estrada2014, Sánchez-Soto et al. Reference Sánchez-Soto, Esteban-Guzmán and Lizcano-Aguilar2017). The development of conservation and management policies focused on this species should be promoted (Van der Hoek et al. Reference Van der Hoek, G and Martin2017), to favour the development of research and monitoring projects.
Supplementary Materials
To view supplementary material for this article, please visit http://dx.doi.org/10.1017/S0959270920000702.
Acknowledgements
This study would not have been possible without assistance from multiple students, colleagues, and institutions. We are grateful to R. Manriquez, E. Rendon, H. Garza-Torres, M. López-Hernández, M. Álvarez-Jara, A. Salazar-Zamudio, L. M. Avilés Ramos, R. Pedraza. Economic support was provided by Coordinación de Investigación Científica in Universidad Michoacana de San Nicolás de Hidalgo, Fondo Sectorial de Investigación Ambiental SEMARNAT-CONACYT (2002-C01-00021), PROCER –CONANP and Loro Parque Fundación. Research permits were provided by the Dirección General de Vida Silvestre, SEMARNAT. We thank Universidad Michoacana de San Nicolás de Hidalgo for their continued support.