

Published online by Cambridge University Press: 10 May 2005
Immediately after the 2004 election, with overwhelming majorities in 13 states voting to amend their constitutions to ban same-sex marriage and exit polls showing large numbers saying “moral values” were the most important determinant of their vote, many analysts emphasized religious and cultural divides in the electorate and the importance of the religious right and same-sex marriage in motivating President George W. Bush's base to get out and vote (e.g., Chinni 2004; Cooperman and Edsall 2004; Dao 2004; Manly 2004; McGough 2004; Testa 2004). With more analysis, the consensus seems to have shifted to an emphasis on incumbency, terrorism, and perceptions of character. Both voter turnout and support for Bush rose across a wide array of groups; evangelical Protestants and voters in states with same-sex marriage amendments on the ballot did not disproportionately increase their numbers or their preference for Bush; white women, married women, and Latinos may have played a bigger role in the shift toward Bush (e.g., Abramowitz 2004; Burden 2004; Freedman 2004; Nordhaus 2004; Sherrill 2004; Signorile 2004).
This paper re-examines the role of same-sex marriage in the 2004 election, using both individual and state-level data. In both analyses, I control for factors likely to have changed their impact on voters since 2000: September 11 and the rising fear of terrorism, the war in Iraq, and changes in the economy. In the individual-level analysis on a March 2004 Los Angeles Times survey, I control for party identification, ideology, and a variety of demographic characteristics. In the state-level analysis, I control for Bush's share of the two-party vote in 2000. In both analyses, I find that other issues mattered much more, but that attitudes toward same-sex marriage had a statistically significant and meaningful impact on both individual voters and state vote totals.
Responses to a March 2004 Los Angeles Times poll1
The Los Angeles Times surveyed 1,415 registered voters during March 27–30, 2004, using random-digit dialing techniques. Analyses are weighted to conform with census figures on characteristics such as sex, race, age, and education.
This does not mean that attitudes toward gay relationships decided their votes, of course, as these attitudes are strongly related to standard political and demographic variables that influence presidential preferences.2
The adjusted count R2 is .276 for a multinomial logit model (not shown) tying favoring marriage, favoring civil unions, or opposing both to political ideology, party identification, religion, age, education, gender, race, and sexual orientation.

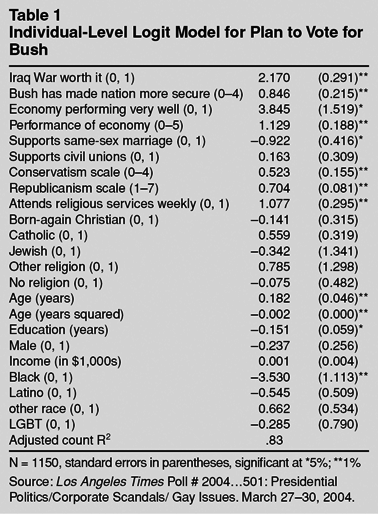
Party identification, judgments on the war in Iraq, perceptions of the economy, support for Bush's anti-terrorism efforts, and political ideology had the most impact. A Republican (6 on a 7-point scale) with mean characteristics and attitudes for the data set was 60 percentage points more likely than a comparable Democrat (2 on a 7-point scale) to prefer Bush. Holding all other variables at their means, the probability of supporting Bush was increased by 49 points if one believed the war in Iraq was worth it, by 27 points if one thought the economy was doing fairly well rather than fairly badly, by 21 points if one judged that “George W. Bush's policies on terrorism and national security have made the country… somewhat more secure” rather than “somewhat less secure,” and by 21 points if one was somewhat conservative rather than some-what liberal.
Even among demographically and politically similar individuals, those who favored same-sex marriage were 25 percentage points less likely to support Bush than those who opposed it. With these variables controlled, differences between those who favor and oppose civil unions are not significant; in the sample, those who favored civil unions were marginally more likely to prefer Bush than those who opposed them. When support for a constitutional amendment is added to the equation, marriage supporters remained significantly more likely to vote for Kerry than others, but amendment supporters were not significantly more likely than others to vote for Bush.
The 2004 election largely replayed that of 2000. Both candidates focused on a handful of swing states from the beginning, and narrowed their focus to 11 states by the final weeks of the campaign (Nagourney and Seelye 2004). Bush's vote share changed by two percentage points or less in 30 states, never shifting by more than 5.5 points, and only three states changed hands. To detect the sources of changes in vote totals, I regress the percentage of the two-party vote going to Bush in 2004 on the percentage of the two-party vote going to Bush in 2000, plus variables intended to capture responses to terrorism, the war in Iraq, changes in the economy, and same-sex marriage.
Following Abramowitz (2004), a dummy variable for the three states most directly affected by the attack on the World Trade Center (New York, New Jersey, and Connecticut) serves as an indicator of the importance of terrorism in the election. I experimented with Wright, McIver, Erickson, and Holian's (2000) measures of state ideology and partisanship as proxies for approval of Bush's handling of the war in Iraq. (In the Los Angeles Times data, both are strongly related to belief that the war was worth it: gamma = .54 and .64, respectively.) Changes in state unemployment levels between 2000 and November 2004 measure changes in economic conditions (Abramowitz 2004).
For opposition to same-sex marriage, I develop a state-level measure of disapproval of homosexuality, using a variation on methodology laid out by Wright, Erickson, and McIver (1985).3
This is about three-quarters the size of the original sample Wright et al. (1985) used to develop their state liberalism measure. Although direct measures of attitudes toward same-sex marriage (SSM) may have been preferable, obtaining sufficient numbers of SSM polls with state-identifiers, most of which have been conducted in the past few years, was not practical. Negative judgments of homosexual relations and opposition to SSM are strongly correlated. In a 2003 CBS News/New York Times poll, 94% of those who called homosexual relations “morally wrong” opposed SSM, compared to only 10% of those who said they were “okay” and 39% of those who didn't care that much; and 94% of those who said homosexual relations should be illegal opposed SSM, compared to only 28% of those who said they should be legal. Likewise, in a 2003 Pew Research Center poll, 85% of those who said that homosexual behavior was a sin opposed SSM, compared to only 23% of those who said it was not a sin. (Gammas for the three relationships range from .76 to .90.)
The exact question was “What about sexual relations between two adults of the same sex—do you think it is always wrong, almost always wrong, wrong only sometimes, or not wrong at all?” See Yang (1997, 484–85) for full data on the series. NORC has only recently begun offering a state-identifier with a special version of the GSS, because it does not sample on states and makes no claim about the representativeness of the state samples. Brace et al. (2002), however, show that state-level GSS measures should be representative under fairly general conditions. The GSS sample does not include respondents from Hawaii, Idaho, Maine, Nebraska, Nevada, or New Mexico. I only have the state-identifier through 1998.
The surveys were fielded by the Times Mirror Center for the People and the Press and its successor, the Pew Research Center for the People and the Press. The first three surveys were conducted by the Gallup Organization, the remainder by the Princeton Survey Research Associates. The first four were personal interviews, the remainder telephone interviews. Sample sizes varied widely from year to year, with the last two surveys less than one-third the size of the first. The 1990 and 1994 surveys did not identify the respondent's state of residence. Gallup, April 25–May 10, 1987 (N = 4244); Gallup, May 13–22, 1988 (N = 3021); Gallup, January 1–February 5, 1989 (N = 2048); PSRA, May 1–31, 1990 (N = 3004); PSRA, October 21–November 10, 1991 (N = 2020); PSRA, May 28–June 10, 1992 (N = 3517); PSRA, May 18–24, 1993 (N = 1507); PSRA, July 12–27, 1994 (N = 1009); and PSRA, November 5–17, 1997 (N = 1165).
Question wording varied somewhat across polling firms. “Do you think that homosexual relations between consenting adults in their own homes should be legal or illegal?” Gallup (N = 1513, June 17–20, 1977; N = 1531, June 25–28, 1982; N = 1008, November 11–18, 1985; N = 1015, March 14–18, 1987; N = 1227, October 12–15, 1989; N = 1216, August 29–September 3, 1991; N = 1002, June 4–8, 1992; N = 1003, November 21–24, 1996); “Do you think that homosexual relations between consenting adults in their own homes should be legal or illegal?” CBS News/New York Times (N = 1480, August 16–20, 1987; N = 1143, February 9–11 and 20–21, 1993); “Do you think that homosexual relations between consenting adults in the privacy of their own homes should be legal or illegal?”Los Angeles Times (N = 2405, July 9–14, 1986; N = 2040, August 15–19, 1987); “Do you think homosexual relations between consenting adults should or should not be legal?” ABC News/Washington Post (N = 1531, June 23–26, 1994); “Do you think that homosexual relations between consenting adults should or should not be legal?” Yankelovich Partners (N = 800, June 15–16, 1994).
Responses were recoded into a disapproval dummy variable with those who said homosexual relations were always wrong or should be illegal or who agreed that AIDS might be God's punishment for immoral sexual behavior coded “1” and those who disagreed coded “0”.7
Those who did not know or refused to answer were dropped.
Sample sizes were large enough (only three states had fewer than 100 respondents, six more had under 200, and seven more had under 400) and opinions varied enough across states and time, that most coefficients were significant at the .05 level. Residents of 15 states were significantly more likely than Pennsylvanians to disapprove of homosexual relations and those in 19 were significantly less likely to do so. Disapproval of homosexual relations was significantly lower in 1997 and 1998 than in all prior years. Responses varied substantially by question: across all years, 68% said homosexual relations were always wrong, 52% said they should be illegal, and 47% agreed that AIDS might be God's punishment for immoral sexual behavior.
From the model, I generated the expected percentages who thought homosexual relations were “always wrong” for each state for 1998.8
I created a data set with 50 blank lines, one for each state; created each of the variables in the probit model; coded the year and firm variables to indicate that this was a 1998 GSS question; then, after running the probit model, switched from the combined sample to this “dummy” data set and ran the Stata predict command to generate the expected probability of saying homosexual relations were always wrong. By changing the coding on the firm or year variables in the dummy data set, I could have generated the expected percentage saying homosexual relations should be illegal or that AIDS could be God's punishment for immoral sexual behavior for any survey year from 1973 through 1998. That is, the state percentages for “always wrong” in 1998 are just nonlinear transformations of state percentages on any of these questions in any year—the relative ranking of the states would not change.
To test its validity as a measure of opposition to same-sex marriage, I regressed the percentage voting in favor of the constitutional amendments in the 13 states that considered these measures. Heteroskedasticity is typically a problem in state-level models, as the variance of the error term typically declines with population; weighting by population is likely to yield more efficient estimators. Further, measurement error in disapproval of homosexuality will tend to bias its coefficient toward zero (Wooldridge 2003, 305–9). Because the reliability of the wrongness measure rises (and its measurement error falls) with the number of observations used in calculating the state measure, weighting by the number of responses (which is correlated .98 with vote totals) should decrease bias in the coefficient. Further, robust standard errors should yield consistent estimators of the true standard errors of the regression coefficients, even in the face of heteroskedasticity.
In an unweighted bivariate model (not shown), the wrongness measure explains 69% of the variation in the percentage vote for the amendment; its coefficient is .82. When the bivariate model is weighted by the number of responses, R2 rises to .71 and the percentage voting for the amendment was expected to rise .95 point as the percentage of state residents calling homosexual relations “always wrong” rose by one point. Adding dummy variables for whether the amendment vote was held separately from the presidential election (drawing only voters who saw same-sex marriage as salient) and for whether the amendment only banned same-sex marriage or (might have) banned civil unions as well raised R2 for the weighted model to .86 and the coefficient to 1.02.9
Previous research has already shown that voter turnout did not increase in states that voted on constitutional amendments banning same-sex marriage (Abramowitz 2004; Burden 2004; Langer 2004; Nordhaus 2004; Sherrill 2004; Signorile 2004). Likewise, I find no link between disapproval of homosexuality and turnout. The strongest determinant appears to have been the closeness of the 2000 election—each additional percentage point gap between the candidates in 2000 lowered expected turnout by half a point. The 11 battleground states that saw special campaign attention had turnouts two to four points higher than predicted by the vote gap alone. Holding constant the gap and the campaign attention, however, turnout tended to be higher the greater the support for Bush in 2000. Bad economic conditions, reflected in higher unemployment rates, apparently lowered turnout. In no version of the model did disapproval of homosexuality have any noticeable impact on voter turnout, however.
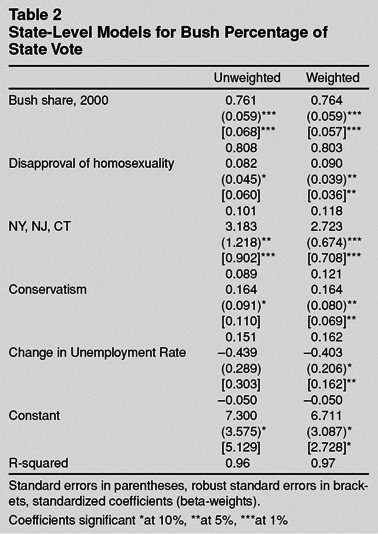
Bush's share of the two-party vote in 2000 explains 94% of the variation of his vote share in 2004 by itself (93% in the unweighted model). Nonetheless, all the other independent variables10
I experimented with both the Wright et al. (2000) partisanship and ideological measures; the Republicanism coefficient was not significant, and substituting it for conservatism yielded stronger and more clearly significant coefficients on the disapproval coefficient in each model.

Bush was expected to raise his vote share by 0.09 percentage point beyond what would be expected given its level of conservatism and 2000 vote for Bush in a state where an additional one percent called homosexual relations “always wrong.” Eight states had estimated disapproval rates at least four percentage points higher than would be expected from a regression of disapproval on the other variables in the model; in all but two Bush increased his vote share by more than two points. The 11 states where the campaigns focused their final efforts tended to be more disapproving than this model would predict—by about .8 point, on average—allowing the possibility that same-sex marriage could play a crucial role in the key states. Among them, New Hampshire had the largest negative residual (its estimated disapproval was six points lower than predicted by the auxiliary regression) and switched from Bush to Kerry. New Mexico was at the other extreme (with estimated disapproval nine points higher than expected) and shifted from Gore to Bush. Bush gained ground in three of the five battleground states whose disapproval was highest relative to their general conservatism and previous Bush support; he lost ground in four of the five states where disapproval was lower than expected. Still, Iowa switched from Gore to Bush in spite of being four points less disapproving than expected; Ohio decreased its support for Bush despite being six points more disapproving than expected; and Florida raised its support for Bush more than any other battleground states despite its relatively low level of disapproval.
Same-sex marriage mattered in the 2004 election, less than some issues but more than most. The 2004 election largely replayed an election where gay rights, especially same-sex marriage, played little role. Survey data indicate that the war in Iraq, the economy, and terrorism all had larger impacts on vote choices. In the state-level analysis, Bush support jumped in the states hardest hit by the World Trade Center bombing, and the vote was significantly more ideological in 2004 than 2000. Two-fifths of survey respondents said that same-sex marriage was an important issue in the presidential race, and the 13 state constitutional amendments on the ballot confirm its salience. Six months before the election, marriage-supporters were substantially more likely than politically and demographically similar others to support Kerry. Civil union supporters voted more like civil union opponents than marriage supporters, once these other variables are accounted for, however, undercutting the news that only about a third of voters opposed any form of legal recognition for gay relationships (e.g., Sherrill 2004; Signorile 2004). At the state level, even after controlling for Bush's vote share in 2000 and the general conservatism of the state population, popular disapproval of homosexuality influenced Bush's share of the 2004 vote and may have contributed to party switches by New Hampshire and New Mexico. The vote was close in Ohio despite relatively high disapproval of homosexuality. Would it have turned out differently without same-sex marriage on the agenda?
I am grateful to the following groups and individuals for giving me access to the data used in this paper: Farnaz Calafi and Claudia Vaughn of the Los Angeles Times, the Interuniversity Consortium for Political and Social Research, the Pew Research Center for the People and the Press, and the Roper Center for Public Opinion Research. I also want to thank American University's School of Public Affairs and Georgia State University's Andrew Young School of Policy Studies for funding the purchase of some of these data sets, and Charles W. Gossett and Ross Rubenstein for their helpful comments on an earlier draft of this paper.

Individual-Level Logit Model for Plan to Vote for Bush

State-Level Models for Bush Percentage of State Vote