


Introduction
The Indian Himalayan region (IHR) is vastly distributed across 2500 km of 13 Indian states/union territories and provides life support to 50 million people who reside in this region (NITI Aayog, 2018). Based on altitude, particularly low and mid-hill regions of the IHR are strategically important for agriculture crops. However, agriculture in hills is practiced against a plethora of challenges and considered as most fragile ecosystems due to higher vulnerability and lower adaptive capacity of farming community of this region under changing climatic conditions (Dahal et al., Reference Dahal, Dahal, Adhikari, Naukkarinen, Panday, Bista, Helenius and Marambe2022). The crop productivity in this region is lower than the country average and therefore hill-farming community realizes only 60% potential yield of various crop varieties (Bhattacharyya et al., Reference Bhattacharyya, Pandey, Gopinath, Mina, Bisht and Bhatt2016). Among various crop-limiting factors, soil fertility depletion and irrigation water availability are major constraints for lower productivity of hill crops. The lower fertility of soils of the Himalayan region are associated with higher erosion and soil acidity, low ion exchange capacity and nutrient status mainly nitrogen, phosphorus, calcium, magnesium, sulphur and micronutrients (Gupta et al., Reference Gupta, Marwaha and Bali1985; Sidhu and Surya, Reference Sidhu and Surya2014). To address such problems organic manure (farmyard manure [FYM]) application along with urea is commonly practiced in hills of north-west Himalayas which realize the importance of age-old traditional knowledge supported by strong scientific background to sustain the production of soybean–wheat systems in this region. However with changing time and introduction of high-yielding cultivars without considering judicious nutrient management strategies has resulted in higher nutrients depletion and yield stagnation in this region (Kundu et al., Reference Kundu, Bhattacharyya, Prakash, Gupta, Pathak and Ladha2007). In this regard, previously conducted long-term fertilizer experiments (LTFEs) have shown that continuous balanced fertilization can improve the soil fertility and sustain the production of agro-ecosystems (Brar et al., Reference Brar, Singh, Singh and Kaur2015; Huang et al., Reference Huang, Xie, Zeng, Zhou, Ou, Zhu and Tan2016; Wang et al., Reference Wang, Liu, Zhao, Zhang, Li, Li and Shen2021). However, availability and cost of various chemical and organic fertilizers to the marginal farming community of hilly regions are most challenging and critical issues and needs to be addressed carefully.
The purchase of synthetic fertilizers and pesticide is and will continue to be constrained for the resource-poor farmers and therefore use of locally available farm inputs could be utilized to meet the needs and aspirations of this region (Mahanta et al., Reference Mahanta, Bhattacharyya, Gopinath, Tuti, Jeevanandan, Chandrashekara, Arunkumar, Mina, Pandey, Mishra and Bisht2013). Regarding the availability of organic manure, due to higher per capita population of livestock in Indian Himalayas than the country average provides unique opportunity to use FYM as a source of organic manure for crop production (Anonymous, 2011, 2012). In addition, application of FYM is favoured over other types of organic manure due to its rapid decomposition rate as compared to other sources (Dhaliwal et al., Reference Dhaliwal, Sharma, Shukla, Gupta, Verma, Kaur, Behera and Singh2023). Use of organic manure adequately supplies macro and micro plant nutrients along with greater soil water holding capacity which results in better crop productivity and profitability (Nanda et al., Reference Nanda, Sravan, Singh and Singh2016; Majhi et al., Reference Majhi, Rout, Nanda and Singh2021; Parihar et al., Reference Parihar, Panday, Meena, Kumar, Meena, Choudhary, Singh, Bisht, Kant and Pattanayak2021). Conversely, in several studies it is reported that organic application may reduce the yield level in comparison to mineral fertilization (MacRae et al., Reference MacRae, Hill, Mehuys and Henning1990; Gopinath et al., Reference Gopinath, Saha, Mina, Pande, Srivastva and Gupta2009). The reduction in crop yield due to organic fertilization has been attributed to their lower nutrient content and slow nutrient release (Geng et al., Reference Geng, Cao, Wang and Wang2019; Liu et al., Reference Liu, Du, Li, Han, Li, Zhang, Li and Liang2022). Other than compromising the crop yield, organic manure application has several practical problems including bulky nature, labour-intensive and transportation cost (Case et al., Reference Case, Oelofse, Hou, Oenema and Jensen2017; Li et al., Reference Li, Jiao, Yin, Li, Wang, Zhang, Zheng, Hong, Zhang, Xie and Li2021). Therefore, several studies have advocated for an integrated use of organic and inorganic fertilizers by partial substitution of recommended dose of chemical fertilizers with organic manure (Cen et al., Reference Cen, Guo, Liu, Gu, Li and Jiang2020; Lv et al., Reference Lv, Song, Giltrap, Feng, Yang and Zhang2020). However, research studies are needed to ascertain or fine-tune the combination, rate and application timing of organic and inorganic fertilizers for achieving the sustainable crop yield and improving the soil quality.
Nutrients and water use are complementary to each other for optimizing the plant growth. Balanced plant nutrition improves water productivity by increasing root development and regulating stomatal functioning (Penning de Vries and Djiteye, Reference Penning de Vries and Djiteye1982; Drechsel et al., Reference Drechsel, Heffer, Magen, Mikkelsen and D2015). Recently, Wang et al. (Reference Wang, Yan, Zhang, Zhang and Chen2020) reported that organic manure input enhanced yield and water-use efficiency (WUE) by 8.9 and 5.8%, respectively. There is an acute shortage of irrigation water in the mountains despite the fact that they are considered as water towers of earth. Therefore, suitable water conservation measures are necessary to reduce the crop water demand under irrigated conditions and use this additional water as supplementary irrigation during lean period and to expand the irrigated area for sustainable food production system (Panday et al., Reference Panday, Choudhary, Singh, Meena, Mahanta, Yadav, Pattanayak and Bisht2018). It is estimated that approximately 40% increment in the WUE of existing agriculture practices would be enough to fulfil the water demand for the next 25 years to meet the future food requirement (Singh et al., Reference Singh, Kundu and Bandyopadhyay2010). Similarly, other studies confirmed greater incremental return of fertilization when irrigation is not limiting. Therefore, integrated use of nutrients, water and soil is critical for sustainable and profitable production systems. However, the response of integrated and balanced use of inputs to agro-ecosystem cannot be predicted precisely using short duration field studies.
In this regard, LTFEs provide a systematic and comprehensive overview to optimize the crop, soil and climatic variables for higher and sustainable agricultural production (Rasmussen et al., Reference Rasmussen, Goulding, Brown, Grace, Janzen and Korschens1998). Such a long-term experiment is the most realistic approach to evaluate the productivity and sustainability of various agriculture practices (Johnston and Poulton, Reference Johnston and Poulton2018). The findings of various LTFEs located in different agro-ecosystems revealed that continuous cultivation of cereal–cereal based cropping systems reduced the overall productivity of the system (Shahid et al., Reference Shahid, Nayak, Shukla, Tripathi, Kumar, Mohanty, Bhattacharyya, Raja and Panda2013; Ram et al., Reference Ram, Singh and Sirari2015; Bhattacharyya et al., Reference Bhattacharyya, Pandey, Gopinath, Mina, Bisht and Bhatt2016; Sharma et al., Reference Sharma, Singh, Mandal, Kumar, Alam and Keesstra2017). In this regard, legume–cereal-based cropping systems such as soybean–wheat system provided higher profitability and productivity in the mid-Himalayas and indicated the relative importance of legumes to maintain the productive potential of agro-ecosystems (Kundu et al., Reference Kundu, Bhatnagar, Prakash, Joshi and Koranne1990). Further Ved Prakash et al. (Reference Ved Prakash, Ghosh, Singh and Gupta2002) revealed that soybean–wheat cropping system (SWCSs) in the mid-Himalayas sustain effectively even under limited input application. However, balanced fertilization in such a legume–cereal based system improved their production rate from subsistence to surplus level without depleting the soil nutrients. Therefore after considering and reviewing the background information related to cost of chemical fertilizers, practical applicability of organic manure and existing fertilization practice followed by hill farmers, the present investigation was undertaken with the hypothesis that limited but continuous use of balanced fertilization would provide greater yield advantage than intensive chemical fertilization and maintain productivity, profitability and sustainability of cereal–legume rotation in the long term. Our objective was to investigate how organic and inorganic fertilization practices affect productivity, profitability and WUE of legume–cereal-based cropping systems and whether limited application of such fertilization is sufficient to support the production level in the long term.
Materials and methods
Experimental site
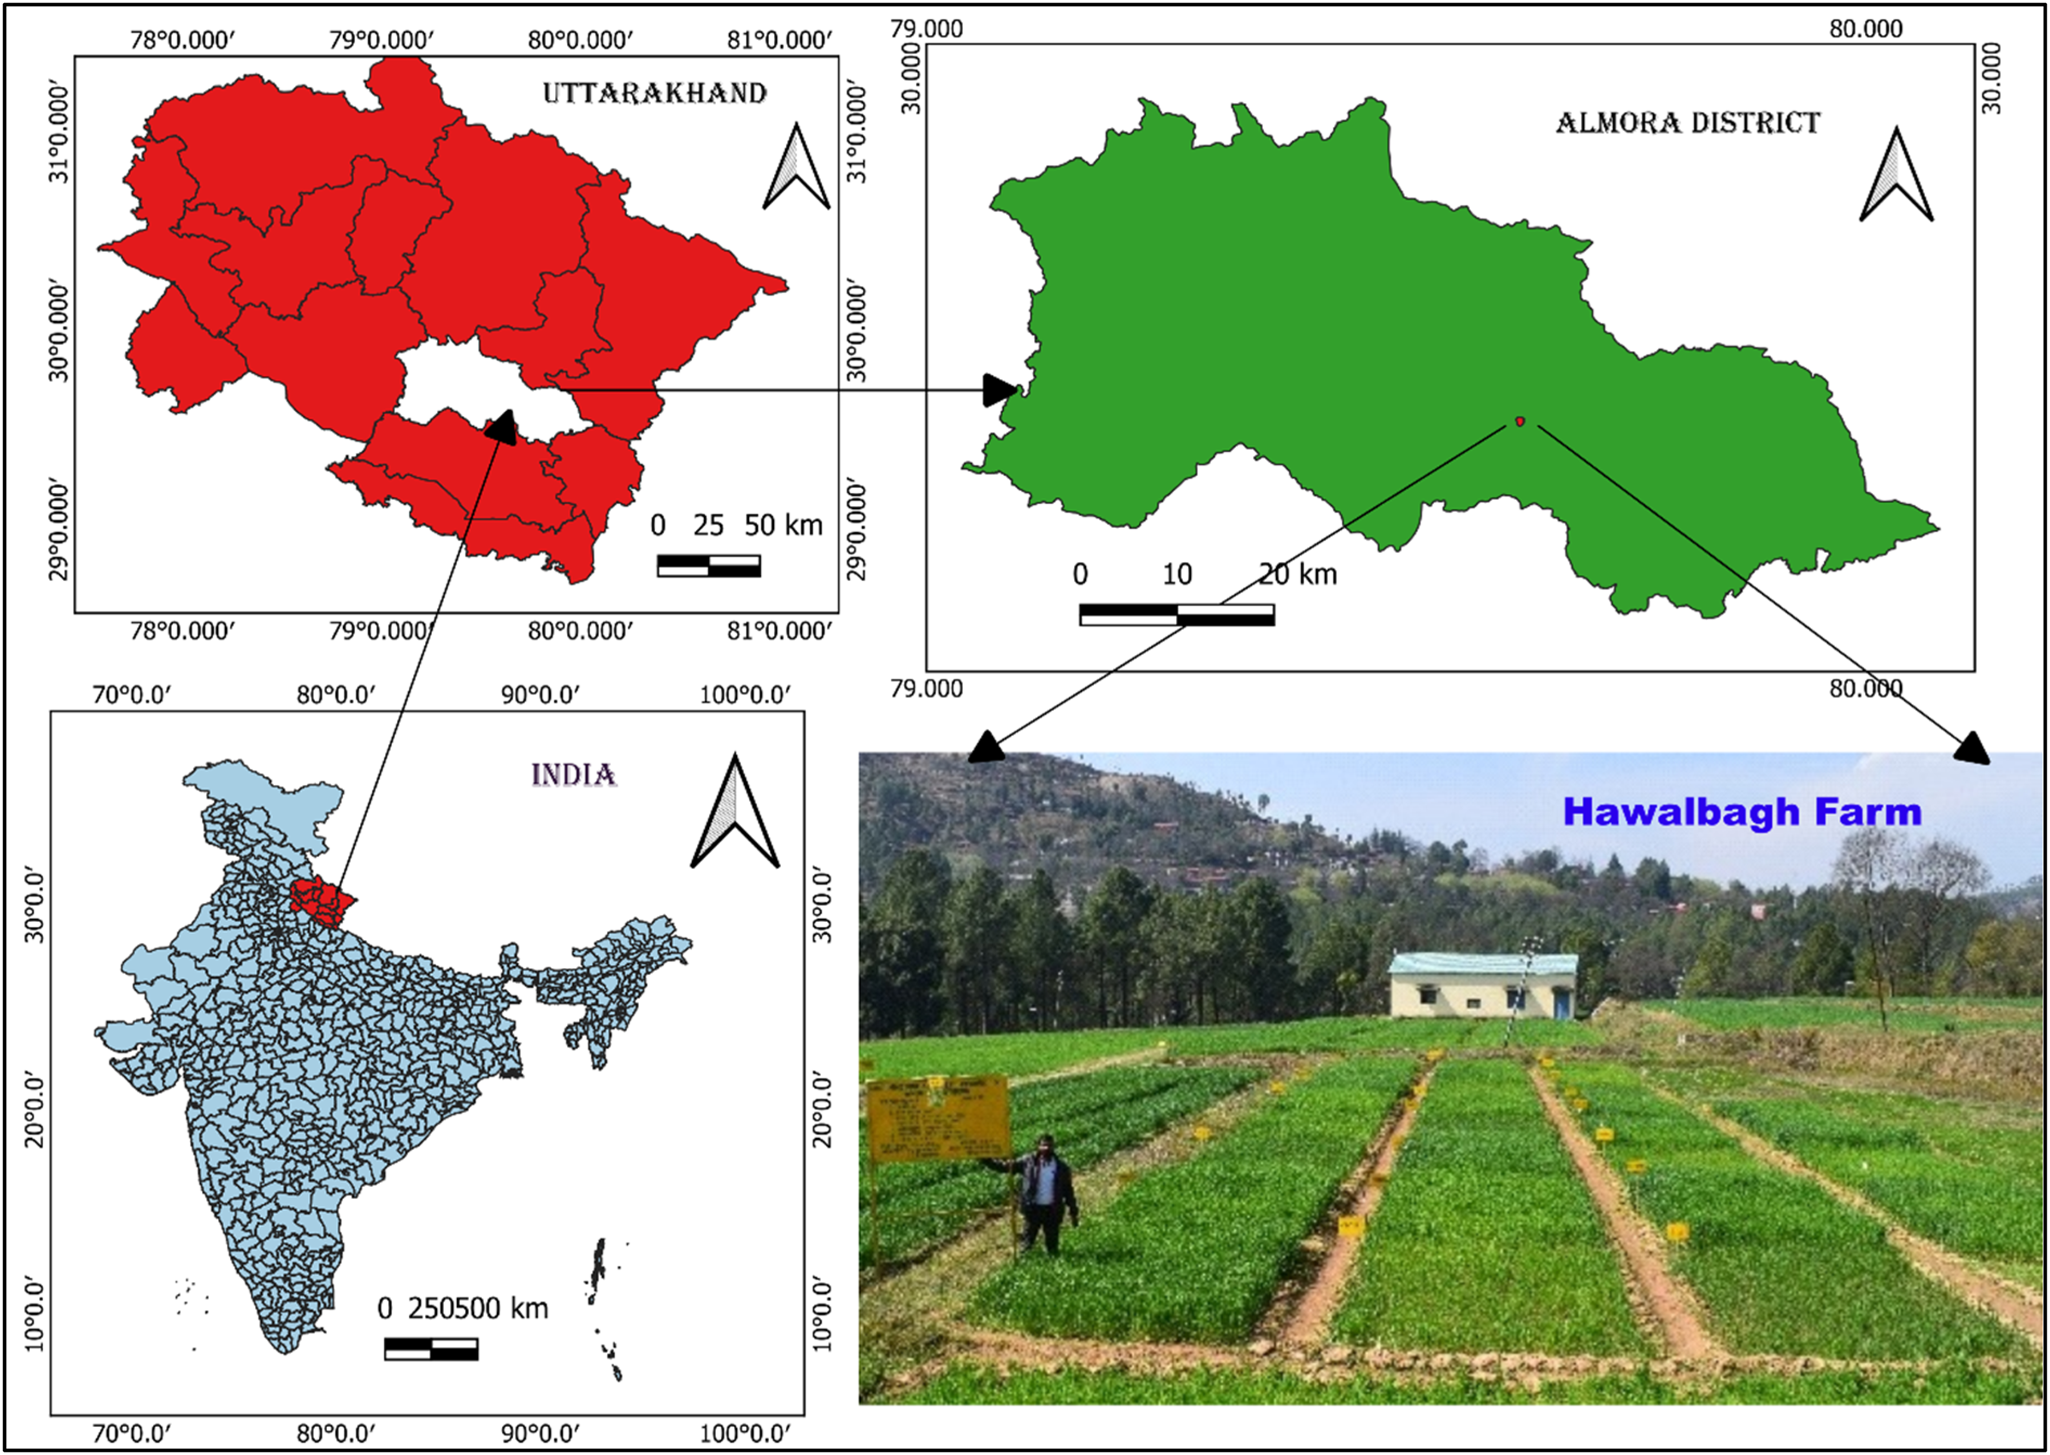
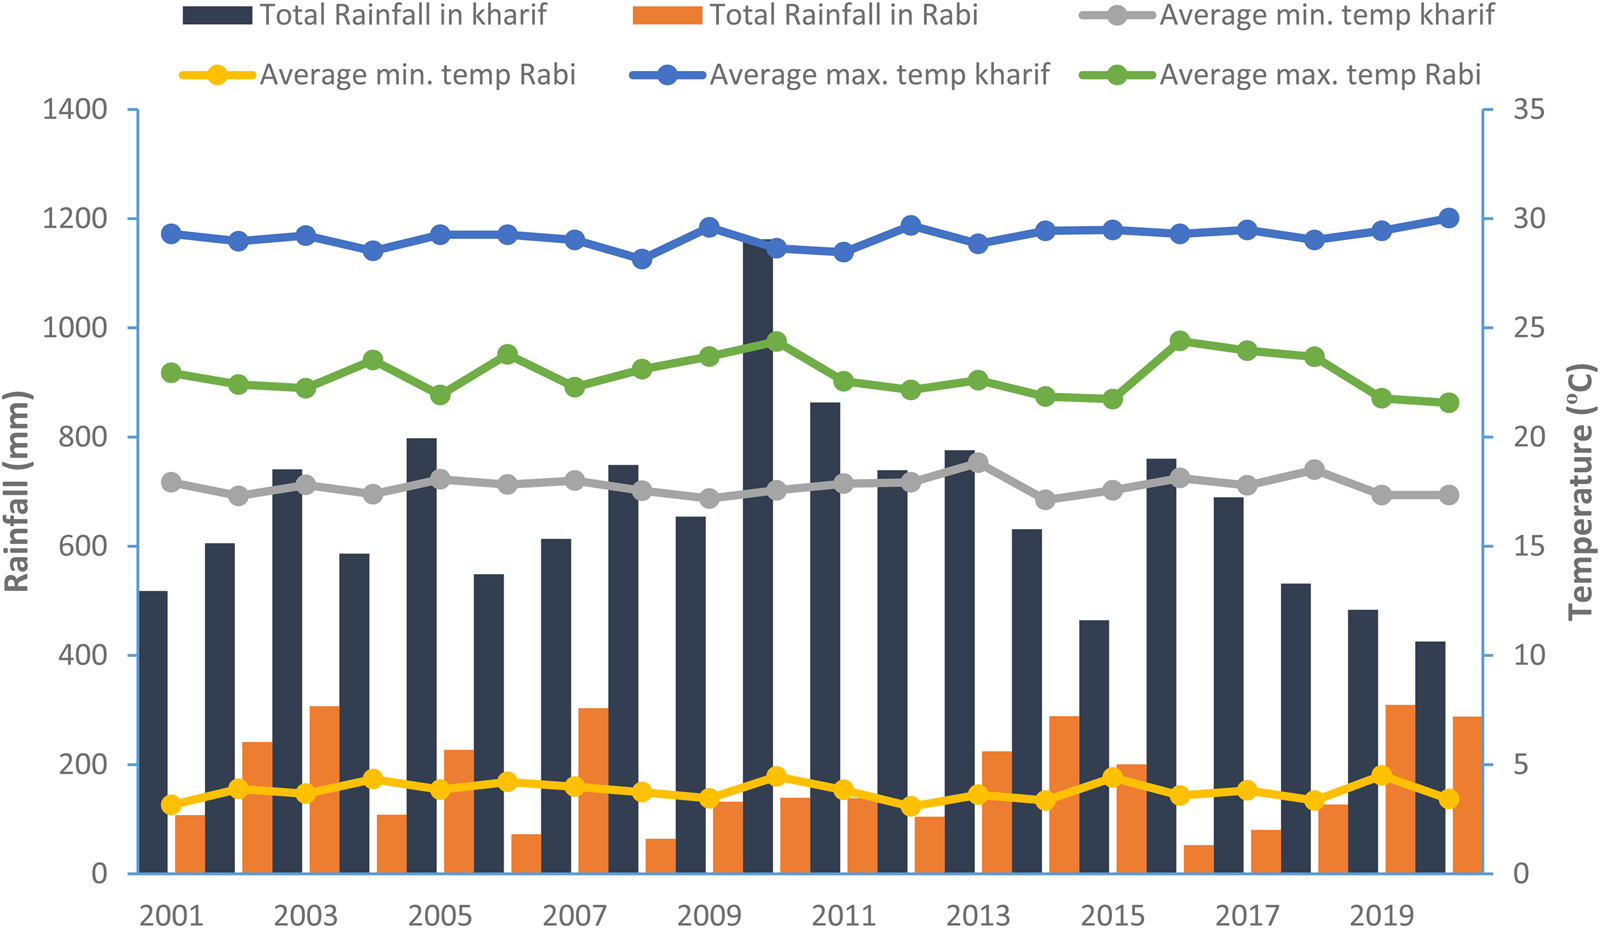
The present study was carried out at the experimental farm of ICAR-Vivekananda ParvatiyaKrishi Anusandhan Sansthan, Hawalbagh, Almora, Uttarakhand, India in 1995–96 (Fig. 1). The experimental site is located at 29°38′11.36″N, 79°37′44.52″E and 230.7 m above sea level, has sub-temperate climatic conditions with mean annual temperature of 18°C and average annual rainfall of 1005 mm of which, major portion is received during June–October during the kharif season. The weather data such as rainfall and temperature variables from 2001 to 2020 of the study region are presented in Fig. 2. The initial soil properties of the study region are given in Table 1.
Geographical location of the study area.
Climatic variation over the years during kharif (June–October) and rabi (November–April) seasons at Hawalbagh, Almora.
Initial soil properties (starting year 1995) of experimental site
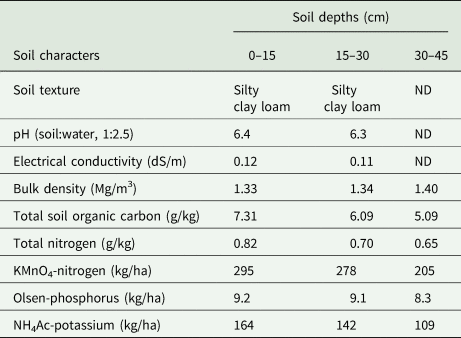
ND, not determined.
Experimental details
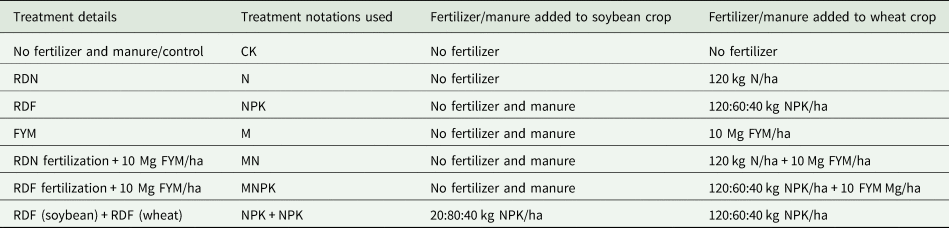
For the present study, 20 years of yield data of the period 2001–20 were obtained from the irrigated soybean–wheat system. The experiment was laid out in factorial randomized block design and comprises totally seven treatments (Table 2) with four replications and each experimental unit has an average plot size of 15 m2. Nitrogen (N), phosphorus (P) and potassium (K) were added through urea, diammonium phosphate ((NH4)2HPO4) and muriate of potash (KCl), respectively. Well decomposed organic manure, i.e. FYM prepared from cow dung and urine was applied in the respective treatments at the rate of 10 tonnes/ha considering the fresh weight of the manure. Further chemical analysis of applied FYM revealed that it contains macro (N, P and K as 10.4, 5.10 and 8.01 g/kg, respectively) and micro nutrients (Fe, Mn, Zn and Cu as 4800, 287, 265 and 42 mg/kg, respectively) with a C:N ratio of 27:1. Treatments were imposed or applied in wheat crop during the rabi (November–April) season only while kharif (June–October) crop, i.e. soybean was grown on residual fertility of the preceding crop. However, the treatment NPK + NPK received recommended dose of fertilizer (RDF) in both the seasons. The RDF is developed and validated by research institutes of this region (ICAR-VPKAS, Almora and G. B. Pant University of Agriculture and Technology, Pantnagar) and further considered for developing package of practices by State Department of Agriculture. Phosphorus and potassium fertilizers were applied as basal during sowing while nitrogen fertilizer, i.e. urea divided in two equal splits. First split was given as basal along with P and K fertilizers while the other split after 30–35 days after sowing or along with first irrigation. During initial years VL-421 variety was used for wheat which was later replaced by VL-616 during 2002–03 and then by VL-804 during 2004–05. Seeds were sown manually at the rate of 100 kg/ha in 20 cm apart rows and 5–6 cm deep in the first half of November. In the month of May crop becomes matured and ready to harvest from field. For soybean VL Soya-2 variety was used with a seed rate of 80–100 kg/ha. The seeds of the mentioned variety of soybean were sown in the last of June and harvested the crop in the first week of October. After harvesting and thrashing, crop straw is mainly used as fodder material in the Almora region due to fodder shortage and managed to fetch 6.02 US$/100 kg.
Treatment details of the long-term irrigated SWCSs
Economic analysis
The economics was estimated using 20 year yield data (2001–20) from various organic and inorganic treatments of long-term SWCS. The calculations were made using constant market price of the year 2020 of various inputs applied during crop cultivation. The gross return was computed using yield component and respective selling price which will be minimum support price for grain yield (as decided by the Government of India) and prevailing market price for straw or biomass yield (6.02 US$/100 kg) of the year 2020. Both the variables, i.e. gross return and cost of cultivation were used for the estimation of net return as given in equation (3):



The net and gross return values are expressed in US$/ha.
Water-expense efficiency
Water-expense efficiency (WEE) was computed by using crop yield and total water consumption of crop which comprises irrigation water, rainfall and profile moisture (as determined for three depths: 0–15; 15–30; 30–45 cm using the gravimetric method) as shown in equation (4).
Total water consumption was computed using weekly database of crop duration. Regarding runoff losses, it is supposed to be negligible as all the treatment units were constructed with 20 cm height with permanent layout design of the experiment.
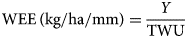
where Y is the yield (kg/ha) and TWU is the total water used by the crop (mm) (irrigation + rainfall + profile moisture use).
Water-use efficiency

where Y is the yield (kg/ha) and TEWU is the total effective rainfall + irrigation + profile moisture use. Effective rainfall is calculated by summing the weekly potential evapotranspiration divided by the corresponding rainfall, multiplied by 100. If this value exceeds 100 in any given week, it is capped at 100. The seasonal average of these adjusted values is multiplied by the total rainfall and divided by 100.
Production and economic efficiency
Production and economic efficiency are the expression of yield and net return on daily basis. For computing both the indices following formulas are used:


Statistical analysis
Statistical analysis was performed using the standard statistical procedure for agricultural research as described by Gomez and Gomez (Reference Gomez and Gomez1984). All the collected data were analysed using analysis of variance with the SPSS-16 statistical tool. The separation of means was done on the basis of the standard deviation of treatments and compared according to the Tukey's honestly significant difference (HSD) test at the 5% level of significance (P < 0.05).
Trend analysis was computed using the simple linear regression analysis of respective variables over the time period:

where Y is the grain yield (kg/ha) or other related variable, a is a constant, t is the year and b is the slope or magnitude of the trend.
Results
Crop yield
Long-term effect of organic and inorganic fertilization on yield of SWCSs is presented in Table 3. Overall average yield rate of both wheat and soybean crops at experimental field varied from 1.64 to 4.97 and 1.37 to 2.69 Mg/ha, respectively. Among various treatments, combined application of FYM (M) along with recommended N (MN) or NPK (MNPK) provided significantly higher mean grain yield of wheat than sole application of organics and inorganics. In numerical terms, highest mean wheat grain yield was found in MNPK (4.97 Mg/ha) which was ~15, 26, 28, 83, 112 and 203% higher than MN, NPK + NPK, NPK, M, N and CK, respectively. The long-term yield trend (Fig. 3) showed that continuous application of FYM along with chemical fertilizers improved yield rate and provided a significant positive yield trend of 30 kg/ha over the year while use of only nitrogenous fertilization reduced the yield trend significantly by 39 kg/ha/year.
Grain yield of wheat and soybean in different fertilization treatments from 2001 to 2020
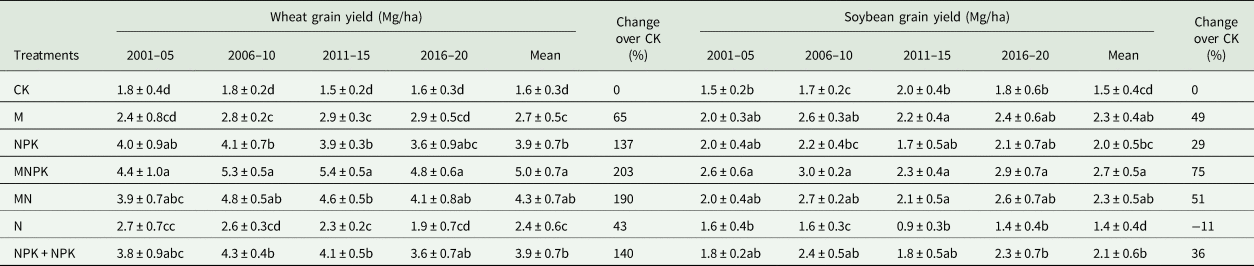
CK, control; M, 10 Mg FYM/ha; NPK, recommended dose of fertilizers; MNPK, recommended dose of fertilizers + 10 Mg FYM/ha; MN, recommended dose of nitrogen + 10 Mg FYM/ha; N, recommended dose of nitrogen; NPK + NPK, recommended dose of fertilizers in both soybean and wheat crops.
Data (mean ± SD) followed by a similar letter within a column for a particular treatment are not significantly different at P ≤ 0.05 according to Tukey's HSD.
Yield change trend of SWCS during 2001–20. *Significant at P < 0.05; **significant at P < 0.01.
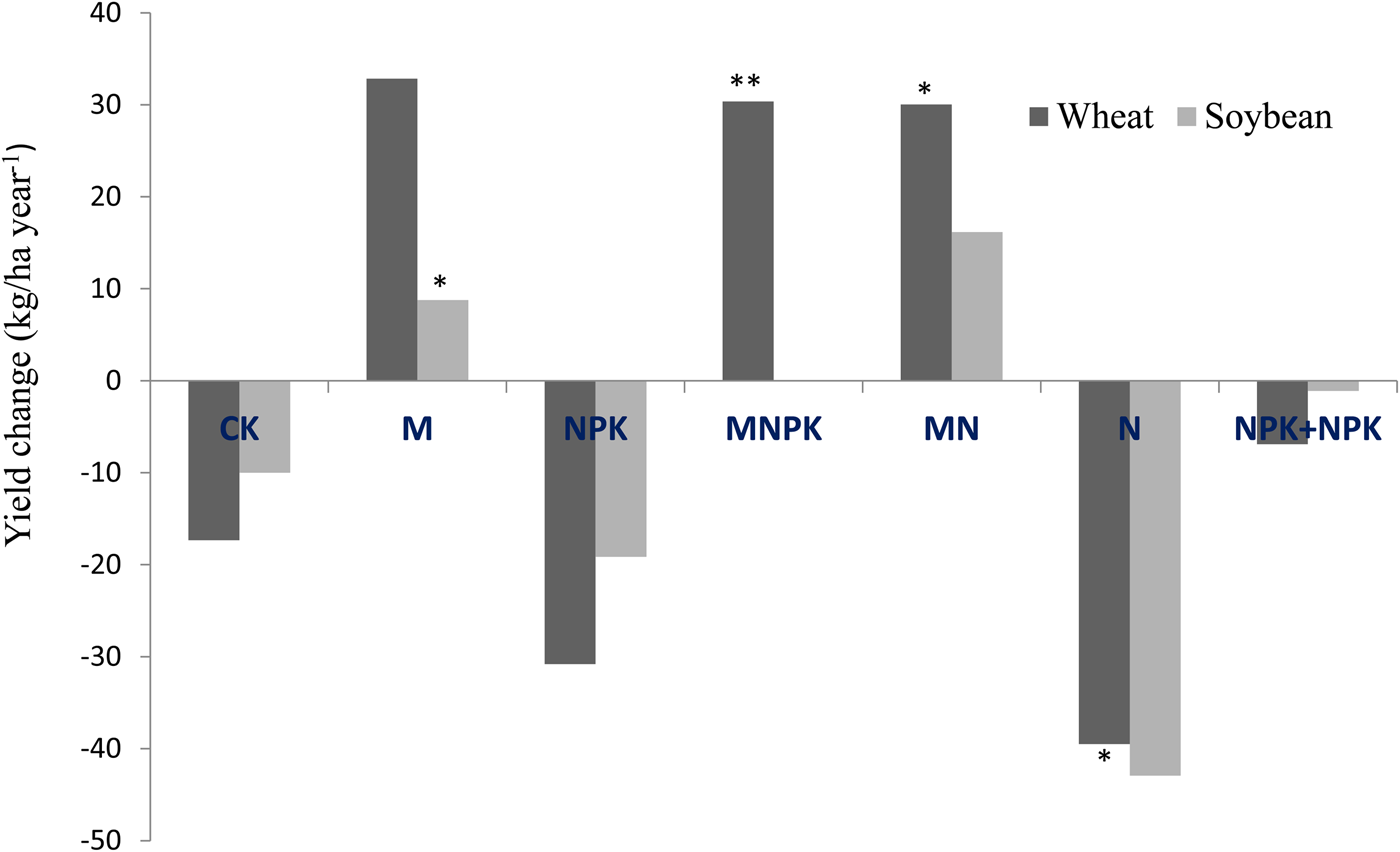
Similar to wheat, soybean has also followed a similar trend but here residual effect of the sole application of FYM increased the soybean yield positively (2.30 Mg/ha) and provided statistical similar results to MNPK (2.69 Mg/ha) and MN (23 Mg/ha). Further, it has been observed that sole application of N fertilizers has deleterious effect on soybean productivity and reduced their yield rate by 42 kg/ha/year which is even higher than control plots (Fig. 3). However, deleterious effects of N fertilizer application can be overturned into positive yield trend by their combined application with FYM.
Irrespective of the source of fertilization, nutrient application improves the yield of both crops in comparison to control. Due to NPK fertilization, the increment in yield of wheat and soybean over CK ranged from 137 to 140% and 29 to 36%, respectively. Similarly organic manure application provided 49 and 69% increment over CK in soybean and wheat crops, respectively. However, the combined use of both organic and chemical fertilizers showed highest increment over CK, i.e. 51–75 and 190–203% for soybean and wheat crop, respectively. In contrast to NPK and FYM application, yield advantages of sole N fertilizers were observed in wheat crop only while their residual effect on soybean crop is detrimental and reduced the yield rate in comparison to CK. However, mean yield data suggested that under continuous cropping without fertilization conditions, our experimental soil has potential to produce 1.64 and 1.54 Mg/ha grain yield of wheat and soybean, respectively.
Water-use and -expense efficiency
WEE is described as a use of total water for the production of unit grain yield. The data related to WEE of wheat and soybean are presented in Table 4. In wheat and soybean, mean WEE ranged from 3.70 to 11.5 kg/ha/mm and 3.15 to 4.30 kg/ha/mm, respectively. In wheat, conjoint application of manure (MN and MNPK) provided 14–57% and 32–83% higher WEE than sole application of chemical and organic manure, respectively. Continuous cropping without fertilizer recorded lowest WEE (3.70 kg/ha/mm) and reduced it significantly than other treatments. In contrast to wheat, residual applications of manure provided higher WEE (5.29 kg/ha/mm) than residual and direct application of chemical fertilizers (4.75 kg/ha/mm) in soybean. Moreover, residual effect of manure either in sole or conjoint application along with inorganics provided significantly higher WEE than only inorganics in soybean.
WEE of wheat and soybean in different fertilization treatments from 2001 to 2020
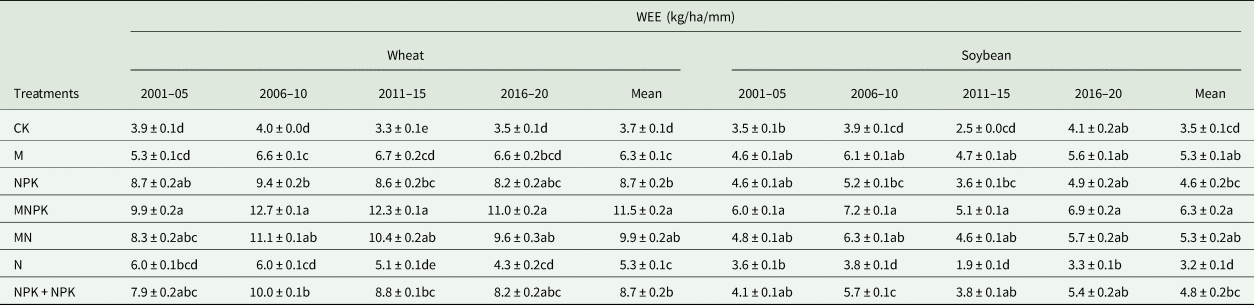
CK, control; M, 10 Mg FYM/ha; NPK, recommended dose of fertilizers; MNPK, recommended dose of fertilizers + 10 Mg FYM/ha; MN, recommended dose of nitrogen + 10 Mg FYM/ha; N, recommended dose of nitrogen; NPK + NPK, recommended dose of fertilizers in both soybean and wheat crops.
Data (mean ± SD) followed by similar letter within a column for a particular treatment are not significantly different at P ≤ 0.05 according to Tukey's HSD.
The data pertaining to WUE are presented in Table 5. Over the year, application of organic manure with N (MN) and NPK (MNPK) significantly improved the WUE than other treatments in wheat. The mean WUE in wheat followed the order: MNPK > MN > NPK + NPK > NPK > M > N > CK. However, soybean also followed a trend similar to wheat but in soybean, residual effect of manure (M) as sole or with chemical fertilizers (MNPK, MN) had provided statistically similar results. The highest WUE was reported in MNPK (6.30 kg/ha/mm) followed by MN (19%), M (19), NPK + NPK (31), NPK (40), CK (80) and N (97).
WUE of wheat and soybean in different fertilization treatments from 2001 to 2020
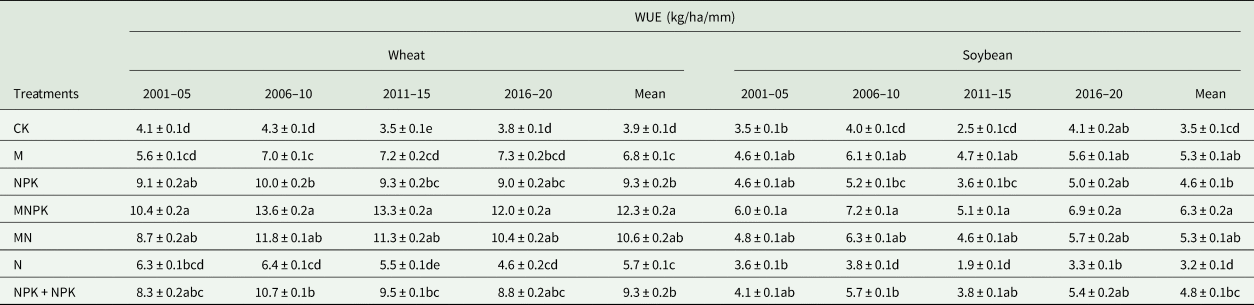
CK, control; M, 10 Mg FYM/ha; NPK, recommended dose of fertilizers; MNPK, recommended dose of fertilizers + 10 Mg FYM/ha; MN, recommended dose of nitrogen + 10 Mg FYM/ha; N, recommended dose of nitrogen; NPK + NPK, recommended dose of fertilizers in both soybean and wheat crops.
Data (mean ± SD) followed by similar letter within a column for a particular treatment are not significantly different at P ≤ 0.05 according to Tukey's HSD.
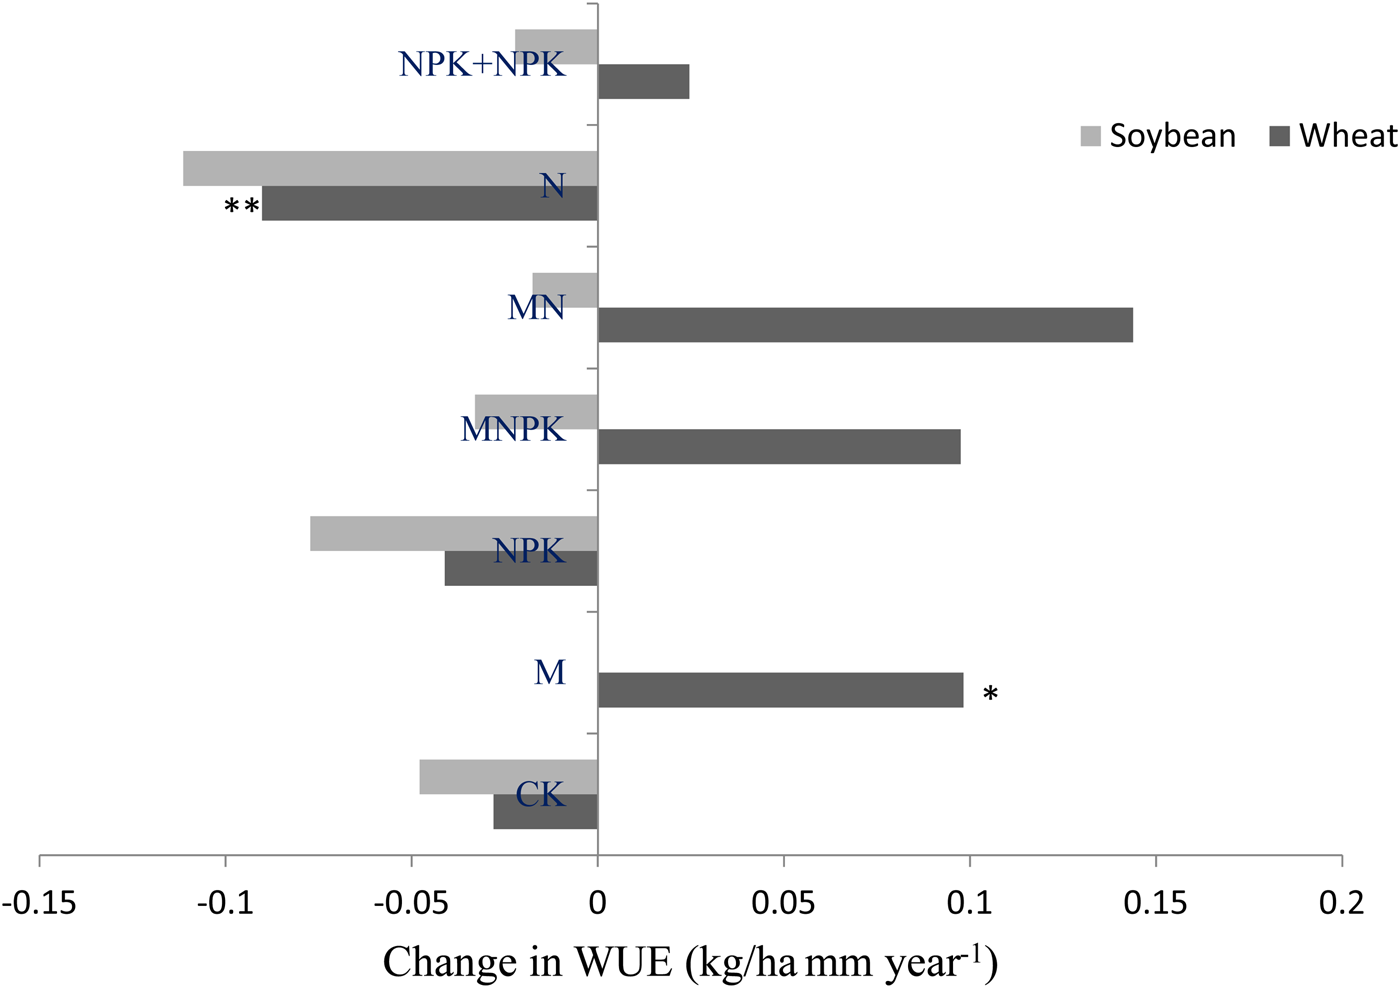
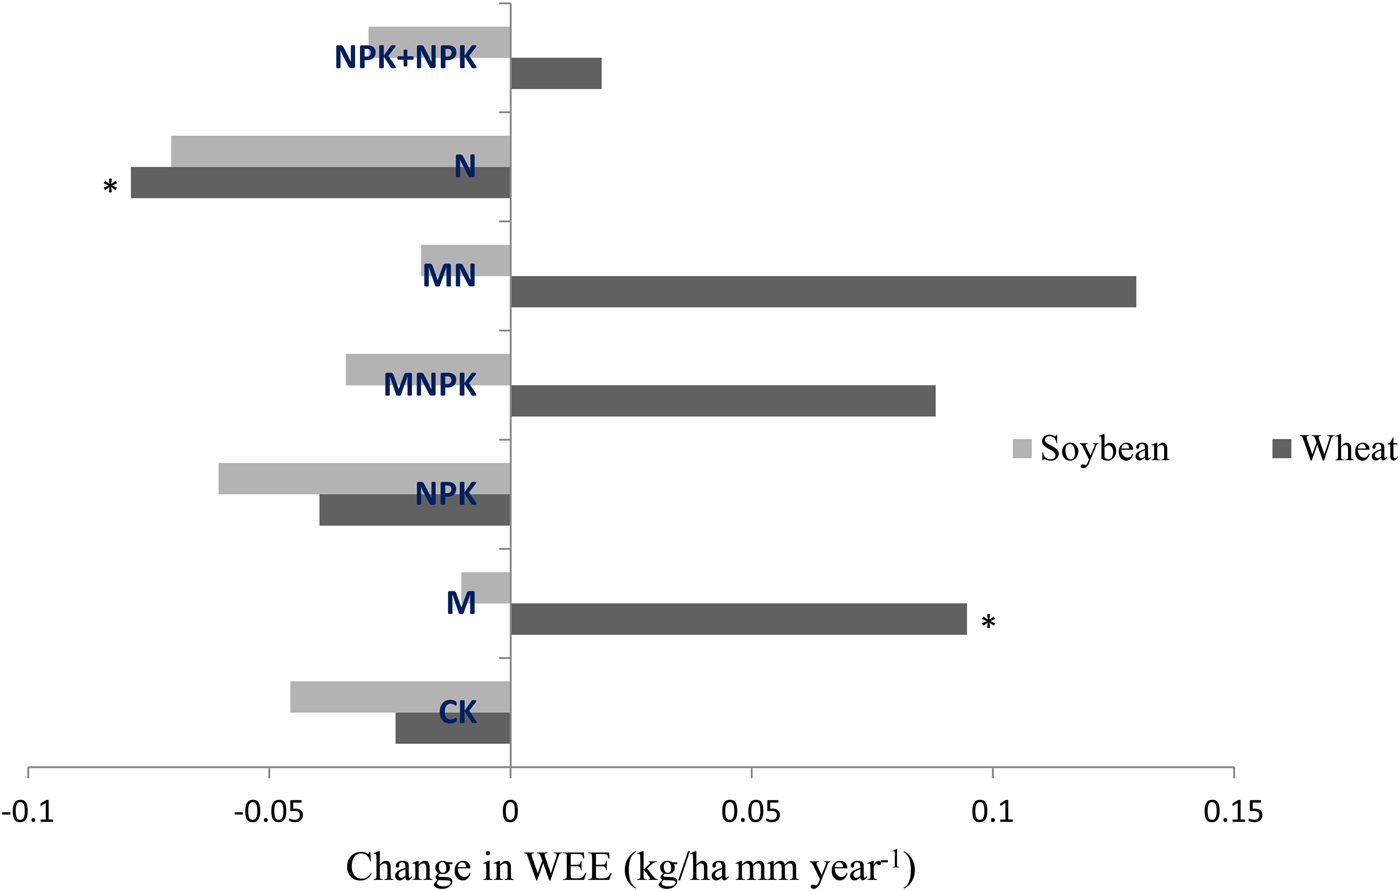
Both the efficiency (WEE and WUE) fluctuated over the year and showed a similar trend. In wheat, WUE has shown an increasing trend with the application of manure as alone or in combination with nitrogen and NPK while decreasing in sole N, NPK and control plots. While in soybean, all the treatments showed a negative trend and reduced both the efficiency with the time. Moreover, rate of reduction was found to be highest in N, NPK and control with 11.1, 7.72 and 4.79 kg/ha/mm/year in wheat and 7.03, 6.05 and 4.56 kg/ha/mm/year in soybean, respectively (Figs 4 and 5).
Over the year change in WUE of SWCS during 2001–20. *Significant at P < 0.05; **significant at P < 0.01.
Over the year change in WEE of SWCS during 2001–20. *Significant at P < 0.05; **significant at P < 0.01.
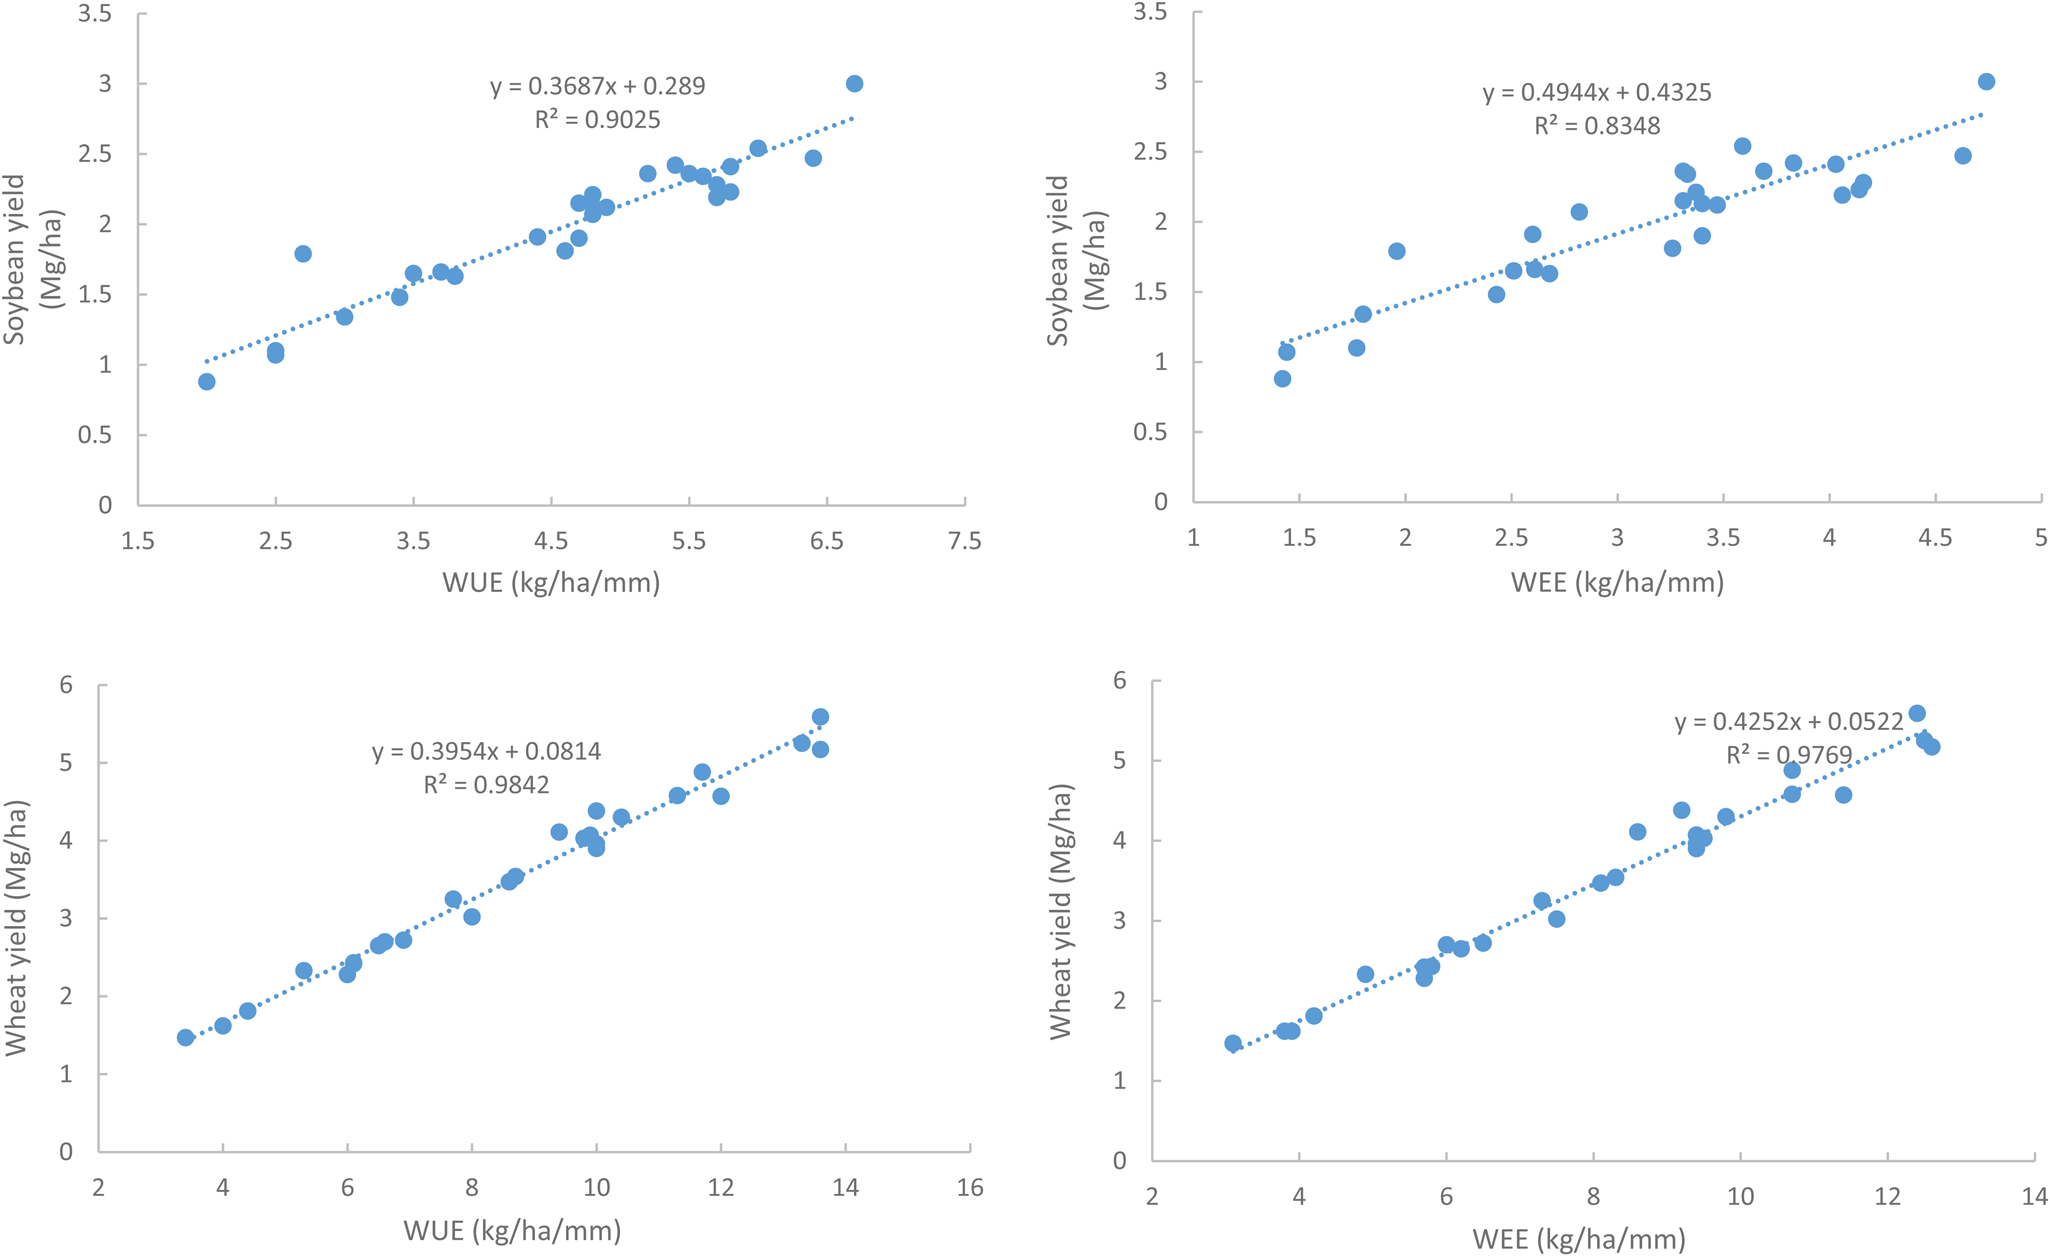
Moreover, WUE and WEE were correlated with grain yield of wheat and soybean as shown in Fig. 6 and both the efficiencies were positively correlated with yield rate with a high correlation coefficient, i.e. 0.90 and 0.83 for soybean and ~0.98 for wheat.
Relationship between WUE, WEE and grain yield of SWCS.
Production and economic efficiency
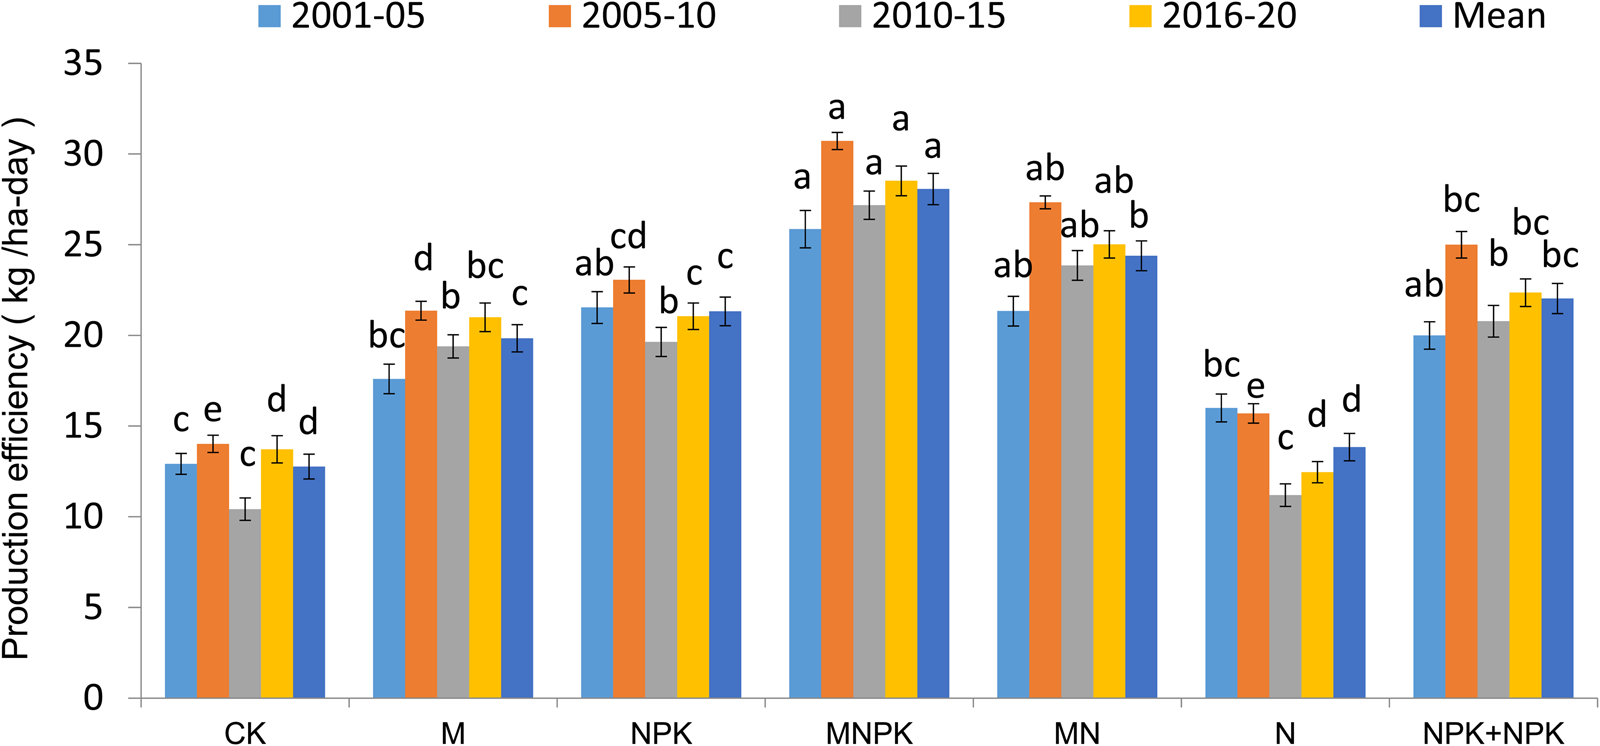
The data pertaining to production and economic efficiency are presented in Figs 7 and 8, respectively. Data suggested that application of only N fertilizers had provided production efficiency similar to control plots while their combined application with P and K fertilizers significantly improved the same. However, single application of NPK in wheat crop (21.3 kg/ha/day) provided statistical similar results to intensive application of fertilizers in both the seasons (22 kg/ha/day). In comparison to sole application of chemical and organic manure, their combined use (MNPK) provided highest production efficiency, i.e. 28 kg/ha/day which is approximately 32–41% higher than their individual use.
Effect of different nutrient supply options on production efficiency in the long-term study. Data (mean ± SE) followed by the same lowercase letter do not show significant differences at P ≤ 0.05 according to Tukey's HSD.
Effect of different nutrient supply options on economic efficiency in the long-term study. Data (mean ± SE) followed by the same lowercase letter do not show significant differences at P ≤ 0.05 according to Tukey's HSD.
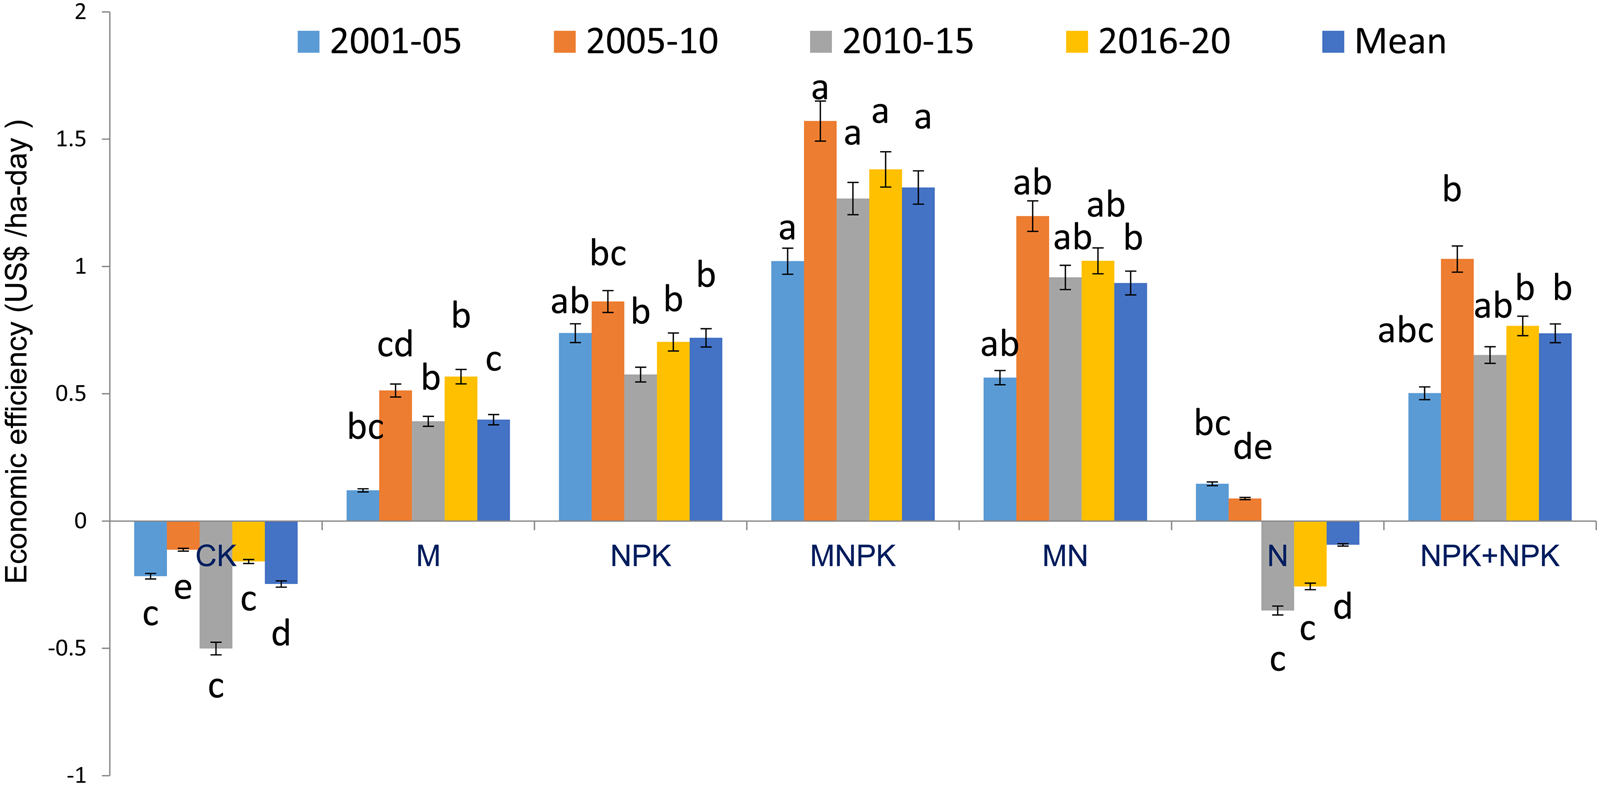
The economic efficiency had followed almost a similar trend to production efficiency and ranged from −0.25 to 1.31 US$/ha/day. The sole application of N fertilizers provided negative economic efficiency of −0.09 US$/ha/day which is statistically equivalent to control plots. However, combined use of N fertilizers along with 10 tonnes/ha FYM improved the economic efficiency significantly from −0.09 to 0.93 US$/ha/day. Further data revealed that use of NPK fertilizers demonstrated ~80% higher economic efficiency than sole organic, i.e. FYM. Moreover, conjoint application of organics and inorganics (MNPK) provided 3.29- and 1.82-fold higher economic efficiency than sole application of organics (M) and inorganics (NPK), respectively. Both the efficiencies are computed on the basis of crop yield and remain influenced significantly by the fertilizer application.
Economical variables such as net return and benefit cost ratio are presented in Table 6. In wheat, net return was ranged from −345 to 584 US$/ha due to various fertilization practices. Application of chemical fertilizers as alone (377 and 407 US$/ha) or along with manure (410 and 584 US$/ha) had provided significantly higher net return than other treatments and control. In soybean, residual effect of manure as alone (M) or along with inorganic fertilizer (MN, MNPK) provided significantly higher net return than other fertilization practices and control. Although, soybean had provided greater economic benefit but showed gradual decline in net return (Fig. 9). In contrast to soybean, wheat had shown a positive trend and found that MN, M, MNPK and NPK + NPK increased net return with the rate of ~1.47, 1.42, 1.36 and 0.19 US$/ha/year respectively while N, NPK and CK had reduced net return at 1.06, 0.65 and 0.60 US$/ha/year, respectively (Fig. 9).
Economics (average of 20 years) of soybean–wheat systems as influenced by various treatments
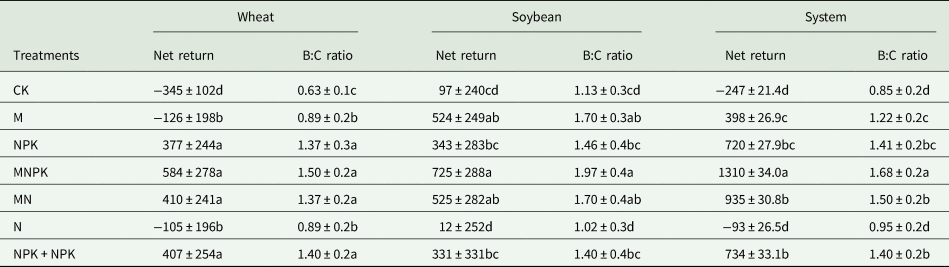
CK, control; M, 10 Mg FYM/ha; NPK, recommended dose of fertilizers; MNPK, recommended dose of fertilizers +10 Mg FYM/ha, MN, recommended dose of nitrogen +10 Mg FYM/ha; N, recommended dose of nitrogen; NPK + NPK, recommended dose of fertilizers in both soybean and wheat crops.
B:C ratio, benefit cost ratio; net return and production cost in US$/ha.
Data (mean ± SD) followed by similar letter within a column for a particular treatment are not significantly different at P ≤ 0.05 according to Tukey's HSD.
Over the year change in net returns of SWCS during 2001–20. *Significant at P < 0.05; **significant at P < 0.01.
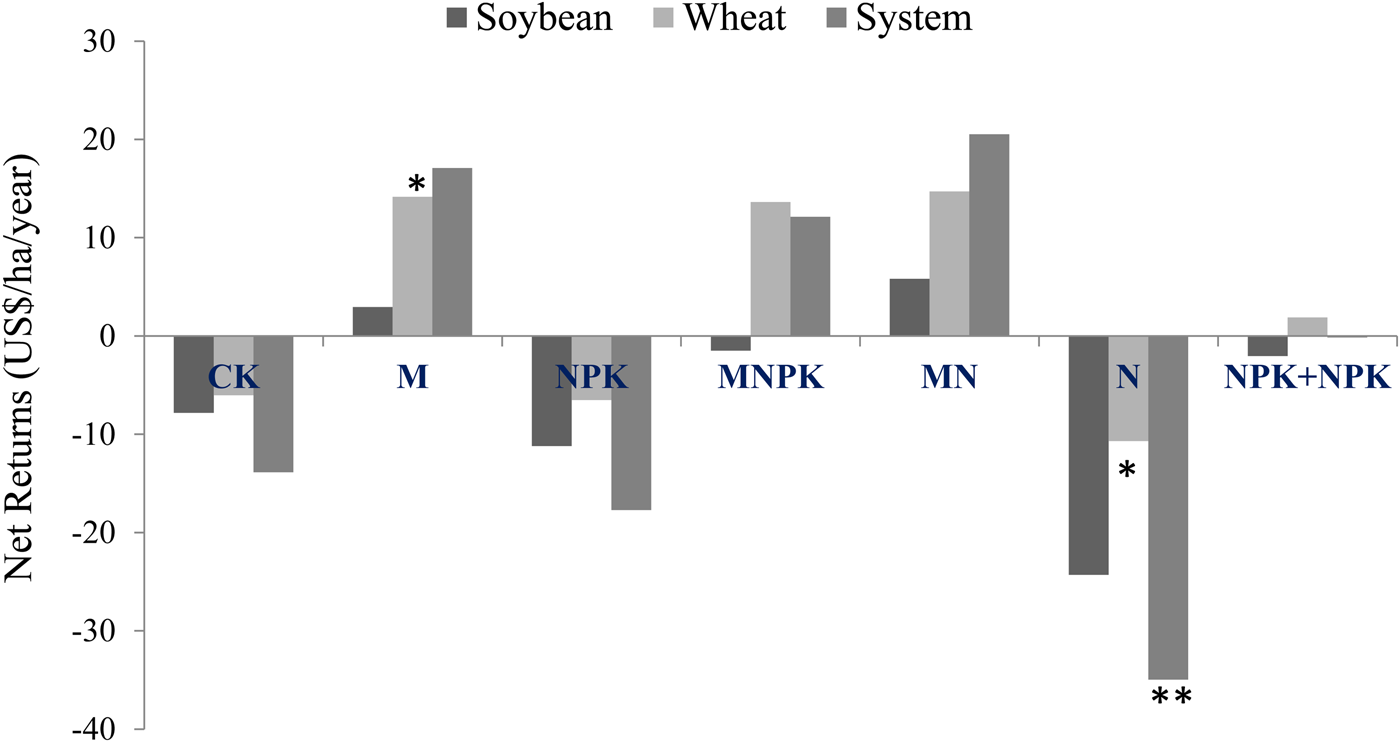
Similarly, economics of soybean–wheat system indicated that conjoint application of organic and inorganics provided significantly higher benefit cost ratio than their sole application and control treatments. The system benefit cost ratio had followed the trend: MNPK > MN > NPK > NPK + NPK > M > N > CK. An almost similar trend was observed for the net return and found that over the year 10 Mg FYM/ha along with 120 kg N/ha (MN) as commonly practiced in hills had increased the same with 2.05 US$/ha/year and found 29 and 70% higher than MNPK and M while N, NPK, CK and NPK + NPK showed a negative trend with 3.50, 1.77, 1.39 and 0.01 US$/ha/year, respectively (Fig. 9).
Discussion
The lower wheat yield with sole organics in comparison to combined application, i.e. MN/MNPK might be explained due to better mineralization of organic manure when applied with mineral nitrogenous fertilizers. The application of mineral nitrogen along with organic manure satisfy the microbial nitrogen demand and accelerate the carbon mineralization process by narrow down the carbon–nitrogen ratio in the soil (Green et al., Reference Green, Blackmer and Horton1995; Probert et al., Reference Probert, Delve, Kimani and Dimes2005). Further results show that organic manure application provided greater yield advantage to residual crop (soybean) in comparison to directly fertilized wheat crop. The sole application of organic manure in wheat crop during winter season might take more time to be decomposed due to lower temperature and limited microbial activity (Zerihun and Haile, Reference Zerihun and Haile2017). This gradual decomposition of organic manure may restrict the immediate availability of macro and micro nutrients to the wheat crop and reduced their productivity. On the other hand, slow mineralization/decomposition of FYM results in greater residual effect on succeeding soybean crop and provides higher yield advantage. Therefore use of organic manure (FYM) as alone or along with chemical fertilizers (N, NPK) in the previous crop sustains the soybean production and provides greater yield advantage, even higher than the NPK + NPK treatment where RDF was being applied in both the seasons. However there is larger contrary on direct and residual effect of organic manure in previous publications which is possibly explained by variation in manure quality, mineralization intensity and utilization by a given crop (Minhas et al., Reference Minhas, Dutta and Verma1994; Sharma et al., Reference Sharma, Kaul and Bhardwaj1996; Silva et al., Reference Silva, Lima e Silva, Oliveira and Barbosa e Silva2004, Reference Silva, Silva, de Oliveira, de Sousa and Duda2006).
Moreover, yield trend over the years due to nutrient application clearly explained that organic manure (FYM) application as alone or along with NPK or N in wheat crop exhibited a positive yield trend in both crops while only chemical fertilizer application is a completely unsustainable approach and reduces the crop yield in both seasons in the long term (Fig. 3). These results can be explained due to the residual effect of organic manure application (Shen et al., Reference Shen, Yang, Yao, Wu, Wang, Guo and Yin2007). The residual effect could maintain soil health and sustain the crop yields in subsequent years after manure application ceases. The yield decline in control and chemically fertilized plots (N, NPK, NPK + NPK) might be explained by decline in available soil macro and micro nutrients, soil pH and carbon content due to prolonged imbalanced and nitrogenous fertilizer application (Kumari et al., Reference Kumari, Thakur, Kumar and Mishra2013; Bhattacharyya et al., Reference Bhattacharyya, Pandey, Gopinath, Mina, Bisht and Bhatt2016; Choudhary et al., Reference Choudhary, Panday, Meena, Singh, Yadav, Mahanta, Mondal, Mishra, Bisht and Pattanayak2018; Parihar et al., Reference Parihar, Panday, Meena, Kumar, Meena, Choudhary, Singh, Bisht, Kant and Pattanayak2021). In the same experiment, Choudhary et al. (Reference Choudhary, Panday, Meena, Singh, Yadav, Mahanta, Mondal, Mishra, Bisht and Pattanayak2018, Reference Choudhary, Meena, Panday, Mondal, Yadav, Mishra, Bisht and Pattanayak2021) reported that combined application of organic and inorganic fertilizers (M, MNPK) significantly improved the soil nutrient availability and enhanced soil microbial and enzymatic properties which results in higher and sustainable production of SWCSs.
In the Indian scenario, use of N fertilizers particularly urea application is very popular and practiced commonly under irrigated conditions. However, our findings demonstrate that continuous application of sole N fertilizers provided the highest negative yield trend in both the crops. Nitrogenous fertilization acidifies the soil through the proton generation pathway in nitrification process, conversion of dry-deposited compounds due to oxidation process and loss of basic cations through ion exchange (Zhu et al., Reference Zhu, Liu, Hao, Zeng, Shen, Zhang and De Vries2018; Cai et al., Reference Cai, Xu, Wang, Zhang, Liang, Hou and Luo2019). The soil pH reduction not only increases the potential toxic metals but also hampers the soil microbial diversity and distribution that accelerate the root functions (Stevens et al., Reference Stevens, Dise and Gowing2009). Further average long-term yield data revealed that in comparison to wheat, soybean crop experienced higher yield reduction in sole N-fertilized plots which is due to the fact that development of secondary acidity in such plots may disrupt the symbiotic nitrogen fixation by reducing the activity of rhizobia (Burghardt, Reference Burghardt2020; Oono et al., Reference Oono, Muller, Ho, Jimenez Salinas and Denison2020). However, such negative effects of N fertilizers can be counter-balanced with manure or interactive application of manure with synthetic fertilizers as application of manure strongly and positively affected crop yields by increasing soil organic carbon, soil nutrients and soil pH (Cai et al., Reference Cai, Xu, Wang, Zhang, Liang, Hou and Luo2019). In addition, the ash alkalinity of manure is associated with neutralized soil acidity due to decarboxylation of organic anions and the ammonification of organic N (Xu et al., Reference Xu, Tang and Chen2006; Rukshana et al., Reference Rukshana, Butterly, Xu, Baldock and Tang2013). Such positive effects of combined application of N and organic manure are clearly observed in our study where MN provided yield rate equivalent to MNPK in both wheat and soybean crops and sustain the long-term productivity through a positive yield trend over the years. Interestingly, organic manure (FYM) application along with urea is commonly practiced in hills of north-west Himalayas which realize the importance of age-old traditional knowledge supported by strong scientific background to sustain the production of soybean–wheat system in this region.
Moreover, in the present study, soybean and wheat yield has showed positive and strong correlation with WUE (r 2: ~0.90 and 0.98, respectively) and WEE (r 2: ~0.83 and 0.98, respectively) as shown in Fig. 4. In comparison to soybean, the higher correlation coefficient of wheat yield with WUE and WEE could be due to direct and residual effect of fertilizers and manure in the soils. Our findings were supported by other studies where organic manure application improves water- and nutrient-use efficiency which results in greater yield advantage under MNPK and M plots (Ladha et al., Reference Ladha, Dawe, Pathak, Padre, Yadav, Singh, Singh, Singh, Singh, Kundu and Sakal2003; Hati et al., Reference Hati, Mandal, Misra, Ghosh and Bandyopadhyay2006, Reference Hati, Swarup, Dwivedi, Misra and Bandyopadhyay2007; Pathak et al., Reference Pathak, Byjesh, Chakrabarti and Aggarwal2011). In wheat, nitrogen application has found beneficial for root growth in the cultivated 0–20 cm soil layer (Deng et al., Reference Deng, Shan, Zhang and Turner2004). The increased root system with N-fertilized plots improves the nutrient and water absorption effectively and provides greater crop yield and WUE (Liu et al., Reference Liu, Shan, Deng, Inanaga, Sunohara and Harada1998). Waraich et al. (Reference Waraich, Ahmad, Ashraf and Saifullah Ahmad2011) reported that nutrients like N, K, Mg, B, Zn and Si improve the photosynthetic rate by regulating stomatal opening and antioxidant enzymes activity. However, other nutrients such as P, K, Mg and Zn improve water intake rate by improving root development. Application of organic manure along with and N and NPK improves both macro and micronutrient contents in soil and improves overall crop growth and provides other indirect benefits which results in greater WUE. Further, Wang et al. (Reference Wang, Yan, Zhang, Zhang and Chen2020) reported 5.80% higher WUE with the application of organic manure. This increment in WUE could be described due to improved porosity and reduction in water penetration resistance which results in greater soil water infiltration (Celik et al., Reference Celik, Gunal, Budak and Akpinar2010; Chivenge et al., Reference Chivenge, Vanlauwe, Gentile and Six2011; Hou et al., Reference Hou, Gao, Xie, Li, Meng, Kirkby, Römheld, Müller, Zhang, Cui and Chen2012; Zhao et al., Reference Zhao, Yan, Qin and Xiao2014).
The higher economic return with conjoint use of organic and inorganic fertilizer than sole application of chemical fertilizer suggested that long-term balanced fertilization provided greater yield advantages and results in higher economic benefits (Mahanta et al., Reference Mahanta, Bhattacharyya, Sahoo, Tuti, Gopinath, Arunkumar, Mina, Pandey, Bisht, Srivastva and Bhatt2015) which is earlier reported in soybean–wheat systems (Bhattacharyya et al., Reference Bhattacharyya, Kundu, Prakash and Gupta2008; Mubarak and Singh, Reference Mubarak and Singh2011; Singh et al., Reference Singh, Pandey, Nanda and Gupta2019) and other studies also (Pathak et al., Reference Pathak, Byjesh, Chakrabarti and Aggarwal2011). Organic manure along with chemical fertilizer improves soil physical conditions, microbial activity and nutrient availability with minimum nutrient loss (Singh et al., Reference Singh, Singh, Ladha, Khind, Gupta, Meelu and Pasuquin2004; Hati et al., Reference Hati, Mandal, Misra, Ghosh and Bandyopadhyay2006; Kundu et al., Reference Kundu, Bhattacharyya, Prakash, Gupta, Pathak and Ladha2007) which in turns provides higher production and economic advantages on a daily basis. Similarly Panday et al. (Reference Panday, Choudhary, Singh, Meena, Mahanta, Yadav, Pattanayak and Bisht2018) reported that NPK + FYM had provided highest economic efficiency (92.6 and 157 INR/ha/day) and production efficiency (19 and 24 kg/ha/day) under rainfed and supplementary irrigation conditions, respectively. Continuous crop production with imbalanced (only N) or without fertilization (CK) reduced production efficiency significantly. In comparison to wheat, soybean had higher benefit cost ratio, which might be explained due to its cultivation on residual fertility of wheat crop.
Conclusions
The following conclusion can be drawn from this study:
(1) In order to achieve the immediate benefits of organic manure, its application must be sync with nitrogenous chemical fertilizers otherwise their beneficial effects will be observed in succeeding crop only.
(2) Use of recommended dose of NPK in single or both seasons is completely an unsustainable approach as they provided the negative trend of productivity and economical return over the year.
(3) In the long term, only direct application of organic manure as alone or along with chemical fertilizers provided positive and significant trend of WUE and WEE while no such effects were observed in residual crop.
(4) Long-term economics and yield trend data revealed that application of 10 tonnes FYM/ha along with recommended dose of nitrogen (RDN)/RDF of wheat is sufficient to maintain the sustainability of both crops.
In sum, long-term combined use of organic and inorganic fertilizers in wheat crop improves productivity, profitability and WUE of soybean–wheat rotation and could be considered as sustainable production approach for marginalized farmers of country.
Acknowledgements
The authors are greatly thankful to Dr V. K. Bhatnagar for designing and initiating the experiment in 1997–98. The authors are also thankful for technical assistance of Mr Naryan Ram, Prahlad Singh and L. D. Malkani in the management of field trials and recording observations.
Author contributions
S. C. P. and M. P. conceived and designed the study. R. P. M., A. K. S. and T. M. conducted data gathering. V. S. M. and M. P. performed statistical analyses. M. P., M. C. and R. P. M. wrote the article. R. D. S. and P. K. reviewed and revised the initial draft. J. K. B., L. K. and A. P. provided necessary facility to conduct the study
Funding statement
This research received no specific grant from any funding agency, commercial or not-for-profit sectors.
Competing interests
None.



