Autism spectrum disorder (ASD) is characterised by persistent impairments in social communication and interaction across multiple contexts, as well as restricted and repetitive patterns of behaviours, interests or activities(1). Recent health surveillance estimates from the USA indicate a prevalence of one in thirty-six children, with an overall male-to-female prevalence ratio of 3·8(1,Reference Maenner, Warren and Williams2) . ASD is frequently associated with other clinical conditions, including sensory processing difficulties, which, along with behavioural and environmental factors, may result in feeding problems(Reference Chistol, Bandini and Must3). Research suggests that around 70 % of children with ASD have atypical feeding habits, including food selectivity(Reference Mayes and Zickgraf4). Compared with children with typical development, children with ASD demonstrate a higher prevalence of food refusal and a narrower food repertoire(Reference Sharp, Berry and McCracken5). The observed atypical patterns of intake may include not only food avoidance but also overeating and strong preferences for processed foods(Reference Sharp, Berry and McCracken5,Reference Nadeau, Richard and Wallace6) . Therefore, these conditions may affect nutrient intake and increase the risk of obesity and related metabolic disorders(Reference Healy, Aigner and Haegele7,Reference Ranjan and Nasser8) .
These characteristics of eating behaviour, including higher intake of energy-dense items, as well as physical inactivity and the use of psychotropic medications that affect appetite, such as antipsychotics and anticonvulsants, may also influence the serum lipid profile(Reference Shedlock, Susi and Gorman9). Studies report high concentrations of TAG(Reference Kim, Neggers and Shin10,Reference Luçardo, Monk and Dias11) and low concentrations of HDL-cholesterol(Reference Kim, Neggers and Shin10,Reference Błażewicz, Szymańska and Astel12) in children and adolescents with ASD. The prevalence of these conditions increases with age, and a longitudinal study reported that the prevalence of dyslipidaemia rose at a faster rate among adolescents with ASD compared with non-autistic individuals with the same age(Reference Malow, Qian and Ames13). In line with these findings, a recent meta-analysis found that individuals with ASD have a higher risk of dyslipidaemia than controls with typical development(Reference Dhanasekara, Ancona and Cortes14). It has been suggested that cholesterol homoeostasis is involved in the aetiology of ASD, indicating that altered lipid metabolism may affect synaptic connections, lipid constitution of neuron membranes and oxidative stress(Reference Esposito, Buoli and Ciappolino15).
Obesity and dyslipidaemia are increasingly prevalent in general population, especially among children and adolescents. These conditions have a significant impact on short-term and long-term health, with dyslipidaemia being considered a major risk factor for CVD(Reference Schefelker and Peterson16,Reference Zeljkovic, Vekic and Stefanovic17) . In addition, the presence of cardiovascular risk factors in childhood is strongly associated with an increased risk of cardiovascular events in adult life, which are a leading cause of worldwide mortality. Methods for accurately assessing cardiometabolic risk are still under study; however, early screening of lipid biomarkers is an important factor in evaluating these aspects in childhood and improving preventive measures(Reference Schefelker and Peterson16,Reference Zeljkovic, Vekic and Stefanovic17) .
Despite recent evidence regarding lipid profile in ASD, this association is not yet well established, as multiple factors are hypothesised to influence lipid metabolism, including genetic predisposition, medication use and dietary habits(Reference Esposito, Buoli and Ciappolino15,Reference Tierney, Remaley and Thurm18) . Few studies have evaluated the association of dietary intake with lipid profiles in this group, and these are restricted to macronutrient intake or specific diets(Reference Kim, Neggers and Shin10,Reference Błażewicz, Szymańska and Astel12) . Furthermore, dietary intake assessment in ASD is also limited, often using inadequate methodologies for data collection and analysis(Reference De Souza Silva, Castro and Valle19). A possible approach for characterising the whole diet, including combinations of foods and potential interactions of nutrients, is the evaluation of dietary patterns. Despite being considered useful techniques for the reduction of dimensionality of complex dietary data, the use of a posteriori or data-driven approaches in individuals with ASD has been explored in only a few studies(Reference Berding and Donovan20–Reference Plaza-Diaz, Flores-Rojas and Torre-Aguilar22). In addition, the use of methods that combine exploratory and hypothesis-oriented approaches for deriving dietary patterns, such as reduced rank regression (RRR), may provide possible explanations for the association between diet and health outcomes(Reference Schulz, Oluwagbemigun and Nöthlings23,Reference Weikert and Schulze24) .
To date, studies assessing the lipid profile and dietary patterns in this population remain limited. Examining these aspects could contribute to the understanding of the association between dyslipidaemia and ASD, as well as the role of dietary intake within this context. Comprehending these relationships may lead to more precise interventions and nutritional recommendations, improving overall quality of life. Therefore, the objective of this study was to evaluate the association between dietary patterns and serum lipid profiles in a sample of children and adolescents with ASD.
Methodology
Design and study sample
This cross-sectional study uses data from the Protocol for Nutritional Care in Autism (PANA study), collected between July 2021 and April 2024. Children and adolescents aged 2 to under 19 years with a confirmed diagnosis of ASD, receiving assistance at the neuropaediatric health service of a public university in the city of Pelotas, Southern Brazil, were recruited for this study. ASD diagnoses were provided by two paediatric neurologists, who are responsible for coordinating this service. Exclusion criteria comprised patients with neuropathies, congenital heart disease or genetic syndromes, as well as those with medical diagnoses that required specific nutritional support.
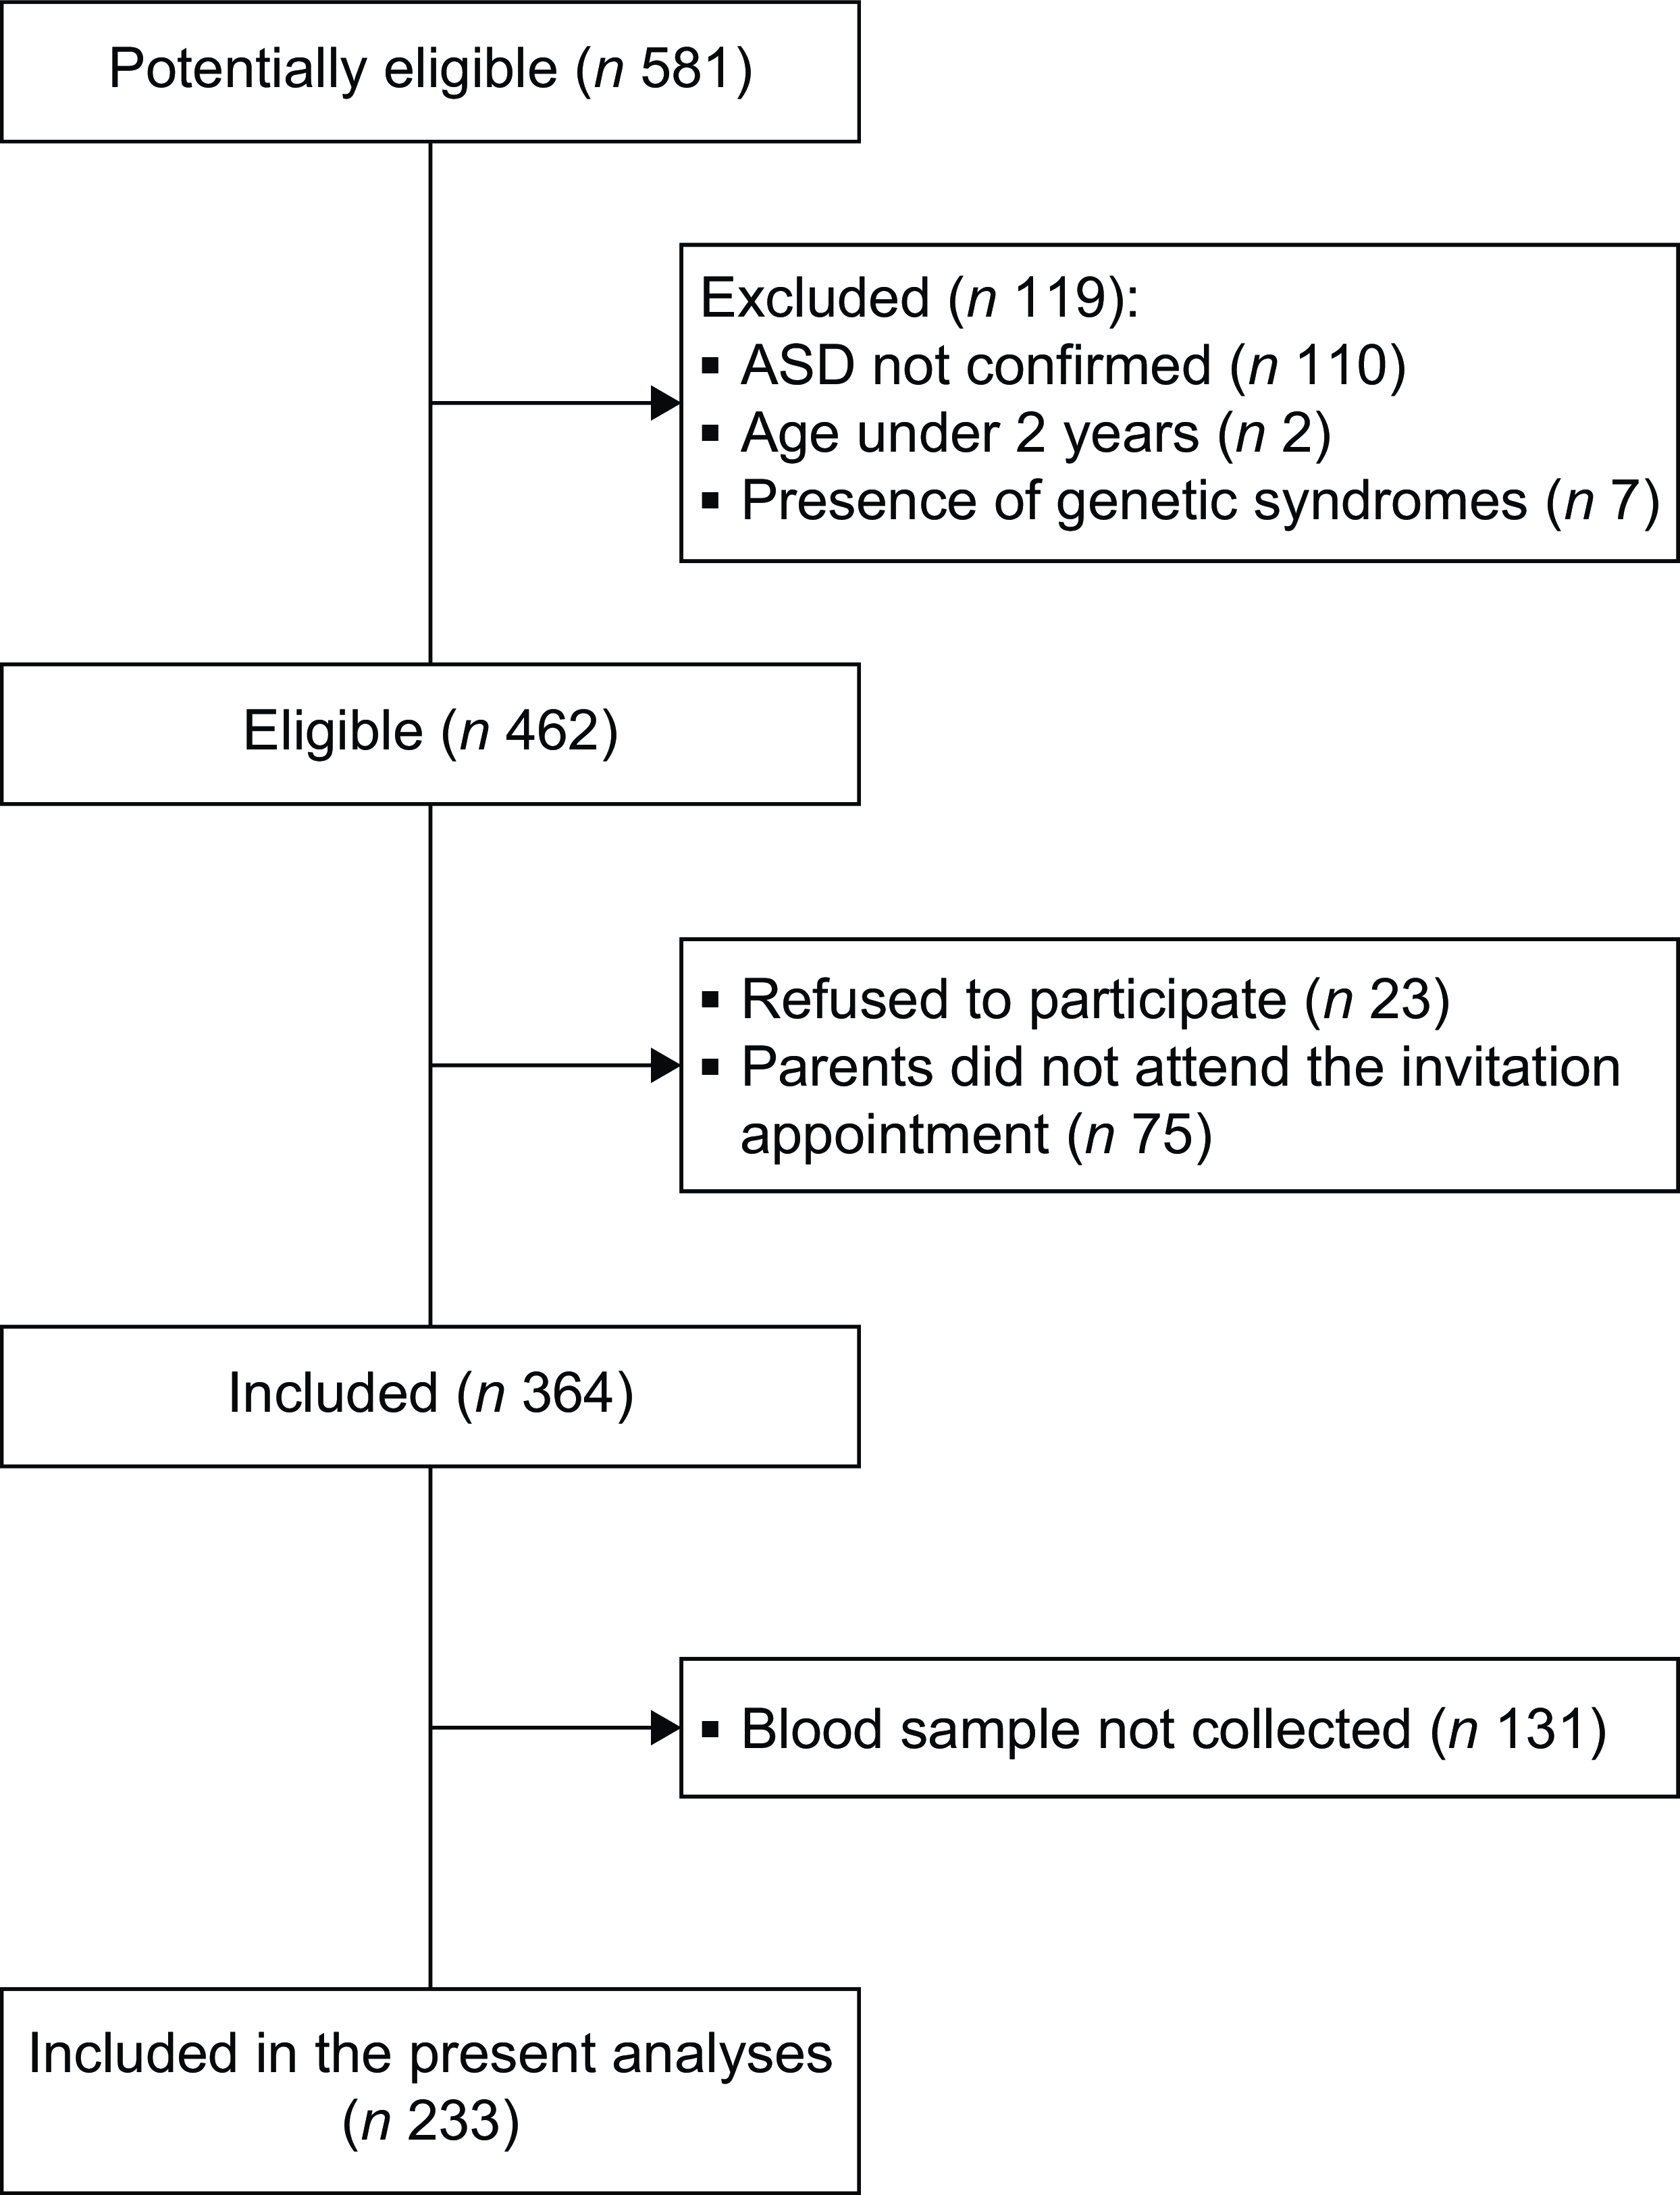
The sample size was determined based on the estimated number of children diagnosed with ASD in the city of Pelotas and estimates from previous studies assessing alterations in the lipid profile in ASD. The calculation considered a 95 % CI, a 5 % margin of error and a design effect of 1, resulting in a range of 226–254 individuals for the total sample. A total of 581 patients were screened for eligibility. Of these, 462 met the inclusion criteria, and the primary caregivers of 364 patients attended the invitation appointment and provided consent for their child/adolescent participation in the study. Among these, blood samples were available for 233 participants (Figure 1).
Flow chart for inclusion of participants.

Figure 1 Long description
The flowchart begins with 581 potentially eligible participants. 119 participants are excluded due to ASD not being confirmed in 110 cases, age under 2 years in 2 cases, and the presence of genetic syndromes in 7 cases. This leaves 462 eligible participants. Of these, 23 refuse to participate, and 75 parents do not attend the invitation appointment, resulting in 364 included participants. From these, blood samples are not collected from 131 participants, leaving 233 participants included in the present analyses.
Data collection
Data were collected during three pre-scheduled interviews, with a 1-week interval between each collection. Socio-demographic and clinical information were obtained through a standardised questionnaire applied to the primary caregiver in the first interview, which included variables of age, sex, ethnicity, school attendance, mother’s educational level, family income per capita (based on the Brazilian minimum wage) and use of antipsychotic medication.
Anthropometric measures were collected in the first interview using standard procedures. A digital scale with a capacity of 150 kg and an accuracy of 100 g (TRENTIN), integrated with a vertical stadiometer (maximum height of 213 cm and accuracy of 0·1 cm), was used to measure weight (kg) and height (cm). A horizontal stadiometer was used for children under 100 cm (maximum height of 100 cm and accuracy of 0·1 cm). Anthropometric status was assessed with the calculation of Z-scores of BMI for age, using the cut-off points defined by WHO standards(Reference de Onis, Onyango and Borghi25,26) . Patients aged over 5 years were classified with excess weight (overweight/obesity) when their BMI-for-age exceeded +1 Z-score, while those younger than 5 years were classified with excess weight when their BMI-for-age exceeded +2 Z-score.
Eating behaviour was assessed using the Children’s Eating Behaviour Questionnaire(Reference Viana and Sinde27,Reference Wardle, Guthrie and Sanderson28) . This instrument contains thirty-five questions designed to comprehensively evaluate feeding styles in children and adolescents. The subjective perception of caregivers is measured with a five-point Likert scale, ranging from 1 (never) to 5 (always). Questions are categorised into two domains, each with four subscales: (i) ‘Food approach’, including the subscales of response to food, enjoyment of food, desire to drink and emotional overeating and (ii) ‘Food avoidance’, covering the subscales of response to satiety, slowness in eating, food fussiness and emotional undereating. Total scores for food approach and food avoidance, derived from the sum of their respective subscales, were dichotomised using the median values as a reference (< median; ≥ median)(Reference Luçardo, Monk and Dias11).
Blood sample collection
All participants were invited to participate in the blood sample collection after the third interview. Fasting blood samples were obtained through venipuncture in a clinical laboratory, following standard procedures. After collection, the samples were processed and centrifuged at 2500 rpm for the separation of serum and were stored at −80℃. Serum concentrations of total cholesterol (TC), HDL-cholesterol and TAG were analysed using enzymatic colorimetric method, with commercial measurement kits (Bioclin®, Belo Horizonte) on a Cobas Mira S biochemical analyser (Roche®). LDL-cholesterol concentrations were calculated using the formula determined by Friedewald and colleagues (1972): LDL-cholesterol = TC – HDL-cholesterol – TAG/5(Reference Friedewald, Levy and Fredrickson29).
Acceptable values for serum lipid and lipoprotein concentrations were assessed using cut-offs from the National Heart, Lung, and Blood Institute guidelines for children and adolescents: TC < 170 mg/dl, LDL-cholesterol < 110 mg/dl, HDL-cholesterol > 45 mg/dl and TAG < 75 (for children aged 9 years or younger) or < 90 (for children and adolescents aged 10–19 years)(30).
Dietary intake
Dietary intake was assessed using three non-consecutive 24-h food recalls (24HR), conducted in each of the interviews. These 24HR covered two weekdays (via face-to-face interviews) and one weekend day (via telephone interview). Caregivers were requested to report all foods and beverages consumed the day before the interviews, including mealtimes and portion sizes. The multi-pass method was applied to improve the reliability of 24HR(Reference Johnson, Driscoll and Goran31). Furthermore, a photo book of standard measurement units was provided to assist with the estimation of portion sizes(Reference Vitolo32). Energy and macronutrient intake were calculated using the Brazilian Food Composition Table, which contains estimates of food composition derived from national data(Reference Giuntini, Coelho and Grande33).
Estimated energy requirements were calculated using sex- and age-specific equations according to dietary reference intakes(34). Physical activity level was set as ‘low active’, considering that most of the sample had low physical activity levels. Dietary misreporting was estimated using the ratio of reported energy intake to predicted total energy requirement (EI/EE), establishing ± 1 sd as a cut-off point for under- or over-reporting(Reference Huang, Roberts and Howarth35,Reference Leech, Worsley and Timperio36) .
Dietary patterns
Food items reported in the 24HR were divided into twenty-eight groups according to similarities in their nutritional composition. The classification was based on data from the National Food Survey (INA, Inquérito Nacional de Alimentação)(Reference Antunes, Cunha and Baltar37), with adaptations for the studied sample. Five of the food groups were consumed by less than 20 % of the sample and were further excluded(Reference Eshriqui, Franco-Sena and Farias38), resulting in twenty-three groups for dietary pattern analysis (online Supplementary Table 1). For each individual, the average daily intake (in grams) of each food group was calculated as the mean across the three 24HR.
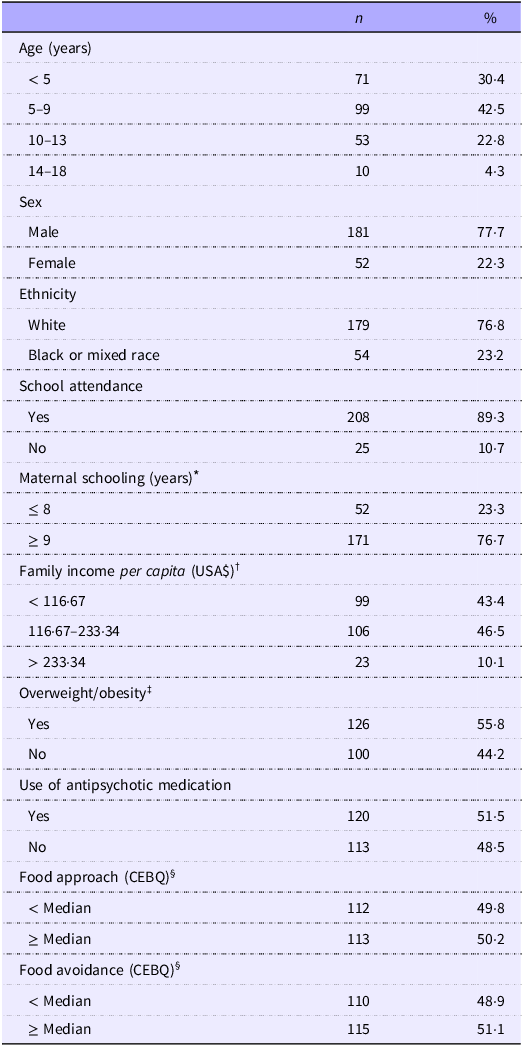
Socio-demographic, clinical, and behavioural characteristics of children and adolescents diagnosed with autism spectrum disorder (n 233)

Table 1 Long description
The table presents data on various characteristics of children and adolescents diagnosed with autism spectrum disorder. It includes categories such as age, sex, ethnicity, school attendance, maternal schooling, family income per capita, overweight/obesity, use of antipsychotic medication, food approach, and food avoidance. The table has 12 rows and 4 columns, with column headers labeled Age, Sex, Ethnicity, School attendance, Maternal schooling, Family income per capita, Overweight/obesity, Use of antipsychotic medication, Food approach, and Food avoidance. Each row provides the number and percentage of individuals in each category. Notable trends include a higher percentage of males, white ethnicity, and school attendance. The data also shows significant percentages of individuals with overweight/obesity and those using antipsychotic medication.
CEBQ, Children’s Eating Behaviour Questionnaire.
* Missing data for ten participants.
† Missing data for five participants.
‡ Missing data for six participants.
§ Missing data for eight participants.
Dietary patterns were derived using RRR. This statistical method is considered to combine both a priori and a posteriori approaches for dietary pattern analysis, including a set of predictors (usually food groups or food items) and response variables identified as intermediates for a health outcome of interest. Therefore, RRR aims to identify linear functions of food groups, accounting for as much variation as possible in a set of intermediate response variables(Reference Weikert and Schulze24,Reference Hoffmann39) .
Food group intakes (g/day) were used as predictor variables, while fibre density (g/kcal), energy density (kcal/g), percentages of energy from carbohydrates (%CHO) and saturated fat (%SFA) were selected as response variables. Similar response variables have been used in previous research related to lipid profile and obesity, according to their association with adiposity, blood cholesterol and TAG concentrations, as well as considering energy intake as part of each variable(Reference Eshriqui, Franco-Sena and Farias38,Reference Ambrosini, Emmett and Northstone40–Reference Alves, Barboza and Retondario42) . Fibre density was determined by dividing dietary fibre intake (g) by total energy intake (kcal). Dietary energy density was calculated as total energy prevenient from solid foods (kcal) divided by the total weight of solid foods consumed (g), excluding beverages. %CHO and %SFA were obtained by dividing daily intake of carbohydrate and saturated fats (g), respectively, by total daily energy intake (kcal) and then multiplying the result by 100.
Statistical analyses
Data were double entered into EpiData® version 3.1 program (EpiData, version 3.1; The EpiData Association, Odense, Denmark, 2003–2005).
Descriptive analyses were performed to compare the means and percentages of children’s characteristics and blood lipid levels, using χ 2 tests for categorical variables and ANOVA or Student’s t tests for continuous variables. Crude and adjusted regression analysis were performed to examine the associations between the four pattern scores and lipid profiles. Potential confounding variables were included in multivariate regression models: age, sex, school attendance, maternal level of schooling, family income, use of antipsychotic medication, BMI-for-age and dietary misreporting. Since TAG levels presented an asymmetric distribution, nonparametric tests (Mann–Whitney and Kruskal–Wallis) were used for description, and log transformation of this variable was performed for regression analysis.
RRR was conducted using the PROC PLS procedure in SAS software (SAS Institute Inc.). Factor loadings ≥ 0·20 were considered significant for description of dietary patterns. Scores were calculated for each participant in each pattern, representing their level of adherence and were further standardised for statistical analysis. Descriptive statistics and linear regression analyses were conducted on Stata software (version 15.1), with the significance level set at P < 0·05. Bonferroni correction was applied to adjust the significance level in the regression analyses, in order to minimise the risk of Type I error. Sensitivity analyses were conducted after the regression models to test the consistency of results, stratifying the sample according to overweight status and medication use.
Results
The participants were predominantly aged between two and nine years (mean age 7·6 (sd 3·6) years). Most were male (77·7 %), white (76·7 %) and attended school (89·3 %). The majority of mothers had 9 or more years of schooling (76·7 %), and most families reported a per capita income below one minimum wage (equivalent to USA$ 233·34 per month). In addition, more than half of the sample (55·8 %) was classified with overweight or obesity, and 51·5 % were using antipsychotic medications (Table 1).
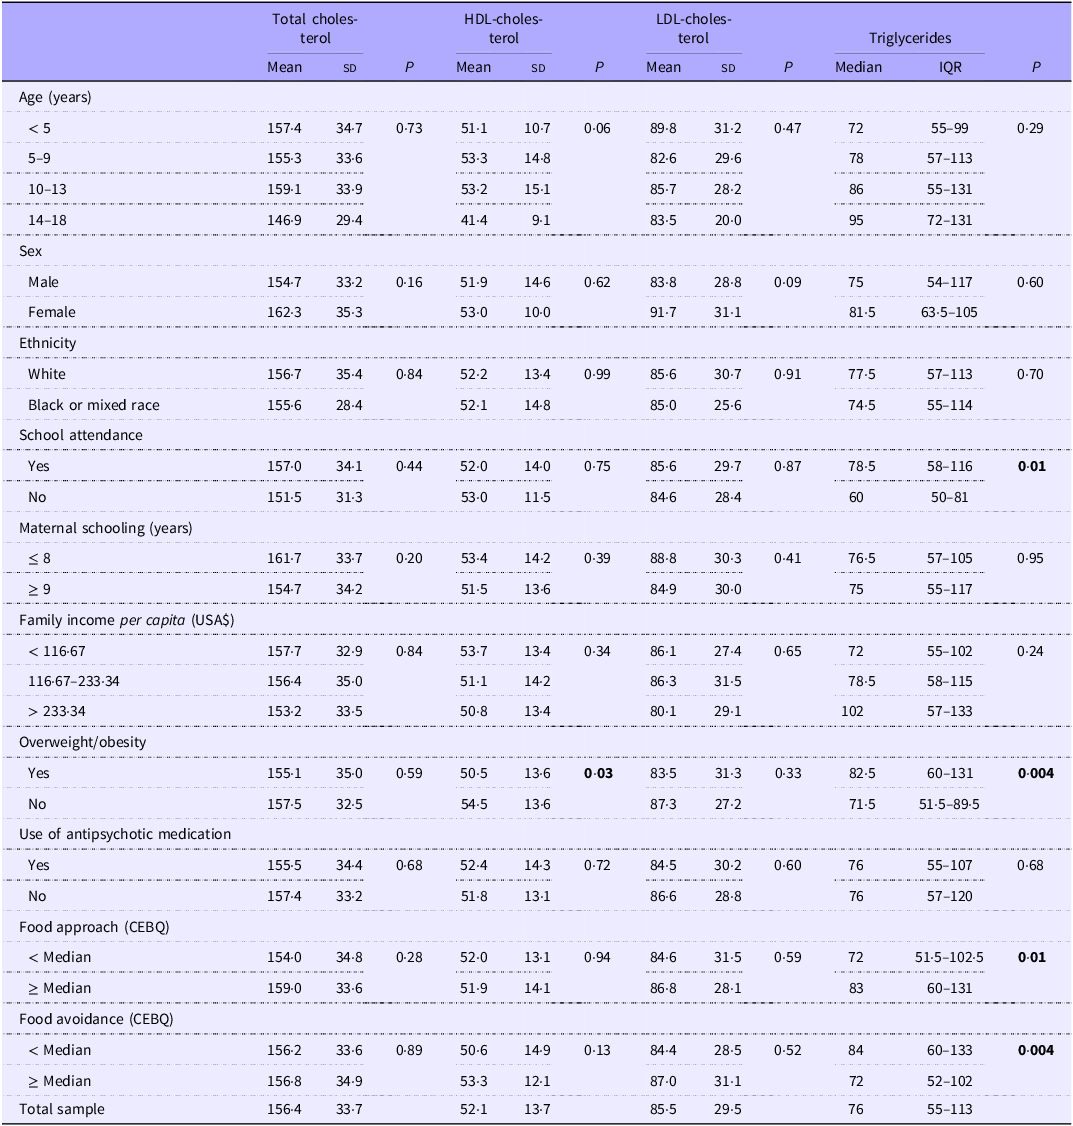
Nearly half of the sample had high TAG serum concentrations (48·9 %), while over 30 % presented elevated TC and/or reduced HDL-cholesterol concentrations. High LDL-cholesterol was observed in around 20 % of the children (online Supplementary Table 2). Significant differences in HDL-cholesterol and TAG were observed according to nutritional status, as children classified with excess weight exhibited higher TAG and lower HDL-cholesterol concentrations. The median TAG concentration was significantly higher among children who attended school. Furthermore, scores of food approach above the median and food avoidance below the median were both associated with higher TAG concentrations. No further statistically significant differences were identified based on other sample characteristics (Table 2).
Lipid profile according to socio-demographic, clinical and behavioural characteristics of children and adolescents diagnosed with autism spectrum disorder (n 233)

Table 2 Long description
The table presents lipid profile data for children and adolescents diagnosed with autism spectrum disorder, categorized by various socio-demographic, clinical, and behavioral characteristics. It includes mean values and standard deviations for total cholesterol, HDL-cholesterol, LDL-cholesterol, and triglycerides across different age groups, sex, ethnicity, school attendance, maternal schooling, family income per capita, overweight/obesity status, use of antipsychotic medication, and food approach and avoidance behaviors. The table highlights significant differences in HDL-cholesterol and triglycerides according to nutritional status, with children classified with excess weight exhibiting higher triglyceride and lower HDL-cholesterol concentrations. The median triglyceride concentration was significantly higher among children who attended school. Scores of food approach above the median and food avoidance below the median were both associated with higher triglyceride concentrations. No further statistically significant differences were identified based on other sample characteristics.
CEBQ, Children’s Eating Behaviour Questionnaire. Statistically significant P-values (P < 0.05) are highlighted in bold.
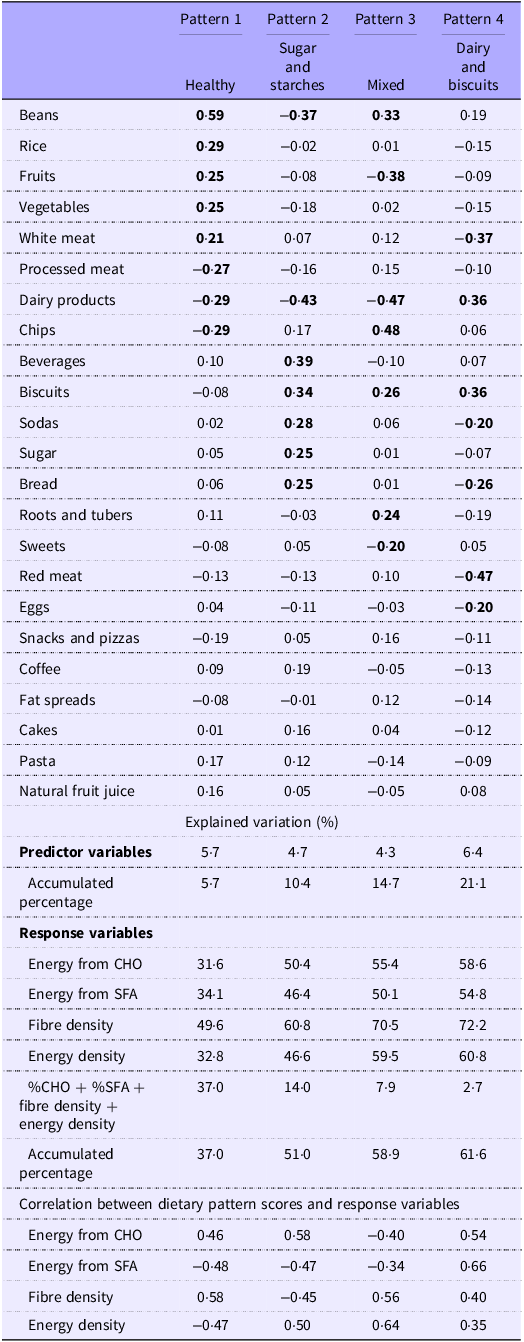
Four dietary patterns were identified through RRR (Table 3). The first pattern (labelled as ‘Healthy’) had positive loadings for beans, rice, fruits, vegetables and white meats and negative loadings for processed meat, dairy products and chips. Beverages, biscuits, sodas, sugar and bread, with negative loadings for beans and dairy products, characterised the second pattern (‘Sugar and Starches’). The third pattern (‘Mixed’) was positively loaded for beans, chips, biscuits, roots and tubers and negatively loaded for dairy products, fruits and sweets. The fourth pattern (‘Dairy and Biscuits’) comprised dairy products and biscuits, with negative loadings for white and red meats, eggs, soda and bread.
Dietary patterns and factor loadings identified by reduced rank regression (n 233)

Table 3 Long description
The table presents data on four dietary patterns identified through reduced rank regression, involving 233 participants. It includes factor loadings for various food items across four patterns: Healthy, Sugar and Starches, Mixed, and Dairy and Biscuits. The Healthy pattern has positive loadings for beans, rice, fruits, vegetables, and white meats, and negative loadings for processed meat, dairy products, and chips. The Sugar and Starches pattern is characterized by positive loadings for beverages, biscuits, sodas, sugar, and bread, with negative loadings for beans and dairy products. The Mixed pattern shows positive loadings for beans, chips, biscuits, roots and tubers, and negative loadings for dairy products, fruits, and sweets. The Dairy and Biscuits pattern includes positive loadings for dairy products and biscuits, with negative loadings for white and red meats, eggs, soda, and bread. The table also includes predictor variables, response variables, and correlations between dietary pattern scores and response variables.
CHO, carbohydrates; SFA, saturated fat. Bold values represent factor loadings greater than 0.20, considered significant for description of the dietary patterns.
The identified dietary patterns explained 21·1 % of the total food group variability and 61·6 % of the total variability in the response variables. The Healthy pattern explained 37·0 % of the variance, followed by sugar and starches (14·0 %), mixed (7·9 %) and dairy and biscuits (2·7 %). The healthy pattern was positively correlated with %CHO and fibre density and negatively correlated with %SFA and energy density. Sugar and starches presented a positive correlation with %CHO and energy density and a negative correlation with %SFA and fibre density. Mixed pattern had a positive correlation with fibre density and energy density, while dairy and biscuits was positively correlated with all the response variables (Table 3).
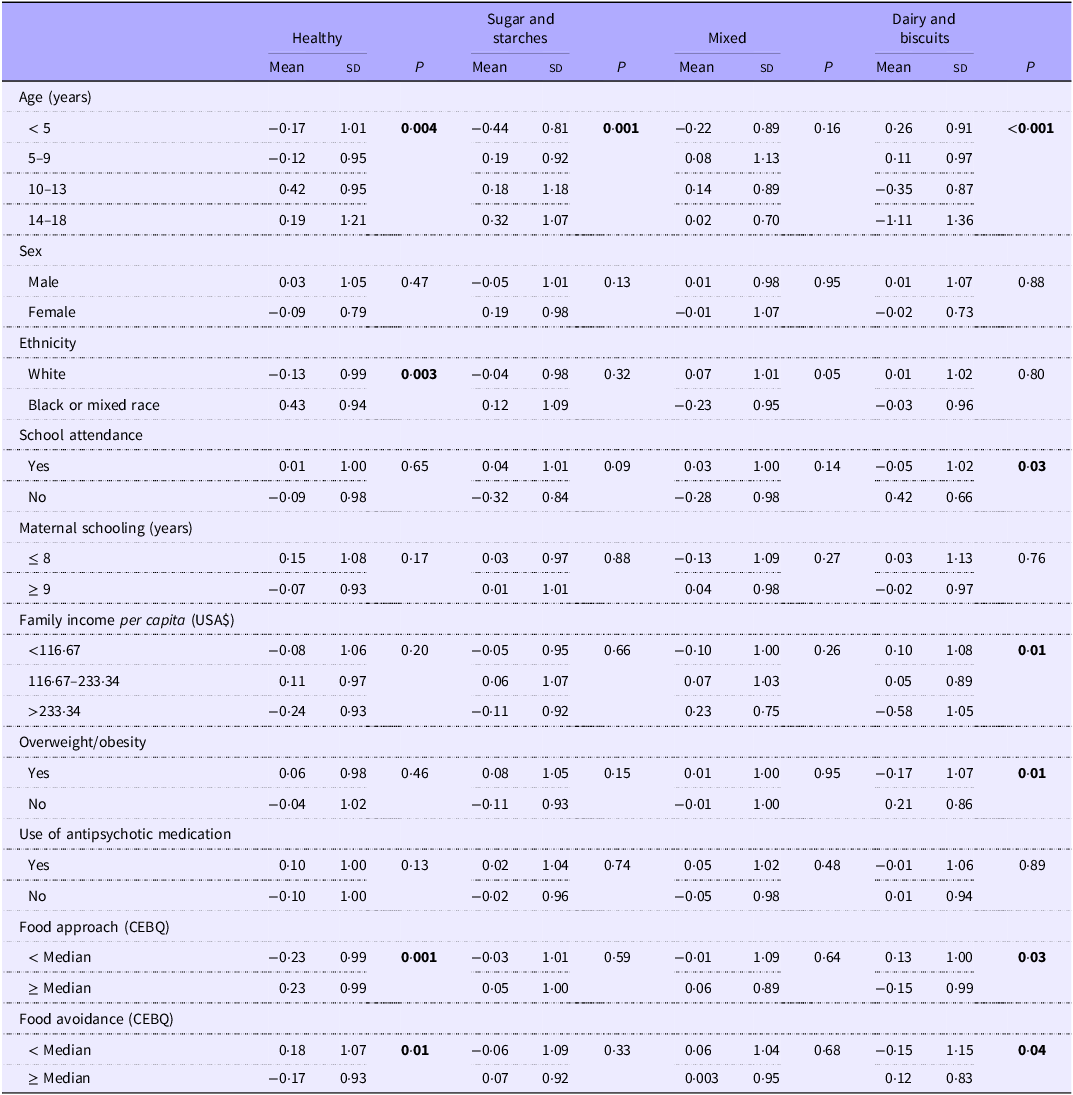
Standardised dietary pattern scores were evaluated according to the characteristics of children and adolescents. A significant age-related difference in scores was observed for most patterns, with higher adherence for the healthy and sugar and starches patterns in individuals over 10 years of age. In contrast, higher scores for dairy and biscuits were found in younger children. A significant difference was also observed according to ethnicity, where children identified as black or mixed race had higher adherence to the healthy pattern. Scores for the dairy and biscuits pattern were higher in children who attended school, with adequate anthropometric status and lower family income per capita. In addition, a significant difference in adherence to the healthy pattern was observed according to eating behaviour, with higher scores found when food approach was above the median and food avoidance was below the median (Table 4).
Dietary pattern scores according to socio-demographic, clinical and behavioural characteristics of children and adolescents diagnosed with autism spectrum disorder (n 233)

Table 4 Long description
The table presents dietary pattern scores categorized by various socio-demographic, clinical, and behavioral characteristics of children and adolescents diagnosed with autism spectrum disorder. It includes data on healthy, sugar and starches, mixed, and dairy and biscuits dietary patterns. The table has 12 rows and 13 columns, with columns for mean, standard deviation, and p-value for each dietary pattern. Key characteristics include age, sex, ethnicity, school attendance, maternal schooling, family income per capita, overweight/obesity status, use of antipsychotic medication, and food approach and avoidance behaviors. Notable trends include higher adherence to healthy and sugar and starches patterns in individuals over 10 years of age, higher dairy and biscuits scores in younger children, and higher healthy pattern adherence in black or mixed race children. Children attending school, with adequate anthropometric status, and lower family income per capita show higher dairy and biscuits scores. Significant differences in healthy pattern adherence are also observed based on food approach and avoidance behaviors.
CEBQ, Children’s Eating Behaviour Questionnaire. Statistically significant P-values (P < 0.05) are highlighted in bold.
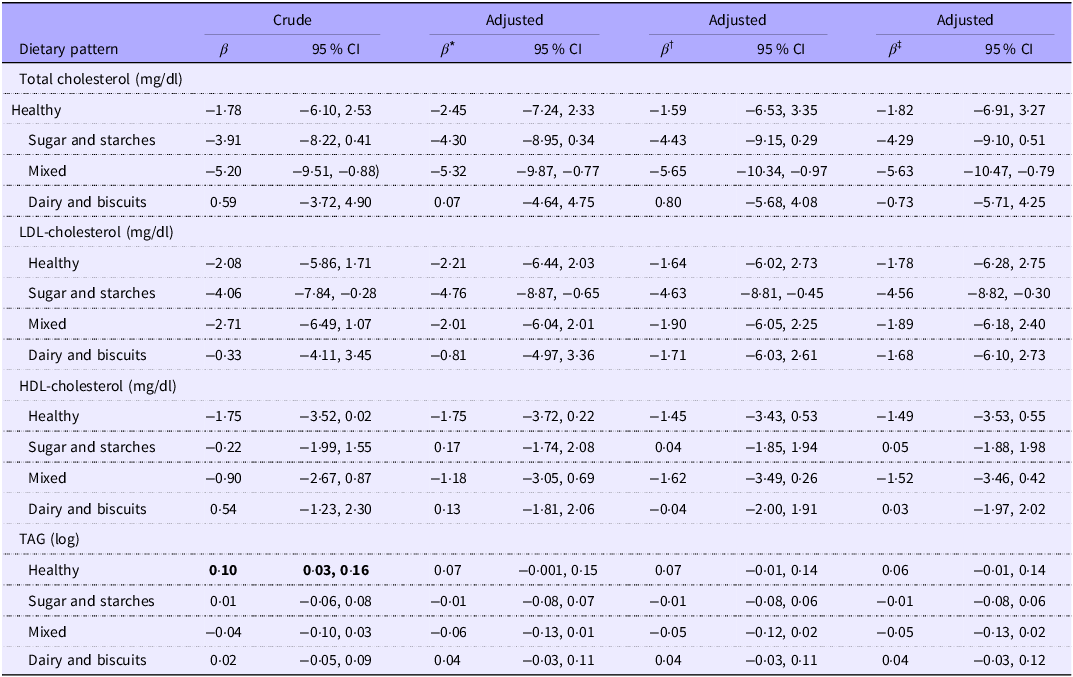
Linear regression models indicated that the Healthy pattern was associated with an increase in log-transformed TAG concentrations in the crude regression model; however, this association lost significance after adjustment for confounding variables (crude β = 0·10, CI 95 % 0·03, 0·16, adjusted β = 0·06, CI 95 % −0·01, 0·14). When adjusted for Bonferroni correction, no other statistically significant associations were observed between dietary pattern scores and lipid profile (Table 5). Sensitivity analyses by overweight status and medication use did not materially change the direction or magnitude of the associations (online Supplementary Tables 3 and 4).
Crude and adjusted linear regression models between dietary pattern scores and blood lipids in children and adolescents diagnosed with autism spectrum disorder (n 233)

Table 5 Long description
The table presents data from a study examining the relationship between dietary pattern scores and blood lipid levels in children and adolescents diagnosed with autism spectrum disorder. It includes crude and adjusted linear regression models for total cholesterol, LDL-cholesterol, HDL-cholesterol, and TAG (log). The table has four dietary patterns: Healthy, Sugar and starches, Mixed, and Dairy and biscuits. Each pattern is analyzed for its effect on different blood lipid levels. The Healthy pattern shows a significant increase in log-transformed TAG concentrations in the crude model but loses significance after adjustment. No other statistically significant associations were observed after adjusting for confounding variables. The table consists of four rows for each lipid type and four columns for crude and adjusted models with their respective confidence intervals.
Statistical significance was determined using the Bonferroni correction for multiple comparisons, with P < 0·0125 considered statistically significant (results highlighted in bold).
* Model adjusted for age, sex, school attendance, maternal schooling and family income per capita.
† Model adjusted for age, sex, school attendance, maternal schooling, family income per capita, use of antipsychotic medication and BMI for age.
‡ Model adjusted for age, sex, school attendance, maternal schooling, family income per capita, use of antipsychotic medication and BMI for age and energy misreporting.
Discussion
The findings of this study highlight a notable prevalence of alterations in serum lipid profiles, particularly in TAG, in ASD. Furthermore, adherence to dietary patterns was associated with age, ethnicity, family income, nutritional status, and eating behaviour. Recent evidence from meta-analyses have focused on specific components of dietary intake and anthropometric status in ASD, indicating decreased intake of protein and micronutrients in this population(Reference Alhrbi, Vlachopoulos and Healey43), as well as an increased risk for obesity and cardiometabolic disease(Reference Dhanasekara, Ancona and Cortes14,Reference Kahathuduwa, West and Blume44) . Nevertheless, studies investigating the association between the composition of dietary patterns and lipid profile in this population remain scarce. Therefore, this study offers novel insights and contributes to advancing knowledge in this field.
Although diet is a well-recognised determinant of lipid metabolism, our findings suggest that other factors may play a stronger role in dyslipidaemia among individuals with ASD. Genetic alterations in cholesterol homeostasis have been implicated in this condition(Reference Esposito, Buoli and Ciappolino15), and the use of psychotropic medications, particularly antipsychotics, is associated with weight gain and adverse lipid changes(Reference Aishworiya, Valica and Hagerman45). In addition, low physical activity levels and the heterogeneity of ASD presentations may contribute to variability in metabolic responses(Reference Prince, Chu and Chen46). These factors together may explain the absence of significant associations between dietary patterns and lipid profiles after adjustment in our study. Nevertheless, the nutritional composition of these patterns still provides valuable insights.
For instance, healthy pattern – associated with fibre intake and lower energy density – had an initial association with higher TAG, which could suggest reverse causality. However, the loss of significance after adjustment indicates that potential confounders, including sociodemographic and clinical characteristics, may contribute as important factors in this association. Residual confounding may persist, reflecting the influence of factors not fully captured by the adjusted model. Mixed pattern was characterised by a positive correlation with fibre density and a negative correlation with %SFA. The intake of beans, roots and tubers likely contributed to an increase in fibre intake, which could contribute to reducing cholesterol absorption(Reference Feingold47). Fibre intake is known to reduce cholesterol absorption, while saturated fat can suppress LDL receptor activity and enhance LDL production rate, therefore, these components could result in decreased LDL-cholesterol serum concentrations(Reference Feingold47,Reference Siri-Tarino, Chiu and Bergeron48) . In contrast, this pattern included ultra-processed foods such as chips and biscuits. While other studies with children and adolescents have not consistently shown a direct relationship between the consumption of ultra-processed foods with dyslipidaemia(Reference Gadelha, de Arruda and Coelho49,Reference Gonçalves Silva, Saunders and da Cruz Rangel50) , a recent meta-analysis of prospective cohort studies present associations of higher intake of these products with obesity, hypertriglyceridaemia and low HDL-cholesterol serum concentrations in adults(Reference Vitale, Costabile and Testa51), indicating a possible long-term impact of these dietary components in health.
Sugar and Starches pattern presented a negative correlation with %SFA; however, it was primarily composed of carbohydrate-rich foods, including sodas, beverages, biscuits and added sugars. Despite the lack of significant associations with lipid profile, this dietary pattern may still have negative health implications. The replacement of saturated fats with carbohydrates, especially refined and processed, has been associated with the worsening of cardiovascular risk and increase of insulin resistance(Reference Siri-Tarino, Chiu and Bergeron48). Moreover, an excessive intake of sugars, particularly through sugar-sweetened beverages, is considered to have an important effect on the development of obesity and metabolic diseases in adults(Reference Stanhope52).
In the dairy and viscuits pattern, the negative loading for red meat may reflect a substitution effect, in which higher intake of dairy products and biscuits displaces the consumption of protein-rich foods such as meats. This pattern could be related to selective eating behaviours frequently observed in children with ASD, including strong preferences for specific textures and tastes and the avoidance of other food groups(Reference Mayes and Zickgraf4,Reference Sharp, Berry and McCracken5) . Such substitution may contribute to nutritional imbalances, reinforcing the importance of monitoring dietary diversity in this population.
Adherence to dietary patterns was associated with socio-demographic factors such as age, ethnicity and family income. Children over 10 years of age presented greater adherence to the healthy and mixed patterns, possibly related to increased autonomy in food choices. Conversely, younger children presented higher adherence to dairy and biscuits pattern, potentially reflecting infantile feeding habits or caregiver influence. These findings highlight the need for age-specific nutritional education, including both parent training and direct interventions for children and adolescents(Reference Murimi, Moyeda-Carabaza and Nguyen53). Furthermore, family income and ethnicity are critical determinants of dietary intake, as they may contribute to disparities in food availability and access to health information(Reference Jiao54). Notably, the predominance of participants with low income in this study may have influenced the observed dietary patterns.
Alterations in lipid profile have been previously reported in individuals with ASD. A case–control study including twenty-nine boys with ASD found significantly higher mean TAG concentrations, while HDL-cholesterol was significantly lower than controls with typical development(Reference Kim, Neggers and Shin10). Elevated TC and LDL-cholesterol in comparison with controls was reported in a study involving adults with Asperger syndrome now included within the autism spectrum(Reference Dziobek, Gold and Wolf55). A prospective study with adolescents with ASD reported increased TC levels in comparison with controls, as well as elevated TAG concentrations according to the type of diet(Reference Błażewicz, Szymańska and Astel12). In addition, a previous study from our research group also observed a high prevalence of hypertriglyceridaemia, markedly related to eating behaviour(Reference Luçardo, Monk and Dias11).
Recent studies have also explored the link between ASD and dyslipidaemia through various approaches(Reference Dhanasekara, Ancona and Cortes14,Reference Luo, Eran and Palmer56) . However, contrasting results are still observed in the literature. Some studies report no significant differences in lipid profiles between individuals with ASD and neurotypical peers(Reference Grayaa, Zerbinati and Messedi57,Reference Moses, Katz and Weizman58) , while others indicate lower concentrations of TC in those with ASD(Reference Tierney, Bukelis and Thompson59–Reference Benachenhou, Etcheverry and Galarneau61). Impairments in cholesterol homeostasis and lipid metabolism have been described previously in this population(Reference Esposito, Buoli and Ciappolino15,Reference Madore, Leyrolle and Lacabanne62) . The heterogeneity of clinical manifestations and symptoms in ASD, which may be linked to a variability in metabolic patterns(Reference Prince, Chu and Chen46), could contribute to these discrepancies in lipid profile outcomes.
A longitudinal study has shown that the prevalence of dyslipidaemia increases at a faster rate among adolescents with ASD compared with neurotypical peers, suggesting that cardiometabolic risk may become more evident clearly later in life(Reference Malow, Qian and Ames13). The relatively young age of our participants may have limited the strength of observed associations between dietary patterns and lipid profiles, underscoring the need of follow-up studies with older age groups. Nonetheless, early-life cardiovascular risk factors, including elevated TC and TAG, are known predictors of cardiovascular events in adulthood(Reference Jacobs, Woo and Sinaiko63). Therefore, timely evaluation and intervention during childhood and adolescence remain crucial, even if more pronounced outcomes tend to appear only at later stages.
The increased risk of dyslipidaemia in autism could be attributed to factors such as genetic variants, eating behaviour, physical inactivity and medication use(Reference Dhanasekara, Ancona and Cortes14). An eating pattern characterised by selective eating, combined with food approach behaviours, may favour the intake of energy-dense foods, increasing the risk of obesity and related metabolic complications. Additionally, antipsychotic medications are markedly associated with appetite modulation, which may result in weight gain, insulin resistance and dyslipidaemia(Reference Aishworiya, Valica and Hagerman45). In our study, no differences in lipid profile were observed according to the use of antipsychotic medication. However, the absence of data regarding duration of treatment and dosage may influence this observation. In contrast, eating behaviour was associated with serum TAG concentrations, as evidenced by both food approach and food avoidance scores.
Previous studies in the population with ASD have evaluated dietary patterns through principal component analysis, cluster and factor analysis(Reference Berding and Donovan20–Reference Plaza-Diaz, Flores-Rojas and Torre-Aguilar22). Different patterns were obtained in this study, which may be attributed to the use of an alternative method. RRR derives patterns explained by the variability in specific response variables, while other data-driven methods aim to explain the total variation in food groups, reflecting broader dietary habits(Reference Eshriqui, Franco-Sena and Farias38,Reference Hoffmann39) . Nevertheless, some similarities are observed, particularly in the contrast of patterns characterised mostly by unprocessed food, and those containing sugar and refined carbohydrates.
RRR has been previously applied in other studies with children and adolescents with typical development. A study with 36 217 Brazilian adolescents retained two dietary patterns for analysis: the first with positive loadings for sweets and red meat and negative loadings for beans, rice, fruits and vegetables; and the second positively loaded for beans and rice and negatively loaded for sugar-sweetened beverages, fruit juices and sweets. The adherence to first dietary pattern was associated with increased HDL-cholesterol, while the adherence to the second pattern was associated with lower TAG concentrations(Reference Alves, Barboza and Retondario42). Similarly, a study with Malaysian adolescents identified a pattern high in sugar, fibre and energy density and low in fat, which was associated with higher odds of dyslipidaemia or elevated TC and LDL-cholesterol(Reference Emi, Gan and Mohd Shariff41). Moreover, an energy-dense, high-fat and low-fibre dietary pattern was associated with increased adiposity in a cohort of children(Reference Ambrosini, Emmett and Northstone40,Reference Johnson, Mander and Jones64) .
Even though the impact of diet in cardiovascular risk have been widely studied, the association between dietary intake and lipid profile is complex and multifactorial(Reference Feingold47). In the context of this study, it is important to acknowledge that factors such as sample size and age distribution may have limited the detection of significant associations. Furthermore, the possibility of reverse causality or the influence of unmeasured confounding factors, including physical activity and genetic predisposition, should also be considered.
This study has several strengths, including the use of RRR to derive dietary patterns, including intermediate variables that are possibly related to an outcome of interest. The use of repeated 24HR, considered a reliable tool to estimate habitual intake, is an additional strength of this study. While 24HR may be prone to under- or overestimation of dietary intake, the multi-pass method and the references for household measures were applied to minimise these biases, as well as controlling for dietary misreporting. However, some limitations should be considered. The cross-sectional design restricts causal inferences, since the outcome and the exposure are measured simultaneously. Physical activity levels, as well as dosage and duration of medication use, were not completely available in this study, despite their potential influence on lipid metabolism. Data on antipsychotic medication dosage and treatment duration were not consistently available from all parents; this variable was considered in a simplified dichotomous format. Similarly, reports of weekly physical activity were not provided, as parents found it difficult to accurately monitor their child’s activity outside the home, particularly during the school period. In addition, because participants were recruited from a single centre in southern Brazil, specific socio-economic and cultural dietary habits may have affected both food consumption patterns and metabolic outcomes. The relatively small sample size and the young age of participants may have reduced the precision of inferences and limited the generalisability of our findings to other populations. Therefore, these findings should be interpreted with caution. Further studies, particularly with larger samples and a longitudinal design, are needed for a more comprehensive evaluation of the relationship between dietary intake and lipid profile in individuals with ASD.
Conclusion
The findings of this study highlight the presence of alterations in serum lipid profiles in individuals with ASD, particularly in TAG concentrations. Although no significant associations were observed between dietary patterns and lipid profiles in our sample, this finding underscores the complex relationship between diet and lipid metabolism in this population. Considering the limited research available in these topics, these results reinforce the need for further studies regarding these interactions, as well as adequate nutritional interventions to improve the health outcomes of individuals with ASD.
Supplementary material
For supplementary material/s referred to in this article, please visit https://doi.org/10.1017/S0007114525106235
Acknowledgements
The authors sincerely thank the families who participated in the study for their time and collaboration. Appreciation is extended to the staff and personnel for their assistance, as well as to the research assistants for their dedication and essential contributions throughout the data collection process.
This study was financed in part by the Coordination for the Improvement of Higher Education Personnel – Finance Code 001; the Brazilian National Research Council – Finance Code 308213/2021–1 and 407237/2021–6 and the Foundation for the Support of Research of the State of Rio Grande do Sul (Fapergs) – Finance Code 24/2551-0001430-6.
L. V. H. – conceptualisation, data curation, formal analysis, investigation, visualisation, writing – original draft and writing – review and editing. E. S. – conceptualisation, data curation, investigation and writing – review and editing. K. C. – conceptualisation, supervision and writing – review and editing. L. R. – investigation and writing – review and editing. L. P. C. – investigation and writing – review and editing. E. R. – investigation. J. L. – conceptualisation and investigation. R. V. – resources and investigation. J. G. – resources and investigation. P. H. F. C. – resources and investigation. D. B. C. – methodology and writing – review and editing. S. V. – conceptualisation, supervision and writing – review and editing. J. S. V. – conceptualisation, funding acquisition, project administration, supervision, writing – original draft and writing – review and editing.
The authors declare no conflicts of interest.
This study was conducted according to the guidelines laid down in the Declaration of Helsinki, and all procedures involving patients were approved by the Research Ethics Committee of the Faculty of Medicine of the Federal University of Pelotas (CAEE: 94253518.0.0000.5317). Written informed consent was obtained from all primary caregivers.