1. Introduction
The secular evolution of the Earth through geological time is best tackled from a thermal perspective because geological events are driven by internal heat dissipation. The present-day energy budget is such that the rate of heat loss is approximately twice as large as the amount of heat released by the radioactive decay of long-lived radioactive isotopes (
 $^{238}\text{U}$
,
 $^{235}\text{U}$
,
 $^{232}\text{Th}$
and
 $^{40}\text{K}$
), implying that the Earth is currently cooling down at a bulk rate of approximately
 $100~\text{K}~\text{Gyr}^{-1}$
(Jaupart, Labrosse & Mareschal Reference Jaupart, Labrosse, Mareschal, Bercovici and Schubert2007). Extrapolating this budget back in time is fraught with many uncertainties. Although it is recognized that mantle convection is the main physical process involved in the cooling of the Earth, there is still considerable debate about the relationship between heat loss and internal temperature. The difficulty stems from the complexity of the Earth’s mantle system, which loses heat through three different mechanisms: depletion of primordial heat that was accumulated during the accretion process, depletion of internal heat sources through radioactive decay and, last but not least, loss of radioactive elements to continental crust that does not participate in convective overturn. Although this is seldom discussed, the latter plays a major role. According to present estimates, the mantle may have lost as much as half of its radioactive elements to the continental crust (Jaupart et al.
Reference Jaupart, Labrosse, Mareschal, Bercovici and Schubert2007). In such conditions, convection has become increasingly sensitive to heat supply from the core. The extraction of radioactive elements from the mantle is effected mostly in subduction zones where downgoing plates lose their radioactive elements to fluids and magmas that get incorporated in continental crust (Taylor & McLennan Reference Taylor and McLennan1985). Downgoing plates therefore act as local sources of depleted material and are responsible for a heterogeneous distribution of mantle heat sources. Yet another consequence of continental growth is a change of upper boundary conditions. Whereas surface motions occur in the oceanic domain, a situation that can be approximated by a free surface, continents behave as rigid boundaries instead. One might therefore expect a gradual change of behaviour of the upper boundary through time, from that of a free surface in early stages to that of a rigid one later on. Our sister planet Venus, for example, currently does not allow surface motions (Turcotte Reference Turcotte1995).
Dealing with the secular evolution of the Earth requires the handling of many different processes. Important goals include the rate of surface renewal and the rate of volcanism and degassing so that one can deduce the mass of the atmosphere from that of the solid planet. These require estimates of both heat loss, which sets the net rate of surface renewal, and internal temperature, which sets the depth range and rate of melting, as a function of time. Because of the variety of conditions that come into play, for want of an all-encompassing physical model that is presently beyond our reach, calculations are best tackled using a so-called ‘parametrized’ approach, such that the physics of convection is collapsed into a single equation relating the surface heat flux to the temperature difference across the upper boundary layer. This approach has been used in many natural systems, including lava flows (Garel et al.
Reference Garel, Kaminski, Tait and Limare2012), magma reservoirs (Jaupart & Brandeis Reference Jaupart and Brandeis1986; Worster, Huppert & Sparks Reference Worster, Huppert and Sparks1990), silicate planets (McKenzie & Weiss Reference McKenzie and Weiss1975; McNamara & van Keken Reference McNamara and van Keken2000; Deschamps et al.
Reference Deschamps, Yao, Tackley and Sanchez-Valle2012), the atmosphere (Krishnamurti Reference Krishnamurti1997) and lakes (Neralla & Danard Reference Neralla and Danard1975), amongst others. Recently, it has also been used to study the evolution of super-Earths, i.e. massive planets in remote planetary systems (Kite, Manga & Gaidos Reference Kite, Manga and Gaidos2009). The ‘parametrized’ approach relies on a scaling law, first introduced by Townsend (Reference Townsend1964), which states that the surface heat flux
 ${\it\phi}$
is determined locally by the dynamics of the upper boundary layer independently of the total thickness of fluid
 $$\begin{eqnarray}{\it\phi}=C{\it\lambda}\left(\frac{{\it\rho}g{\it\alpha}}{{\it\kappa}{\it\mu}}\right)^{1/3}{\rm\Delta}T_{TBL}^{4/3},\end{eqnarray}$$
where
 $C$
is a proportionality constant,
 ${\it\lambda}$
is the thermal conductivity,
 ${\it\rho}$
is the density,
 $g$
is the acceleration of gravity,
 ${\it\alpha}$
is the thermal expansion coefficient,
 ${\it\kappa}$
is the thermal diffusivity,
 ${\it\mu}$
is the dynamic viscosity of the fluid and
 ${\rm\Delta}T_{TBL}$
is the temperature contrast across the upper thermal boundary layer (TBL). A large number of studies, both theoretical and experimental, have been devoted to delineate its domain of validity with a focus on the power-law exponent. However, the effects of the boundary conditions (Grasset & Parmentier Reference Grasset and Parmentier1998; Choblet & Parmentier Reference Choblet and Parmentier2009) and of the mode of heating of the fluid layer (Hansen, Yuen & Malevsky Reference Hansen, Yuen and Malevsky1992; Sotin & Labrosse Reference Sotin and Labrosse1999; Parmentier & Sotin Reference Parmentier and Sotin2000) have received less attention, but they clearly deserve scrutiny. For example, for free surface boundary conditions, the constant of proportionality
 $C$
changes by 25 % between the two modes of heating (i.e. internal heating due to distributed heat sources or heating from below). According to the small number of studies available, the impact of the mechanical boundary conditions is more important and may be as large as 50 % (Jaupart & Mareschal Reference Jaupart and Mareschal2011). Such differences may seem small but they cannot be ignored, all the more so because the boundary conditions and dominant heating mode may change with time in a telluric planet, as explained above. Changing the value of
 $C$
by
 $50\,\%$
implies a
 $36\,\%$
change of
 ${\rm\Delta}T$
, or
 ${\approx}360~\text{K}$
for
 ${\rm\Delta}T\approx 10^{3}$
K. In comparison, the total amount of cooling of the Earth over the last 3 Gyr is only
 ${\approx}200~\text{K}$
(Herzberg, Condie & Korenaga Reference Herzberg, Condie and Korenaga2010).
The characteristics of Rayleigh–Bénard convection at the high values of the Rayleigh number relevant to telluric planets have been investigated extensively both in the laboratory and with numerical calculations. In addition, a comprehensive theoretical framework leading to scaling laws for the main variables of interest over wide ranges of Rayleigh and Prandtl numbers is available (Grossmann & Lohse Reference Grossmann and Lohse2000). The vast majority of these studies, however, have dealt with rigid boundaries, which is not appropriate for the Earth. Except for the study by Katsaros et al. (Reference Katsaros, Liu, Businger and Tillman1977), free surface boundary conditions have only been investigated using numerical calculations. As regards the characteristics of convection in fluid layers that are internally heated, our current knowledge is more fragmentary. Numerical calculations are only available for free surface boundary conditions in the limit of infinite Prandtl number (Parmentier, Sotin & Travis Reference Parmentier, Sotin and Travis1994; Grasset & Parmentier Reference Grasset and Parmentier1998; Sotin & Labrosse Reference Sotin and Labrosse1999; Parmentier & Sotin Reference Parmentier and Sotin2000) and there have been very few laboratory experiments owing to difficulties in controlling the distribution of the volumetric heating rate in a large volume. Most of these experiments aimed at documenting the planform of convection (Tritton & Zarraga Reference Tritton and Zarraga1967; Schwiderski & Schwab Reference Schwiderski and Schwab1971; Kulacki & Goldstein Reference Kulacki and Goldstein1972; Tasaka et al. Reference Tasaka, Kudoh, Takeda and Yanagisawa2005; Takahashi et al. Reference Takahashi, Tasaka, Murai, Takeda and Yanagisawa2010) and only one of them involved temperature and heat flux measurements (Kulacki & Nagle Reference Kulacki and Nagle1975). That latter study was conducted in water, a fluid with a Prandtl number of order 1, with a very small number of temperature probes. The experimental set-up allowed the determination of a scaling law for the heat flux but was ill-suited to the measurement of the vertical temperature profile through the layer, which is of interest in itself. The dearth of studies on internally heated fluids has motivated us to develop a novel experimental technique that achieves a uniform rate of volumetric heating in a fluid layer. The technique can also be used in other configurations, including a heterogeneous distribution of heat sources in controlled conditions. In order to validate the technique, the present work has been limited to a homogeneous distribution.
Our novel experimental design relies on the absorption of microwave (MW) radiation in a fluid layer with rigid boundaries. We are able to achieve high values of the Rayleigh–Roberts number, which is the analogue of the Rayleigh number for an internally heated fluid, at high Prandtl numbers. Non-invasive techniques are used to measure both temperature and velocity fields within the fluid layer and to determine the horizontal planform of convection. We determine vertical profiles of the horizontally averaged temperature and convective heat flux and we derive scaling laws for the temperature difference and for the thickness of the upper thermal boundary layer. In order to assess the accuracy of the laboratory measurements, we carry out high-resolution numerical calculations in exactly the same three-dimensional (3D) configuration using the convection code Stag3D (Tackley Reference Tackley1993). These calculations account for the exact temperature dependence of the working fluid physical properties. For comparison with previous studies, we also carry out numerical simulations for free boundaries with constant fluid properties. Scaling laws for the main variables of interest are derived for the two types of boundary conditions. We show that, for a given bulk heat flux, the temperature difference across the upper boundary layer is significantly higher below a rigid boundary than below a free one. The importance of this is illustrated by comparing predictions for planets with free boundaries, like the Earth, and planets with rigid ones, like Venus.
2. Laboratory experiments and numerical simulations
2.1. Relevant dimensionless numbers
Convection generated by bottom heating and top cooling (Rayleigh–Bénard convection) is described by two dimensionless numbers: the Rayleigh number and the Prandtl number. The Rayleigh number,
 $\mathit{Ra}$
, defines the vigour of convection and represents the ratio of the driving thermal buoyancy forces over the thermal and viscous dissipation,
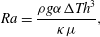 $$\begin{eqnarray}\mathit{Ra}=\frac{{\it\rho}g{\it\alpha}{\rm\Delta}Th^{3}}{{\it\kappa}{\it\mu}},\end{eqnarray}$$
where
 ${\rm\Delta}T$
is the temperature difference between the top and bottom of the layer and
 $h$
is the layer thickness. Convection starts when
 $\mathit{Ra}$
exceeds a critical value (Chandrasekhar Reference Chandrasekhar1961), and follows a sequence of transitions toward chaos as
 $\mathit{Ra}$
increases. The second parameter, the Prandtl number, represents the ratio of momentum diffusivity over heat diffusivity,
 $$\begin{eqnarray}Pr=\frac{{\it\nu}}{{\it\kappa}},\end{eqnarray}$$
where
 ${\it\nu}={\it\mu}/{\it\rho}$
is the kinematic viscosity. When
 $\mathit{Pr}\gg 1$
inertial effects are negligible compared to viscous ones and the fluid motion stops as soon as the heat source is cut off. This is the case for telluric mantles, where
 $\mathit{Pr}>10^{23}$
.
In the purely internally heated case, the temperature scale for convection is related to the internal heating rate,
 $$\begin{eqnarray}{\rm\Delta}T_{H}=\frac{Hh^{2}}{{\it\lambda}},\end{eqnarray}$$
where
 $H$
is the heat generated per unit volume. The resulting Rayleigh–Roberts number (Roberts Reference Roberts1967) is
 $$\begin{eqnarray}\mathit{Ra}_{H}=\frac{{\it\rho}g{\it\alpha}Hh^{5}}{{\it\lambda}{\it\kappa}{\it\mu}}.\end{eqnarray}$$
Predicting the behaviour of complex natural systems such as planetary mantles requires the determination of scaling laws derived from fundamental physical principles that have been tested against experimental or numerical results. These scaling laws are applicable to natural systems only if the dynamic similarity is respected, i.e. the same boundary conditions (mechanical, thermal, aspect ratio), same rheology and similar balances between the various physical effects described by the dimensionless numbers.
2.2. Laboratory experiments in the microwave oven
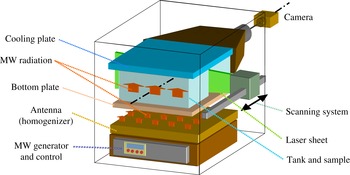
Figure 1 shows the structure of the MW oven, which includes a power generator driven by an embedded control system and an antenna through which the MW radiation propagates towards the working fluid, where it is uniformly absorbed. Our innovative design of the MW circuits guiding the MW radiation into the fluid ensures that a uniform MW field distribution is continuously maintained throughout the heating process (Surducan et al.
Reference Surducan, Surducan, Limare, Neamtu and di Giuseppe2014). The volumetrically heated fluid is cooled from above with an aluminium heat exchanger, which is temperature-controlled by a thermostatic bath. The tank (
 $30\times 30\times 5~\text{cm}^{3}$
) is made of poly(methyl methacrylate), so the bottom and side boundaries are as close as possible to adiabatic. The experimental mechanical boundary conditions are rigid.
Scheme of the microwave-based convection experiment.

The experimental fluids are transparent hydroxyethylcellulose–water mixtures whose viscosity can be varied within a wide range, depending on the polymer concentration. The fluid rheology was characterized with a Thermo Scientific Haake rheometer RS600, its density and thermal expansion were measured with a DMA 5000 Anton Paar densimeter (Limare et al.
Reference Limare, Surducan, Surducan, Neamtu, di Giuseppe, Vilella, Farnetani, Kaminski and Jaupart2013) and its thermal diffusivity was measured by the photopyroelectric method (Dadarlat & Neamtu Reference Dadarlat and Neamtu2009). Values of
 ${\rm\Delta}T_{H}$
and
 $\mathit{Ra}_{H}$
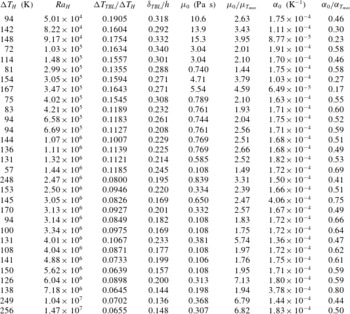
as well as fluid properties for the 30 experiments are listed in table 1. Experimental values of
 $\mathit{Pr}$
(
 $3\times 10^{2}<\mathit{Pr}<3\times 10^{4}$
) are large enough for viscous effects to dominate over inertial ones (Davaille & Limare Reference Davaille, Limare, Bercovici and Schubert2007). The experimental
 $\mathit{Ra}_{H}$
is between
 $5\times 10^{4}$
and
 $2\times 10^{7}$
. The fluid properties are temperature-dependent: over the range of experimental conditions, the strongest viscosity reduction is 0.15 with respect to the value at surface temperature
 $T_{0}$
, thermal expansion increases by a factor of maximum 5.2, whereas the temperature variation of thermal diffusivity is negligible.
Laboratory experimental parameters:
 ${\rm\Delta}T_{H}$
is calculated with
 $H$
determined from the heat flux at the top surface at steady state;
 $\mathit{Ra}_{H}$
is calculated with fluid parameters at mean temperature
 $T_{mean}$
at steady state;
 ${\it\mu}_{0}$
and
 ${\it\alpha}_{0}$
are the viscosity and the thermal expansion at surface temperature
 $T_{0}$
. We also indicate the ratios of viscosity and thermal expansion at
 $T_{0}$
with respect to their values at
 $T_{max}$
to quantify the departure from the Boussinesq approximation.

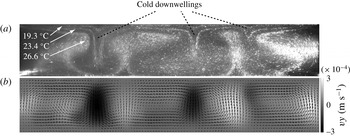
Vertical cross-section through the convecting fluid: isotherms (a) and the associated velocity field (b) for
 $\mathit{Ra}_{H}=3\times 10^{5}$
.

During the experiments, the convecting fluid was scanned with a laser sheet over half of the tank size. The scattered light is registered by a charge-coupled device (CCD) E-lite camera (1.4 Mpixels, 17 Hz) from LaVision, allowing the measurement of both temperature and velocity fields without perturbing the flow. More specifically, to measure the temperature field we seeded the fluid with six types of thermochromic liquid crystal (TLC) evenly distributed between 19.3 and 36.6 °C. Each TLC produces one bright contour (i.e. an isotherm) when illuminated by a monochromatic light (Davaille et al.
Reference Davaille, Limare, Touitou, Kumagai and Vatteville2011). We calculated the temperature field of each two-dimensional (2D) cross-section by interpolating the isotherms. The surface temperature
 $T_{0}$
was chosen so that most of the 2D cross-sections contained several isotherms, thereby ensuring a good resolution of the thermal boundary layer. This is important because the temperature structure of the TBL is used to calculate the surface heat flux
 ${\it\phi}$
, and hence the actual volumetric heat source
 $H$
, since at steady state
 ${\it\phi}=H\times h$
, where
 $h$
is the tank height.
To measure the velocity field, we seeded the fluid with small hollow glass spheres, behaving as passive tracers. Using particle image velocimetry (package DaVis from LaVision) we calculated the velocity field by cross-correlating successive images. We derived the 3D vertical velocity field by interpolation of a large number of vertical cross-sections obtained at different laser positions during an experiment. We then determined the horizontal planforms by contouring the distribution of vertical velocity in a horizontal plane. Figure 2 shows a vertical cross-section of the convecting fluid for an experiment at
 $\mathit{Ra}_{H}=3.0\times 10^{5}$
. The thermal structure revealed by the isotherms (figure 2
a) clearly indicates that convection is characterized by several cold instabilities originating from the top boundary layer. The corresponding velocity field (figure 2
b) shows that cold instabilities generate a localized downwelling flow, whereas broad zones of non-buoyant upwellings are associated with the return flow.
2.3. Numerical simulations
To validate the laboratory experiments, and to further extend the parameter space, we conduct numerical simulations in 3D Cartesian geometry using the parallel code Stag3D by Tackley (Reference Tackley1993). This well-known code solves the equations governing convection in the limit of infinite Prandtl number and has been benchmarked successfully on several occasions: the mass conservation
 $$\begin{eqnarray}\boldsymbol{{\rm\nabla}}\boldsymbol{\cdot }\boldsymbol{u}=0,\end{eqnarray}$$
conservation of momentum
 $$\begin{eqnarray}2\boldsymbol{{\rm\nabla}}\boldsymbol{\cdot }\bar{{\it\mu}}\unicode[STIX]{x1D65A}-\boldsymbol{{\rm\nabla}}p=\mathit{Ra}_{H}\bar{{\it\alpha}}(T-T_{0})\widehat{\boldsymbol{z}},\end{eqnarray}$$
and conservation of energy
 $$\begin{eqnarray}\boldsymbol{{\rm\nabla}}\boldsymbol{\cdot }\boldsymbol{{\rm\nabla}}T+H=\frac{\partial T}{\partial t}+\boldsymbol{u}\boldsymbol{\cdot }\boldsymbol{{\rm\nabla}}T=\frac{\text{D}T}{\text{D}t},\end{eqnarray}$$
where
 $\boldsymbol{u}$
is the velocity vector,
 $\unicode[STIX]{x1D65A}$
is the strain rate tensor,
 $p$
is the dynamic pressure,
 $T$
is the temperature and
 $\widehat{\boldsymbol{z}}$
is a unit vector in the vertical direction. Fluid properties are assumed constant except for the thermal expansivity and dynamic viscosity, which are normalized to their values at top temperature
 $T_{0}$
(
 $\bar{{\it\alpha}}$
and
 $\bar{{\it\mu}}$
are the dimensionless thermal expansivity and viscosity, respectively). The Cartesian domain is divided into
 $512\times 512\times 64$
elements, with the same aspect ratio of 6 as in the experimental tank, corresponding to a horizontal and vertical resolution of 0.6 mm and 0.8 mm, respectively. The top boundary condition is isothermal whereas the bottom one is adiabatic. The vertical sides of the domain are reflecting.
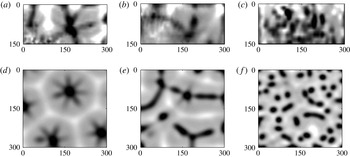
Our first set of simulations is designed to reproduce the experimental conditions, in particular the rigid mechanical boundary conditions at top and bottom and the fluid properties. Thermal expansion and viscosity are temperature-dependent following the measurement made on laboratory fluids (table S1 in the supplementary material available at http://dx.doi.org/10.1017/jfm.2015.347), while other fluid properties are constant. Figure 3 shows convection planforms that have been derived from the horizontal distribution of the vertical velocity component in both laboratory experiments (a–c) and numerical calculations (d–f). Three different patterns can be defined using either method. For
 $\mathit{Ra}_{H}<10^{5}$
a steady spoke-like pattern is found, in agreement with previous studies (Ichikawa et al.
Reference Ichikawa, Kurita, Yamagishi and Yanagisawa2006; Takahashi et al.
Reference Takahashi, Tasaka, Murai, Takeda and Yanagisawa2010). For
 $\mathit{Ra}_{H}>10^{6}$
the pattern is time-dependent and involves numerous isolated plume-like downwellings. In the intermediate Rayleigh–Roberts number range (
 $10^{5}<\mathit{Ra}_{H}<10^{6}$
), the complex pattern is best described as a combination of residual spoke features and sheet-like downwellings.
Convection planforms obtained from the 2D horizontal cross-section of the vertical velocity: downwellings (black) and upwellings (white); (a–c) experimental results; (d–f) numerical simulations; (a,d)
 $\mathit{Ra}_{H}=6\times 10^{4}$
, (b,e)
 $\mathit{Ra}_{H}=1.5\times 10^{5}$
, (c,f)
 $\mathit{Ra}_{H}=10^{6}$
. Lateral dimensions are in millimetres. Gray shades are scaled to
 $\pm$
root mean squared velocity.

For the sake of comparison with simple theoretical scalings, we have also carried out a second set of numerical simulations with rigid boundary conditions but with constant physical properties of the fluid. In a third set of calculations with constant fluid properties, we have investigated the effect of free-slip boundary conditions (see tables S2 and S3 in the supplementary material). Finally, we have changed the bottom boundary condition (no slip versus free slip) independently of the upper boundary condition and found no impact on the thermal structure and thickness of the upper boundary layer. This may be expected at large values of the Rayleigh–Roberts number because the dynamics of the upper boundary layer are locally determined. Figure S1 in the supplementary material illustrates this conclusion.
3. Scaling laws for the thermal boundary layer
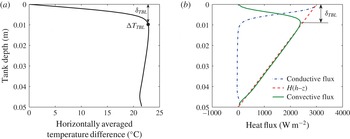
Figure 4(a) shows the vertical profile of the horizontally averaged temperature at steady state. The thermal structure of the convecting layer can be split into an upper boundary layer and a convective interior; there is no basal thermal boundary layer, as no heat is supplied from below. An important feature is that the fluid interior has a slightly negative temperature gradient.
Numerical simulation using constant fluid parameters and rigid boundary conditions at
 $\mathit{Ra}_{H}=10^{6}$
. (a) Vertical profile of the horizontally averaged temperature. (b) Vertical profiles of the three components of the heat balance (3.3): conductive heat flux (blue), cumulative heat generated (red) and convective heat flux (green). The thickness of the upper thermal boundary layer
 ${\it\delta}_{TBL}$
is determined as the vertical position corresponding to the maximum convective heat flux. The temperature difference across the upper thermal boundary layer
 ${\rm\Delta}T_{TBL}$
corresponds to the temperature at a depth
 $z={\it\delta}_{TBL}$
.

If the local temperature is decomposed into its horizontal average
 $\overline{T}(z,t)$
and a fluctuation
 ${\it\theta}$
, then the horizontally averaged heat equation can be written as
 $$\begin{eqnarray}{\it\rho}C_{p}\left[\frac{\partial \overline{T}}{\partial t}+\frac{\partial \overline{w{\it\theta}}}{\partial z}\right]={\it\lambda}\frac{\partial ^{2}\overline{T}}{\partial z^{2}}+H,\end{eqnarray}$$
where
 $w$
is the vertical velocity and
 $C_{p}$
is the heat capacity. At steady state, the horizontally averaged temperature does not depend on time and (3.1) can be reduced to
 $$\begin{eqnarray}0=-\frac{\text{d}}{\text{d}z}\left(-{\it\lambda}\frac{\text{d}\overline{T}}{\text{d}z}+{\it\rho}C_{p}\overline{w{\it\theta}}\right)+H.\end{eqnarray}$$
By integrating (3.2) between
 $z=h$
(the base of the fluid layer) and
 $z=0$
, we obtain the convective heat flux at any depth
 $z$
 $$\begin{eqnarray}{\it\rho}C_{p}\overline{w{\it\theta}}={\it\lambda}\frac{\text{d}\overline{T}}{\text{d}z}+H(h-z).\end{eqnarray}$$
This equation involves three components, the convective and conductive heat fluxes and also the cumulative heat generation, which are illustrated in figure 4(b).
We derive scalings for the characteristics of the upper boundary layer using the viscous dissipation–buoyancy flux balance. For the large values of the Prandtl number of relevance here, the kinetic boundary layer extends over the whole fluid layer. The integral buoyancy flux for the layer is
 $$\begin{eqnarray}\int _{0}^{h}{\it\rho}{\it\alpha}g\overline{w{\it\theta}}\,\text{d}z=\frac{{\it\alpha}g}{C_{p}}\int _{0}^{h}\left[{\it\lambda}\frac{\text{d}\overline{T}}{\text{d}z}+H(h-z)\right]\,\text{d}z=\frac{{\it\alpha}g}{C_{p}}\left(-{\it\lambda}{\rm\Delta}T+H\frac{h^{2}}{2}\right).\end{eqnarray}$$
For large values of the Rayleigh number, we may neglect
 ${\it\lambda}{\rm\Delta}T$
compared to
 $Hh^{2}/2$
. To derive the kinetic dissipation scale, we use velocity scale
 $U$
and assume that the relevant length scale for the flow is the fluid layer depth
 $h$
(Grossmann & Lohse Reference Grossmann and Lohse2000). The kinetic dissipation equation can now be written as
 $$\begin{eqnarray}\int _{0}^{h}{\it\rho}{\it\alpha}g\overline{w{\it\theta}}\,\text{d}z\sim {\it\mu}\left(\frac{U}{h}\right)^{2}h\sim \frac{{\it\alpha}g}{C_{p}}Hh^{2},\end{eqnarray}$$
where dissipation balances buoyancy. At steady state the surface heat flux
 ${\it\phi}=Hh$
and is such that
 $$\begin{eqnarray}{\it\phi}\sim {\it\lambda}\frac{{\rm\Delta}T_{TBL}}{{\it\delta}_{TBL}},\end{eqnarray}$$
where
 ${\rm\Delta}T_{TBL}$
and
 ${\it\delta}_{TBL}$
are the temperature difference and thickness of the upper thermal boundary layer, respectively (see figure 4). For a closure equation, we use the balance between horizontal advection and vertical diffusion in the boundary layer and obtain
 $$\begin{eqnarray}{\it\delta}_{TBL}\sim \left(\frac{{\it\kappa}h}{U}\right)^{1/2}.\end{eqnarray}$$
Substituting (3.7) in (3.6) we obtain
 $$\begin{eqnarray}Hh\sim {\it\lambda}{\rm\Delta}T_{TBL}\left(\frac{U}{{\it\kappa}h}\right)^{1/2}\end{eqnarray}$$
and
 $$\begin{eqnarray}\frac{Hh^{2}}{{\it\lambda}}\sim {\rm\Delta}T_{TBL}\left(\frac{U}{h}\right)^{1/2}\frac{h}{{\it\kappa}^{1/2}}.\end{eqnarray}$$
Using the definition of the temperature scale in (2.3), the dissipation equation (3.5) and
 ${\it\kappa}={\it\lambda}/C_{p}$
, we finally obtain
 $$\begin{eqnarray}\frac{{\rm\Delta}T_{TBL}}{{\rm\Delta}T_{H}}\sim \left(\frac{h}{U}\right)^{1/2}\frac{{\it\kappa}^{1/2}}{h}\sim \left(\frac{{\it\mu}C_{p}}{{\it\alpha}gHh}\right)^{1/4}\frac{{\it\kappa}^{1/2}}{h}\sim \left(\frac{{\it\mu}{\it\lambda}{\it\kappa}}{{\it\alpha}gHh^{5}}\right)^{1/4}.\end{eqnarray}$$
We therefore obtain the explicit dependence of the dimensionless temperature contrast
 ${\rm\Delta}T_{TBL}/{\rm\Delta}T_{H}$
as a power function of
 $\mathit{Ra}_{H}$
,
 $$\begin{eqnarray}\frac{{\rm\Delta}T_{TBL}}{{\rm\Delta}T_{H}}=C_{T}\mathit{Ra}_{H}^{{\it\beta}},\end{eqnarray}$$
where
 $C_{T}$
is a constant scaling coefficient and
 ${\it\beta}=-1/4$
.
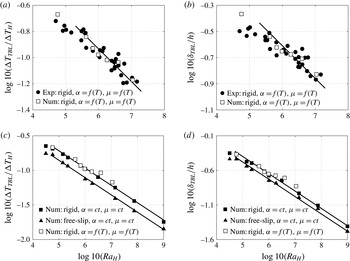
(a,b) Dimensionless TBL temperature (a) and thickness (b) versus
 $\mathit{Ra}_{H}$
for experiments (full circles) and numerical simulations (empty squares) obtained with rigid boundary conditions and temperature dependence of the fluid parameters. (c,d) Numerical simulations results for the dimensionless TBL temperature (c) and thickness (d) versus
 $\mathit{Ra}_{H}$
. Black lines are power-law best fits with
 ${\it\beta}=-1/4$
. Legends indicate the implemented conditions.

One can determine a scaling law for the boundary layer thickness in two different ways. The first one is to use the heat flux and temperature drop (3.6), which leads to the same power-law scaling as the temperature drop. Alternatively, one can rely on the characteristics of the vertical convective heat flux profile and define the base of the thermal boundary layer where the convective heat flux (green curve) reaches its maximum value (Davaille & Jaupart Reference Davaille and Jaupart1993). This second method has the advantage of allowing us to check that the experimentally determined heat flux profile changes as a function of the Rayleigh number in a self-consistent manner. This leads to the following scaling law for the TBL thickness:
 $$\begin{eqnarray}\frac{{\it\delta}_{TBL}}{h}=C_{{\it\delta}}\mathit{Ra}_{H}^{{\it\beta}},\end{eqnarray}$$
where
 $C_{{\it\delta}}$
is a constant scaling coefficient.
Figure 5(a,b) shows the dimensionless TBL temperature and thickness for laboratory experiments (full circles) and corresponding numerical simulations (empty squares) also provided in table 1 and table S1–S3 in the supplementary material. The experimental and numerical results are in good agreement over a large range of Rayleigh number. The larger scatter of the laboratory determinations can be attributed to errors inherent in the interpolation of discrete isotherms to obtain the temperature field. The power-law scalings that have been derived above capture the main trends of the data for both the temperature contrast and the boundary layer thickness. As discussed below, these scalings rely on the Boussinesq approximation, which is not entirely valid for these experiments. For
 ${\it\beta}=-1/4$
we can estimate the best-fitting scaling coefficients:
 $C_{T}=3.56$
,
 $C_{{\it\delta}}=7.36$
for the experiments, and similar values (
 $C_{T}=3.58$
,
 $C_{{\it\delta}}=7.50$
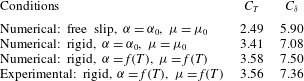
) are found for the numerical simulations (table 2). The linear fit was calculated using standard linear regression analysis performed in Matlab with input data
 $\log (RaH)$
and
 $\log ({\rm\Delta}T_{TBL}/{\rm\Delta}T_{H})$
and
 $\log ({\it\delta}_{TBL}/h)$
, respectively.
The next issue we want to address is to what extent these coefficients are affected by the mechanical boundary conditions and by the departure from the Boussinesq approximation. Figure 5(c,d) shows our three sets of numerical simulations: with rigid boundary conditions and temperature-dependent fluid properties (empty squares), with rigid boundary conditions and constant fluid parameters (full squares), and with free-slip boundary conditions and constant fluid parameters (full triangles). For rigid boundary conditions, the use of constant fluid parameters significantly reduces the scatter, and the best-fitting coefficients are
 $C_{T}=3.41$
,
 $C_{{\it\delta}}=7.08$
(table 2). The most striking result is the difference between rigid and free-slip boundary conditions: at all values of
 $\mathit{Ra}_{H}$
, the ratio
 ${\rm\Delta}T_{TBL}/{\rm\Delta}T_{H}$
is always lower for free-slip than for rigid boundary conditions, so that the best-fitting coefficient for free slip is
 $C_{T}=2.49$
, a value in agreement with Parmentier & Sotin (Reference Parmentier and Sotin2000). In other words,
 $C_{T}$
for free slip is 37 % lower than for rigid boundary conditions, and
 $C_{{\it\delta}}=5.90$
is 22 % lower. This result has important implications for the interior temperature of planets as discussed in the following section. Here we note that the scaling laws (3.11) and (3.12) are valid from particularly low values of Rayleigh–Roberts number (
 $\mathit{Ra}_{H}\sim 6\times 10^{4}$
), for which convection is time-independent, to the highest values explored (
 $\mathit{Ra}_{H}=10^{9}$
). Values for the power-law coefficients have also been obtained with
 ${\it\beta}$
left to vary (table 3). We focus on
 ${\rm\Delta}T_{TBL}$
because it is determined more precisely than
 ${\it\delta}_{TBL}$
(the peak value can be determined more precisely than the location of the peak). In the example of figure 4(a), the spatial resolution of our set-up (0.6 mm) leads to an uncertainty of approximately 12 % for the boundary layer thickness, whereas the measurement error on the temperature difference is only 0.3 %. We find that, within the range of uncertainty, values for exponent
 ${\it\beta}$
are consistent with the result of our simple analysis (3.11). As expected, for constant fluid properties, the exponent
 ${\it\beta}$
is closer to
 $-1/4$
than for the experiments and numerical simulations with temperature-dependent fluid properties.
Scaling law constants for the thermal boundary layer when
 ${\it\beta}=-1/4$
.
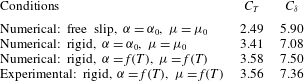
Scaling law constants for the thermal boundary layer when the
 ${\it\beta}$
value is left to vary.

4. Planetary application: mantle potential temperature for the Earth and Venus
Our scaling laws can be used to estimate mantle potential temperature in telluric planets dominated by internally heated convection. We are aware that our analysis ignores the depth and temperature dependence of mantle properties, yet it is worthwhile to investigate the impact of the boundary conditions on the internal thermal structure of the Earth and Venus, and this can be done in a first step with a simple physical system. These two telluric planets share many similarities, but the mechanical top boundary conditions differ, since on Venus there is no active plate tectonics. On both planets, the bottom boundary condition is set by the liquid outer core and hence is closer to free-slip behaviour than to a rigid one. However, as explained in § 2.3, the characteristics of the upper boundary layer are not sensitive to the behaviour of the lower boundary. The same is true for the internal thermal structure, except for a thin lower region, which is not relevant to the present discussion. Additional differences between our experiments and planetary mantles are the presence of sidewalls and geometrical characteristics (i.e. a horizontal layer and a spherical shell). In a large-aspect-ratio tank such as ours, however, the bulk convection characteristics are affected only weakly by local sidewall motions. This is shown by comparing our results with those of Parmentier & Sotin (Reference Parmentier and Sotin2000), for example, who carried out high-precision numerical calculations in domains with different values of the aspect ratio. We also expect that the spherical shell geometry does not influence the upper boundary layer characteristics greatly (see Jarvis, Glatzmaierand & Vangelov Reference Jarvis, Glatzmaierand and Vangelov1995).
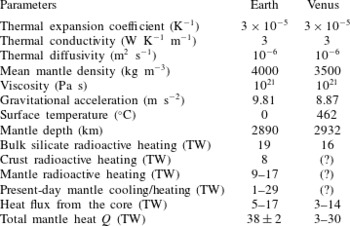
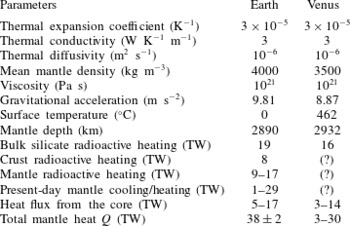
Parameters for the Earth and Venus used in our estimation.
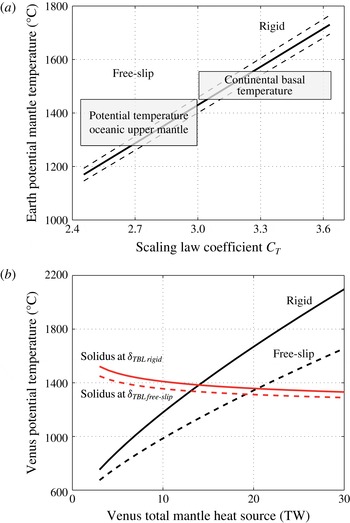
(a) Estimates of the Earth’s potential temperature using the temperature scaling law, as a function of the coefficient
 $C_{T}$
. The solid line was obtained for a value of total mantle heat source
 $Q=38~\text{TW}$
, and dashed lines for
 $Q=38\pm 2$
TW. Rectangles represent estimates of the potential oceanic and continental upper mantle temperatures (McKenzie & Bickle Reference McKenzie and Bickle1988; Jaupart et al.
Reference Jaupart, Labrosse, Mareschal, Bercovici and Schubert2007; Putirka, Perfit, Ryerson & Jackson Reference Putirka, Perfit, Ryerson and Jackson2007; Jaupart & Mareschal Reference Jaupart and Mareschal2011). (b) Estimates of Venus’s potential temperature using the temperature scaling law for rigid (solid line) and free-slip (dashed line) boundary conditions, as a function of the total mantle heat source. Red curves represent the solidus potential temperature at a pressure corresponding to the thermal boundary layer thickness: rigid (solid line) and free slip (dashed line).

For the Earth, the total mantle heat source available for convection is known:
 $Q=38\pm 2$
TW (Jaupart et al.
Reference Jaupart, Labrosse, Mareschal, Bercovici and Schubert2007). Using the parameters given in table 4, we obtain
 $\mathit{Ra}_{H}=3\times 10^{9}$
and
 ${\rm\Delta}T_{H}=10^{5}$
K. We calculate
 ${\rm\Delta}T_{TBL}$
according to (3.11) for the range of
 $C_{T}$
previously determined, since low
 $C_{T}$
values (free-slip condition) are more appropriate to moving oceanic lithosphere whereas high
 $C_{T}$
values (rigid condition) better apply to continents. Figure 6(a) illustrates the mantle potential temperature versus the coefficient
 $C_{T}$
, showing an increasing trend from free slip to rigid. Grey rectangles represent a compilation of mantle potential temperature values (1280–1450 °C) from McKenzie & Bickle (Reference McKenzie and Bickle1988), Jaupart et al. (Reference Jaupart, Labrosse, Mareschal, Bercovici and Schubert2007) and Putirka et al. (Reference Putirka, Perfit, Ryerson and Jackson2007) and temperatures (1450–1550 °C) at the base of the continents (Jaupart & Mareschal Reference Jaupart and Mareschal2011). These temperature ranges superpose well on our estimates, showing that a simple temperature scaling law is able to describe the present thermal state of the Earth, as inferred by geological models. Our scaling laws are based on a homogeneous distribution of internal heat sources, and it is not clear whether or not this is also true for planetary mantles. It has been proposed that the Earth’s mantle is stratified, with a lower region that is enriched compared to the bulk, but current constraints on the uranium and thorium contents of the Earth are not sufficiently precise for a definitive conclusion (see the discussion of mantle heat production in Jaupart et al. (Reference Jaupart, Labrosse, Mareschal, Bercovici and Schubert2007)). Radioactive decay is not the only energy source driving convective motions in the interior of planets, and its contribution is probably not as large as the loss of sensible heat (Jaupart et al.
Reference Jaupart, Labrosse, Mareschal, Bercovici and Schubert2007). In all cases, one may reasonably expect that the dynamics of the upper boundary layer are not sensitive to the details of the vertical (or radial) distribution of heat sources. This deserves an independent study with a degree of stratification that is left to vary because, as mentioned above, current constraints on the Earth’s mantle are not robust. In fact, as stated in the introduction, one motivation for our experimental design was to allow us to investigate the consequences of a heterogeneous distribution of heat sources.
Surface boundary conditions on Venus may alternate between rigid, as present day, and free-slip during short periods of resurfacing (Turcotte Reference Turcotte1995; Armann & Tackley Reference Armann and Tackley2012). Contrary to the Earth, the total mantle heat source is poorly constrained (3–30 TW; see table 4). The bulk silicate radioactive heat source, scaled to the Earth’s mass, is 16 TW (Smrekar & Sotin Reference Smrekar and Sotin2012). The crustal radioactive heating is unknown, although the five measurements by Vega and Venera landers indicate concentrations of heat-producing elements similar to mid-oceanic ridge basalts and oceanic islands basalts (Turcotte Reference Turcotte1995). Therefore, Venus’s present-day crust might contain a non-negligible quantity of radioactive elements that do not contribute to mantle convection. Heat flux from the core, estimated by Nimmo (Reference Nimmo2002) to be between 1.2 and 3.7 TW, could be as high as 3 and 14 TW if recalculated with recent thermal conductivity values (Gomi et al. Reference Gomi, Ohta, Hirose, Labrosse, Caracas, Verstraete and Hernlund2013). Given all these uncertainties, we calculate Venus’s potential temperature over a range of total mantle heat sources to be between 3 and 30 TW (figure 6 b).
For rigid boundary condition (
 $C_{T}=3.4$
, black, solid line), the potential temperature is higher than for free slip (
 $C_{T}=2.5$
, black, dashed line). High potential temperatures may lead to widely spread zones of partial melting beneath the thermal boundary layer. To check this hypothesis, we calculate the dry peridotite solidus temperature (Smrekar & Sotin Reference Smrekar and Sotin2012) at the pressure corresponding to the base of the TBL. Equation (3.12) gives a TBL depth between 75 and 140 km for free slip and 90–170 km for rigid boundary conditions. Solidus temperatures are then converted to potential temperatures (red lines in figure 6
b). We find that in the free-slip case, partial melting would occur for mantle heat source values
 ${>}19$
TW, whereas for the rigid case, partial melting would start at values
 ${>}14$
TW. Another implication is that a change of the top boundary condition from free slip to rigid favours partial melting since the increase in potential temperature is larger than the increase in solidus temperature induced by the thermal boundary layer thickening.
5. Conclusion
We present a new experimental method to generate internal heating by microwave absorption. This prototype offers the ability to reach high
 $\mathit{Ra}_{H}$
and
 $\mathit{Pr}$
numbers, relevant for planetary convection. Our experimental results are compared with numerical simulations conducted in 3D Cartesian geometry, thereby providing the first cross-validation of experimental and numerical studies of convective viscous systems heated from within. We find that thermal boundary layer temperature and thickness scale with
 $\mathit{Ra}_{H}^{-1/4}$
as theoretically predicted by scaling arguments on the dissipation of kinetic energy (Jaupart & Mareschal Reference Jaupart and Mareschal2011). We further test numerically the effect of the top mechanical boundary condition. At a given
 $\mathit{Ra}_{H}$
, the boundary layer temperature is 37 % higher for rigid than for free-slip boundary condition and its thickness is 22 % greater.
Temperature scaling laws are used to evaluate the mantle temperatures of the Earth and Venus. For the Earth, our estimates match well the potential temperature of the oceanic upper mantle and the temperature at the base of continents inferred from geological data. For Venus, our results indicate the probable presence of partial melting underneath its lithosphere.
Finally, our specific microwave-based method offers the new perspective, unattained up to now experimentally, to selectively heat different zones of a convecting fluid, analogous to heterogeneous convection in the presence of chemical reservoirs with distinct concentration of radioactive isotopes.
Acknowledgements
We would like to thank the reviewers for their fruitful comments that improved the manuscript and J.-M. Chomaz for his editorial handling. This work was funded by the ANR-11-IS04-0004 project for the French team and by the 1 RO-FR-22-2011 Romanian–French bilateral project for the Romanian team. Numerical computations were performed on the S-CAPAD platform, IPGP, France, and using HPC resources from GENCI-IDRIS (grant 2013-047033). This is IPGP contribution number 3640.
Supplementary data
Supplementary data are available at http://dx.doi.org/10.1017/jfm.2015.347.