


1. Introduction
Since 1962 the Australian National Antarctic Research Expeditions have travelled to the Amery Ice Shelf, from Mawson, each summer to carry out a program of measurements. The routes travelled, the measurements carried out and the methods used have been discussed by Reference Landon-SmithLandon-Smith ([1964], Reference Landon-Smithunpublished) and Reference BuddBudd (1965). The route travelled in 1963 and 1964 is shown in Fig. 1. The general results of the preliminary analysis of the measurements of elevation and slope, velocity, strain-rate, accumulation, and surface temperature, over the ice shelf are shown in Table I and Figures 2 to 8. Further results calculated from these are shown in Table II. A detailed presentation of the measurements is in preparation. The purpose of this paper is to present the general form of the results together with theoretical considerations of their import.
The route from Mawson to the Amery Ice Shelf and over the Amery Ice Shelf covered in 1363 and 1364. Accumulation slakes 3 km. apart covered the ice-shelf route. Strain grids were located at e, g1, g2 and g3. Detailed sunfixes were carried out at e, g1, g2, g3 and t2

Ice thickness profile for the Amery Ice Shelf estimated from the measured elevation profile from t5 to t4 and the elevation-thickness results of Crary for the Ross Ice Shelf. Velocity, longitudinal strain-rate, and accumulation rate along the ice shelf are shown schematically to scale

Velocity distribution along the Amery Ice Shelf centre-line is shown, as determined from repeated astrofixes at g1,g2,g3 and resections to rock features at g2 and g3

Longitudinal strain-rate along the ice shelf as determined from measurements of strain grids with diagonals of 1,500 m. re-surveyed after one year, at g1, g2 and g3

Accumulation rate along the ice shelf from t5 to t4 as obtained from the mean of 5 stakes each 16 km. planted in 1963 and re-read in 1964 (○), and from the mean over several years from the pit studies of Landon-Smith in 1962 (×). Note that since 1963 the ice front is about 60 km. closer than previously. The values of accumulation have been converted from the equivalent snow depth by using a constant density factor of 0.35 g. cm.−3

Variation in accumulation rate across the ice shelf as shown from the average accumulation measurements of the stake lines e, g1, t1; t3, g3, t2. There is little variation across the ice shelf compared with along the ice shelf


The annual mean air temperature on the surface of the Amery Ice Shelf plotted against the distance from the front. The values were determined from the temperatures in the firm between 4 and 10 m. from t5 to g3

Measured Parameters on the Amery Ice Shelf

Deduced Parameters for the Amery Ice Shelf

2. Discussion of Results of Measurements
2.1. Surface slope and ice thickness
The Amery Ice Shelf is comparatively flat with surface slope increasing gradually from 0.3 × 10⁻⁴ at the front to 1.2 × 10⁻⁴ at g3, then more rapidly to 2.0 × 10⁻⁴ where the Lambert Glacier flows into the ice shelf. By comparison the flattest section of the Ross Ice Shelf (Reference CraryCrary and others, 1962, p. 26) is its central section which rises from 50 to 60 m. in about 350 km. giving a slope of 0.3 × 10⁻⁴. This slope increases as the boundary of the ice shelf is approached to values over 1.0 × 10⁻⁴. On the eastern side of the Ross Ice Shelf near “Little America” the slope is much greater, about 6×10⁻⁴ (Reference Crary and ChapmanCrary and Chapman, 1963).
Since measurements of ice thickness along the Amery Ice Shelf have not yet been carried out, estimates of the ice thickness have been made from the ice thickness and elevation results for the Ross Ice Shelf of Reference CraryCrary and others (1962, p. 62). This is equivalent to postulating that the density distributions of the Ross and Amery Ice Shelves are similar. For a free-floating ice shelf the elevation h, thickness H, mean density ρ , water density ρ w are related by

The resultant profile of the Amery Ice Shelf is shown in Figure 2 along with other associated parameters following the style of Reference Zumberge and SwithinbankZumberge and Swithinbank (1962) for the Ross Ice Shelf, but with the velocity, strain-rates and accumulation rates drawn to scale. This shows that the ice shelf increases slowly in thickness until it approaches the Lambert Glacier, where the thickness increases rapidly. The mean density through the ice shelf, calculated from the above thickness—elevation relation taking ρ w=1.025.g. cm−3, varies from 0.846 g. cm−3 at the front to 0.88 g. cm.−3 at the mouth of the Lambert Glacier.
The central section of the ice shelf traversed in 1964 was smooth and featureless, except for some long tension crevasses in the vicinity of t5, at the northern end, running parallel to the new ice front, and for slight transverse undulations at the southern end near the mouth of the Lambert Glacier where the slope increases from g3 to t4.
2.2. Velocity
Measurements of velocity for positions e, g1, g2, g3 were obtained from astronomical fixes repeated after one year with probable errors of ±100 m. However the measured values agreed well with the values calculated from the measured strain-rates, so values calculated to the nearest 10 m. yr.−1 are listed in Table I and are shown in Figure 3. In addition the velocity value at g2 was confirmed by a repeated resection to rock features of Gillock Island. A similar resection to the northern Prince Charles Mountains carried out at g3 established an upper limit on its velocity.
The ice-shelf speed (cf. Fig. 3) shows a rapid increase towards the ice front. This is further confirmed by the value of the velocity found at the former ice front in 1963 of 1,500 m. yr.−1 (Reference Landon-SmithLandon-Smith [1964]). If the creep rate were constant along the ice shelf then a linear increase of velocity towards the front would be expected.
2.3. Strain-rates
Not only does the velocity increase rapidly towards the front but so also does the creep rate. The measured longitudinal strain-rate is plotted against the distance inland from the ice front (x) in Figure 4, and shows a tendency to decrease to zero as x increases. On the other hand the velocity curve does not tend to zero, but appears to approach asymptotically a value of about 370 m. yr.−1. This velocity is expected to be the surface velocity of the ice at the mouth of the Lambert Glacier.
The transverse strain rate of an ice shelf has been discussed by Reference RobinRobin (1958, p. 121) who showed how the transverse strain-rate is simply related to the forward velocity and the divergence of the flow lines. That this is quite general can be seen as follows. Consider an ice shelf flowing outwards with diverging flow lines. Let θ be the angle of divergence of two flow lines which are distance d apart at a certain position. Let u and v be the forward and transverse components of velocity of the ice shelf. We now take polar coordinates (r, θ) where r is given by d = rθ The radial strain-rate (the rate of extension per unit length of a line in the direction of flow,  ) and the transverse strain rate (the rate of extension of a line perpendicular to the direction of flow,
 ) are given by

(cf. e.g. Reference JaegerJaeger, 1956, p. 45).
Now v is small where the flow lines have a small divergence angle and ∂v/∂θ is negligible over the ice shelf in comparison with u. Hence we write

By smoothing the boundaries of the Amery Ice Shelf we can measure the average divergence angles of the boundary, then from the measured transverse strain-rates at g1, g2, g3 calculate the appropriate velocities to compare with the measured values. Alternatively we could use the velocities to calculate transverse strain-rates. These calculations have been performed but give velocities too low or strain-rates too high. From this we conclude that the divergence angles are smaller than the smoothed boundary divergence. Hence we calculate from the measured velocities and strain-rates the appropriate divergence angles. Table III shows the calculated angles of divergence for the Amery Ice Shelf at g1, g2 and g3.
Calculation of Divergence of Flow Lines

These angles are somewhat smaller than the angles of divergence of the ice-shelf boundary, but because of the irregularities in the boundary these latter angles are difficult to determine precisely. The presence of Gillock Island in the region of g2 may also account for the small transverse strain-rate there.
2.4. Accumulation
Figures 5 and 6 show the annual net accumulation over the ice shelf by a longitudinal profile down the centre and the transverse profiles at each end. The accumulation rate decreases fairly uniformly from 40 g. cm. yr.−1 near the ice front to zero on the Lambert Glacier, where a blue ice surface prevails.
There is only slight variation in accumulation rate across the ice shelf at either end. The small sastrugi, which are oriented predominantly along a direction 200° from true north at the west side and 1.160° at the east side, suggest that winds over the area (which are slight) blow mainly longitudinally down the ice shelf.
The longitudinal profile (Fig. 5) shows the variation in accumulation with distance from the 1965 ice front as measured from stakes during 1964, and from the pit studies of Landon-Smith in 1962. The two profiles are similar except near the front of the ice shelf, but this dissimilarity is accounted for by the change in position of the front by about 60 km. The values of the 1964 accumulation are slightly higher than those found by Reference CraryCrary (1961, p. 75) for the Ross Ice Shelf, “Little America”–“Byrd” line, and considerably higher than those found over the main central section of the Ross Ice Shelf by Reference CraryCrary and others (1962, p. 93). For the Amery Ice Shelf Landon-Smith found an average variation of 11 per cent in accumulation rate from one year to another.
The average density of the surface annual layer was found to be 0.35 g. cm.−3. This increased to an average 0.49 g. cm.−3 at 6 m. depth.
Figure 7 shows the accumulation-rate contours over the ice shelf. The average annual net accumulation for the whole ice shelf was calculated as 28 g. cm.−2.
2.5. Temperature
Annual mean temperatures for the ice-shelf surface have been estimated from the temperature profiles measured in the top 10 m. of the surface. The measurements were carried out in 1962, 1963 and 1964. Figure 8 shows the decrease in annual mean temperature along the ice-shelf centre as the distance from the front increases. Near the ice front, as the ocean is approached, the rate of change of temperature is high, whereas further inland it is much smaller. The annual mean temperature at the ice front is expected to be not far below Mawson’s annual mean temperature of −11°C.
3. Theory of Ice-shelf Velocity Profiles
3.1. Longitudinal velocity profile
3.1.1. The Weertman formula
The creep rate of a flat, horizontal, unbounded ice shelf has been considered by Reference WeertmanWeertman (1957). Take orthogonal axes with x in the line of motion, z vertical from the bottom upwards, and y across the ice shelf. We use the following notation
-
σ ij the stress tensor at (x, y, z), i.e. at xi , where i = 1, 2, 3
-
 the strain-rate tensor at (x, y, z),
-
ui velocity vector at xi
-
H ice-shelf thickness
-
ρ i average ice-shelf density
-
ρ w sea-water density
-
K average horizontal longitudinal creep rate, assumed uniform through the ice shelf
-
B, n parameters of the power law for ice flow
where is the effective shear strain-rate and τ is the effective shear stress.
 the strain-rate tensor at (x, y, z),

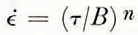 where
 is the effective shear strain-rate and τ is the effective shear stress.
The equations for equilibrium are

Weertman then made the assumptions:
(i)
-
a. the stress components are independent of x (the stress gradient down the ice shelf is negligible, compared with the vertical gradient), and
-
b. the stress components are independent of y (the stress gradient across the ice shelf is negligible).
The equations of equilibrium then reduce to

and

Adopting Nye’s relation for steady-state creep, Weertman deduced for the case of zero transverse creep the following relation for the horizontal stress at depth z:
By making the further assumption:
(ii) at the front of the ice shelf the horizontal force in the ice is balanced by that in the water, i.e.
Weertman obtained for the creep rate
where

Now if equation (3) were to hold along the Amery Ice Shelf we find that the creep rate would have to increase, going from g1 to g3, due mainly to the increase in H (by about 50 per cent). In fact K decreases by a factor of 12. The change in B can be estimated from the change in surface temperature from g1 to g3—a decrease of 2.6°C.
Assuming the form of the temperature–depth distribution does not change radically along the ice shelf then the change in mean temperature is about 2°C. From Figure 11 we can see the temperature change in B around −20°C is not far from linear. Hence from g1 to g3 we may expect a change in B of about 15 per cent. From Table II it can be seen that ρ only increases slightly and v decreases slightly. We have

whereas

So in order to explain the observed variation in velocity and velocity gradient along the ice shelf we consider the effect of the ice shelf being held at its sides.
3.1.2. Velocity gradient in an ice shelf with lateral constraint
For a flat ice shelf of width 2a, deforming according to a power flow law of the form 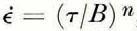 , and held at its sides where the velocity is zero, the velocity at the centre (for purely laminar flow) is given by
where dp/dx is the uniform pressure gradient down the ice shelf (cf. Reference NyeNye, 1952, p. 84; Reference JaegerJaeger, 1956, p. 109)
This result can be deduced from the general equations of equilibrium by assuming:
(iii) the velocity gradients other than ∂V/∂y (across the ice shelf) are sufficiently small to be neglected.
Now equation (4) shows that the effect of the drag of the sides on the ice shelf is to balance a pressure gradient down the ice shelf. For the Amery Ice Shelf it appears that this drag of the sides should be used to balance the stress gradient in the ice shelf rather than the force of the water of Weertman’s assumption (ii).
Along the centre-line of the ice shelf Weertman’s assumptions (i) hold closely. It can be seen, in section 3.5, that the pressure gradient down the ice shelf, ∂σ xx /∂x, is several orders smaller than the stress gradient with depth, ∂σ zz /∂z, and hence assumption (i) (a) holds. Due to symmetry, assumption (i) (b) holds along the centre-line of the ice shelf. Hence Weertman’s equation (1) holds here.
Averaging equation (1) vertically through the ice shelf we obtain
Now, considering B and ρ to be constant along the ice shelf, we may differentiate this equation with respect to x to obtain (dropping the bars)
On the other hand if equation (4) holds we have

Now equation (4) will hold approximately if the velocity gradient from the centre to the edge ∂V/∂y is much greater than the other velocity gradients, in particular ∂V/∂x. Now except near the centre this is indeed so—and since the velocity at the centre is determined primarily by higher shear away from the centre of the ice shelf, equation (4) should hold until the longitudinal creep rate becomes so large as to be comparable with the velocity gradient across the ice shelf.
Hence for the first approximation we make the assumption:
(iv) the longitudinal pressure gradient is constant across the ice shelf, i.e. the longitudinal velocity gradient is small compared to the transverse gradient so that equation (4) holds,
i.e. we assume

which then gives
This equation relates the velocity V and velocity gradient K to the boundary dimensions of the ice shelf H, a, x, and the flow parameters n, B, of the ice shelf.
We notice that, unlike the unconstrained ice-shelf model of Weertman, the creep rate here could be positive or negative depending on the relative size of the terms in V and dH/dx, and the distance from the front. This follows from the integration of equation (7) with respect to x.
The problem now is to determine from the measured velocity distribution and boundary dimensions of the Amery Ice Shelf the most appropriate values of n and B. We first consider three special cases.
For an ice-shelf region where the slope is large and the creep rate small (as at the southern end of the Amery Ice Shelf) it is expected that the second term on the right of equation (7) would predominate giving us
On the other hand for a flat ice shelf where the creep rate is high (as towards the front of the Amery Ice Shelf) we obtain

i.e.
where
Finally for the particular case n = 1 we obtain

or
We can see from equation (8) above that since dH/dx decreases towards the front of the ice shelf, and a only increases slightly, this equation could not explain the rapid increase observed in the velocity gradient.
Next we consider the effect of the varying creep rate along the ice shelf. Solutions of equation (9) exist in the form
where λ = μ n/(n+1) and V 0 is the velocity at the front of the ice shelf, where x = 0 say, with x increasing inland from the front. This solution implies that both the velocity and the velocity gradient (at the centre of the ice shelf) decrease exponentially going inland from the ice front—the rate of decrease depending on the parameter n of the flow Iaw and the ice-shelf width. However, this solution also implies V→0 as dV/dx→0, and may well apply to some flat ice shelves. For the Amery Ice Shelf, on the other hand, as dV/dx→0 the velocity approaches the value V 1 ≈ 370.m. yr.−1, and at the same time the surface slope increases by a factor of about four. This suggests that near the back of the ice shelf the pressure gradient due to the surface slope becomes the dominant factor.
For the case of constant viscosity (n = 1) we see that the various pressure gradients are simply superimposable and may be considered independently. The appropriate solution of equation (11) is
Since none of the special solutions are directly applicable to the Amery Ice Shelf the following approximate solution of the general equation (7) will be applied.
Let the pressure gradient due to the thickness gradient be dp I/dx and let V I be the velocity it would give rise to alone for equilirium. Let V C be the velocity due to the effect of the change in creep rate, so that the total velocity is V = V I+V C. We now have

If we write V C = βV I, we have

Equation (9) now becomes
where

Solutions then exist for V
C of the form (12) with λ′ = (μ′)
n/(n+1) provided λ′ does not vary significantly with x. Values of  say, have been plotted against β for various values of n in Figure 9. Except where β is small, b
n
(β) varies slowly with β and hence we may expect the approximation to be close towards the front of the ice shelf.
The function b n (β) plotted against β for different values of n. β ir the ratio of the velocity due to creep gradient to that due to thickness gradient. For large β, b n (β) is only a slowly changing function, and more slowly the lower the value of n

3.2. Value of parameter n
We write the solution of equation (9′) in the form
and (V 1+V 0) is the velocity at the ice front, where x = 0, x increasing inland. The function ϕ(n) has been plotted in Figure 10 for different values of n and β.
The values of

plotted against β for different values of n. The values of ϕ calculated from the ice-shelf velocity profile assuming different values of n and β, are shown by the dotted line. The correspondence between these curves suggest the best estimate of n for the ice shelf is about 2.0

By differentiating (14) we find for the velocity gradient
This reduces towards the front of the Amery Ice Shelf to

or

This relation implies that the ratio of the velocity gradient to the velocity due to creep depends on the width a and the flow parameter n.
The first problem is to estimate V C, i.e. to find the proportion of the ice-shelf velocity due separately to the thickness gradient and the creep gradient.
We assume from (4) that
If we also assume that at g3, where the strain-rate is small, the velocity is entirely due to the thickness gradient, then we can estimate the corresponding velocity at g1 taking into account the change in the values of a and dH/dx from

From equations (18) and (19) using the following values:
we obtain values of ϕ for different values of n. These are plotted in Figure 10 and suggest that the most appropriate value of n is about 2. However, in view of the large percentage error in the small slope measured at g1, the value of n can hardly be specified more precisely than as lying in a range from 1.5 to 2.5.
In Table IV are listed the values of n found by various workers with the associated stress ranges. Although there is much variation due to such factors as ice type and crystal orientation the general conclusion seems to be that for low shear stress (0.1–0.5 bar) the value of n ≈ 1 and that this value increases with stress, rapidly in the region of 0.75 bar, to values of 2, 3, 4,…, as the shear stress increases from 1 to 10 bars.
Values of The Exponent in the Flow Law of Ice

Reference RobinRobin (1958) showed that the maximum stress difference (σ z −σ x ) in the Maudheim ice shelf was about 1.8 bars. This implies a maximum shear stress of 0.9 bar. We shall now consider the shear stress in the Amery Ice Shelf.
3.3. The shear stress in the ice shelf
Near the centre of the ice shelf we can neglect the effect of shear across the ice shelf and so will consider first the shear stress associated with “Weertman creep”. From Reference WeertmanWeertman (1957) the shear stress τ is related to the x and z principal stresses by
Since we have considered the creep rate as constant with depth, the relevant shear stress will be the mean value through the ice-shelf thickness. Denoting the mean of a variable over the depth by a bar over that variable, we have near the front of the ice shelf, following Weertman,

therefore
Using ρ i = 0.85 g. cm.−3, ρ w = 1.03 g.cm.-3, g = 980 cm. sec.-2, H = 2.0×104 cm., we obtain

As the creep rate decreases going inland from the ice front, σ
xx
→ σ
xx
and hence  . Thus the shear stress in the centre of the ice shelf is less than
 bar over the whole length of the ice shelf.
The maximum shear stress across the ice shelf occurs at the edge, 80 km. from the centre at g1. The value of this shear stress is given by τ = a(dp/dx).
Now dp/dx is determined below as 2.5 bar/100 km., hence we obtain τ = 2 bars. Since the variation in shear stress across the ice shelf is linear, the average shear stress across the ice shelf in the region of g1 is 1 bar. These values of shear stress are hence compatible with the effective range of the flow parameter n calculated above.
3.4. Value of parameter B
From equation (7) we have

Using n = 2, and substituting the values measured at g1 as follows: a = 80 km. (8×106 cm.), V = 800 m. yr.−1 (2.5×10⁻³ cm. sec.−1), K = 6×10⁻³ yr.−1 (1.9×10⁻¹⁰ sec.−1), dK/dx = 2×10⁻¹⁷ cm.−1 sec.−1, ∂H/dx = 5.7×0.4×10−4, ρ = 0.85 g.cm.−3, we obtain an estimate for B, viz.

In order to compare this value of the flow parameter B with the results of other determinations, e.g. the values obtained by Reference GlenGlen (1955), it is first necessary to convert to the same units, using the same value of n. Following Reference ShumskiyShumskiy (1961)
We set n
2 = 3, τ = 106 dyn. cm.−2. For the Amery Ice Shelf at g1 we use B
1 = 0.91 × 10¹¹ dyn. 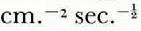 and n
1 = 2 to obtain

The values from Reference GlenGlen (1955, p. 528) have been converted to the corresponding shear values by the method of Reference NyeNye (1953, p. 486) and then to c.g.s. units with n = 3. These values of B have then been plotted against temperature in Figure 11, together with similar values obtained by extrapolation of the curves of Reference SteinemannSteinemann (1958, p. 189) to a shear stress of I bar. The value of 2.0×10⁹ for the Amery Ice Shelf has been plotted against −16°C., which is the mean temperature calculated for the Amery Ice Shelf at g1 assuming that the temperature–depth profile has the same shape as that of the Ross Ice Shelf at “Little America”. The agreement with the laboratory values is quite close, considering a possible error of ±20 per cent, due largely to the possible error in the measured ice-shelf slope.
The value of the flow parameter B from the flow law for ice 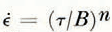 calculated for different temperatures from the laboratory measurements of ice creep by Glen (•) and Steinemann (Ο), and converted to shear values in units of
 . The value calculated from the velocity profile of the Amery Ice Shelf at g1 has been plotted against a temperature of −16°C. —the calculated mean temperature of the ice shelf at g1

3.5. Velocity profile across the ice shelf
We first require the pressure gradient, at g1 say. This can be determined from

which, using the same values at g1 as those in section 3.4, yields dp/dx = 0.25 dyn. cm.-3 = = 2.5 bar/100 km.
Having determined the flow parameters n, B, and the pressure gradient at g1 we can now calculate an ideal velocity profile across the ice shelf from
where Vm
is the maximum velocity at the centre, V is the velocity at distance y from the centre, dp/dx = 0.25 dyn. cm.-3,  and n = 2. This gives the following values:

Putting V m = 800 m. yr.−1.

This velocity profile is illustrated in Figure 12 together with profiles resulting from taking n equal to 1 and 3.
The calculated ideal velocity profile across the Amery Ice Shelf at g1 using the calculated flow parameters n and B is shown together with the correspondingrofiles that would apply for n = 1 and n = 3. The transverse shear strain is seen to be small at the centre of the ice shelf increases towards the margins. Large shear crevasses were observed on the Amery Ice Shelf between 30 km. from the centre and the margin

An interesting result which follows from this profile is that there is very little horizontal shear in the centre of the ice shelf but considerable shear between about 30 km. from the centre and the edge. This is in agreement with the location of the observed shear crevasses on the ice shelf. The curve is also in good agreement with the transverse velocity gradient measured by Landon-Smith from a strain grid at e (60 km. from the centre) of 16.7 m./km. yr.
4. Energy Considerations
For a rapidly deforming ice shelf the following questions arise: (i) does the potential energy released have any appreciable effect on the thermal regime of the ice shelf: and (ii) is the increase of kinetic energy a significant factor in the energy budget. These questions are answered by the following considerations.
4.1. Potential energy
Consider an iceberg that spreads out uniformly without change of volume. The change in potential energy associated with a decrease ΔH in thickness arises solely from the displacement of the centres of gravity of the displaced water and the ice, and per unit area is given by:
where g is acceleration due to gravity, H is ice thickness, ρ i is the mean density of the ice, and ρ w is the mean density of the water.
We now express ΔH in terms of horizontal creep rates  and
 , per unit time

For the Amery Ice Shelf  was only a small fraction of
 , hence we write

Then

where v = (1−ρ i/ρ w) We now integrate ΔE p over the ice shelf and write V for the mean forward velocity across the ice shelf at distance x from the front and h , 2 a for the mean thickness and width. Then
or
Putting H = 2 × 104 cm. and a × 106 cm., we obtain

The ice-shelf area is 4.5×1014 cm.2. This indicates that the average heating produced by the deformation is small, less than 1 cal. cm.−2 yr.−1 average and less than 10 cal. cm.−2 yr.−1 maximum. Hence the potential energy loss due to creep will have negligible effect on the vertical temperature profile through the ice shelf.
4.2. Kinetic energy
The increase in kinetic energy per year may be obtained from
Which gives
After substituting the velocities and the mean values of the other parameters for the ice shelf it is found that the change in kinetic energy is many orders smaller than the change in potential energy. Hence in energy and heat budget calculations both the internal heat produced, and the gain in kinetic energy, may be neglected.
5. Ice-shelf Regime
5.1. Variation of “thinning rates” along ice shelf
Relations for the mass regime of ice-shelves have been discussed by Crary (Reference Crary1961, Reference Crary1964) and Reference Shumskiy and ZotikovShumskiy and Zotikov (1963, Reference Shumskiy and Zotikov1965). First these authors have used different approaches in calculating the effect and densification and compaction on the change in ice-shelf thickness. The following procedure will be adopted here.
If Sorge’s law is assumed to apply (i.e. the density profile from the surface downwards retains the same form with time) then it follows from an integration of Reference BaderBader’s (1954) expression
for the settling rate S of snow at depth z with density ρ, that the total amount of compaction is equal to the difference in thickness between the snow accumulation at surface density and the corresponding thickness of snow compressed to ice, thus the total compaction is
where A s is the mass of snow accumulation per unit area, ρ s is the surface snow density, and ρ i is the ice density at the base of the ice shelf. This means that the effect of densification can be neglected if the thickness due to the accumulating snow is calculated using A = A s/ρ i instead of A s/ρ s.
Secondly, if the ice-shelf thickness is changing in time, then it is not valid to calculate melt rate from the equation of balance. We have for the rate of change in the ice-shelf thickness H in a given position with time
where A is the surface accumulation rate in centimetres of ice per year, M is the bottom melt rate in centimetres of ice per year,  H is the change in thickness due to spreading, V the ice-shelf velocity at the position, and ∂H/∂x the longitudinal rate of change of ice-shelf thickness at the position. The corresponding mass change would be given by
Because of the small slope of the Amery Ice Shelf the variation of the density profile along the ice shelf is neglected. Actually ∂ρ /∂x does vary slightly, not because ∂ρ/∂x is appreciable but because of the thickness gradient and the dense ice being at the base of the ice shelf.
In equation (30) above the two unknown values for the Amery Ice Shelf are ∂H/∂t and M. Reference CraryCrary (1961) obtained estimates of bottom melting for the Ross Ice Shelf from the vertical temperature profile, but as these data are not available for the Amery Ice Shelf the values of

are evaluated and listed in Table V for the three positions along the Amery Ice Shelf centreline, together with the values at the fronts of the Ross Ice Shelf at “Little America” (Reference CraryCrary, 1961) and the Maudheim ice shelf (Reference SwithinbankSwithinbank, 1957[a], Reference Swithinbank1957[b], Reference Swithinbank1958, Reference Swithinbank[1962]; Reference RobinRobin 1958).
From the results of Table V it can be seen that the Hatter, more rapidly spreading Amery Ice Shelf would need to accrue ice at its base in the region of g1 at the rate of 90 cm. ice yr.−1 to remain in balance. In view of the melt-rate and current flow calculations of Reference ShumskiyShumskiy and Zotikov (1963) this would seem unlikely and instead melting may even be taking place. Hence we conclude that the ice shelf may be thinning at about 1 m./yr. at this position. This thinning rate would decrease inland so that beyond a certain point the ice shelf is probably becoming thicker. Hence we conclude that the ice shelf is in a process of continual change of form.
Ice-Shelf Thinning and Melt Rates

5.2. Advance of ice-shelf front
The Amery Ice Shelf front has not been in a state of continual balance with small icebergs breaking off each year to compensate for the forward motion. On the contrary it may be seen from Figure 13 that the front has been gradually advancing, and spreading out, over a period of about 40–50 yr., with increasing speed and little change in form due to iceberg formation until a major break out of about a fifth of the ice-shelf area occurred in 1963. After this it is expected that such a process may recommence.
The position of the Amery Ice Shelf front plotted by different expeditions is shown as follows:
-
1936 Lars Christensen Expedition
-
1955 A.N.A.R.E.
-
1957 Soviet Antarctic Expedition
-
1963 A.N.A.R.E.
-
1965 A.N.A.R.E.
The errors in positioning are estimated at ±3 km. but in spite of this the general forward movement and spreading out is significant. A position on the front was astrofixed by the Soviet Expedition in 1957 and a repeat of this by A.N.A.R.E. in 1963 gave a velocity estimate at the front of 1,500±300 m. yr.−1. The large break out of the ice shelf occurred later in 1963

This pattern of change supports the idea of changing form deduced from the thinning rates above. Over a period of 40 yr. thinning at the rate of 1 m. yr.−1 would amount to 40 m. which would give a resulting change in surface elevation of about 7 m. The rate of change of thickness, however, would not be constant with time because it would cause an increased longitudinal slope which could then give rise to decreased thinning rates.
For the flat central section of the Ross Ice Shelf, Crary and others (1962, p. 102) showed that the condition of balance and melting implied negative strain-rates of the order 10−3 yr.−1 in that region. Reference Zumberge and MellorZumberge (1964) assumed a steady-state profile to calculate the amount of melting or freezing at the base. He found the magnitude of bottom melting would have to decrease exponentially with distance from the seaward edge of the shelf, to a zone between 40 and 100 km. southward, beyond which increasing bottom freezing would be required for balance. An alternative explanation for both Crary’s and Zumberge’s results could be that the ice shelf is at present thinning, and this possibility should be kept in mind in considering the regime of the Ross Ice Shelf in the same way as has been done here for the Amery Ice Shelf.
The next re-survey of the Amery Ice Shelf by the A.N.A.R.E. is planned for 1967. In addition to new measurements to be carried out, re-surveys of the original 1963 markers should greatly reduce the errors in the present estimates of velocity, velocity gradient and elevation profile. This could then provide a basis for determining the change of the ice-shelf regime with time to test the hypothesis of steady-state conditions.
Acknowledgements
The author gratefully acknowledges the help and support by all the members of the A.N.A.R.E. who have taken part in the ice-shelf project. Mr. I. H. Landon-Smith provided the results of his 1962 work and made many valuable suggestions for the later work. Mr. E. R. Wishart conducted the extensive 1963 survey that provided the basis for the 1964 remeasurements. Mr. G. McKinnon provided the map of Figure 13. Dr. U. Radok of the Meteorology Department, University of Melbourne, advised on and co-ordinated the programmes, and critically reviewed the manuscript. The paper is published with the permission of the Director of the Australian Antarctic Division.



