Introduction
The assurance of food safety has drawn an increasing worldwide attention for public health protection [Reference Jia, Yan, Lai, Xu, Liu and Xiang1]. Triphenylmethane dyes, such as crystal violet (CV) and malachite green (MG), have been widely used as antifungal and antiparasitic agents in fisheries and aquaculture [Reference Bergwerff and Scherpenisse2, Reference Arroyo, Ortiz, Sarabia and Palacios3, Reference Wang, Liao, Huang and Yuan4]. CV and MG drug residues in fish and other seafood products are not authorized in many countries due to their mutagenic and carcinogenic properties [Reference Shalaby, Emam and Anwar5]. Although the application of them has been banned in aquaculture, some are probably still illegally used as veterinary drugs because of their low cost and efficacy in preventing and treating certain fish infections [Reference Stolker, Zuidema and Nielen6]. Up to now, several analytical techniques, including High Performance Liquid Chromatography (HPLC) [Reference Zhang, Yu, Pei, Lai, Rasco and Huang7], Liquid chromatography-mass spectrometry (LC-MS) [Reference Dowling, Mulder, Duffy, Regan and Smyth8], enzyme-linked immuno sorbent assay (ELISA) [Reference Singh, Koerner, Gelinas, Abbott, Brady, Huet, Charlier, Delahaut and Godefroy9], electrochemiluminescence [Reference Guo, Gai, Hao, Duan and Wang10], and fluorescence spectroscopy [Reference Mitroska, Posyniak, Zmudzki and Chromatogr11], are mainly employed for the quantitative determination of MG and CV. The recommended detection methods are highly sensitive and well established; however, most of them are time consuming and labor intensive [Reference Wang, Liao, Huang and Yuan4]. In this sense, it is urgent to explore a simple, rapid, and accurate method to monitor these drug residues in seafood and aquaculture water samples.
Recently, surface-enhanced Raman scattering (SERS) has emerged as one of the powerful and versatile novel analytical technique for chemical, biological, and other detections due to its specificity, ultrahigh sensitivity, and fingerprint effects [Reference Xia, Zeng, McDearmon, Zheng, Li and Xia12, Reference Liu, Tadepalli, Tian and Singamaneni13, Reference Chen, Huang, Kannan, Zhang, Lin, Zhang, Chen and Guo14]. And it has been successfully used to detect trace and single molecule of analytes [Reference Sharma, Frontiera, Henry, Ringe and Van Duyne15, Reference Zhang, Zheng, Liu, Lu, Dai, Lei and MacFarlane16] because of its enormous SERS enhancement capability (up to 1010–1014 orders) around the metal nanostructure surface. For instance, trace MG residues were detected in fish muscles using AuNPs as SERS-active substrates, and a low detection limit of 10 ng/g for MG was determined [Reference Li, Huang, Lai, Rasco and Fan17]. Combining SERS method with plasmonic AuNR substrates, it achieved rapid detection of 1 ppb for MG and CV in fish samples [Reference Chen, Nguyen, Gu and Lin18]. Although SERS technique succeeds in rapid and sensitive detection of trace MG and CV, they are usually operated in laboratory-based large instruments, which hampers their practical applications in field analysis. Meanwhile, the advent of portable Raman instruments fully makes it possible to construct of a portable analytical platform for on-site trace detection of analytes. For example, Pînzaru and co-authors demonstrated a fast, cheap, and highly sensitive SERS approach to detect thiabendazole in citrus fruits (78 mg/kg) by means of a portable mini-Raman spectrometer [Reference Müller, David, Chis and Pînzaru19]. Meng’s group reported Ag-grafted sponge substrate for highly sensitive SERS detection of adenine (limit of detection (LOD) of 4.23 nM) and thiram (LOD of 1.88 nM) in the solution by a handheld portable Raman spectrometer [Reference Zhou, Meng, Zhu, Chen, Zhou, Ke and Huo20]. For portable detection applications, solid SERS substrate is highly needed for detection, which requires good portability. Recently, the integration of noble metal nanostructure with graphene oxide (GO) nanosheet has been extensively investigated for improved overall SERS performance because of their synergistic effects [Reference Yu, Cai, Zhang, Li, Pan, Luo, Wang and Hou21, Reference Chi, Liu, Wang and He22, Reference Jiang, Wang, Tang, Zhou, Gu and Tang23]. Thus, many solid SERS substrates composing of GO and plasmonic Au or Ag hybrids were prepared. For example, Jiang and co-workers fabricated an efficient natural SERS platform based on GO–AgNPs–Mytilus coruscus [Reference Lu, Liu, Wang, Zhang, Li, Huo, Li, Xu, Man and Jiang24]. Man and co-workers fabricated a GO/AgNPs/pyramidal PMMA 3D flexible substrate, realizing in situ detection of solution and curve surface [Reference Zhao, Yu, Zhang, Chen, Xu, Li, Li, Zhang, Liu and Man25]. Despite the significant progress, it is still a challenge to fabricate solid SERS substrate simultaneously possessing good reproducibility and high sensitivity in a simple way.
In this study, we integrate the GO nanosheet with plasmonic AgNPs to form a solid GO/AgNPs on Cu substrate. This substrate exhibits several advantages: (i) highly uniform and rough surface of Ag nanoparticle (NP) offers more hot spots. (ii) The GO nanosheets protect AgNPs from oxidation and make more molecules absorb on the hot spots effectively, what’s more, the GO makes molecules distribute more uniformly, which leads to higher reproducibility. (iii) GO further improves the SERS activity of the GO/AgNPs/Cu hybrids by the chemical mechanism. Thus, high sensitivity of 10−9 M and good uniformity with relative standard deviation (RSD) of 8.5% were achieved on the optimized GO/AgNPs/Cu substrate. Without sample pre-treatment, MG and CV residues were successfully detected by swabbing on fish scale with solid substrate. In addition, the limit of detection of MG and CV on fish scale was as low as 10−8 M. Quantitative detection was realized in a broad linear range from 10−3 to 10−8 M. More importantly, the GO/AgNPs/Cu SERS substrate can be safely stored for 40 days with only 18% SERS activity lost, demonstrating its good long-term stability.
Results and discussion
Characterization of the GO coated popcorn-like AgNPs/Cu substrate
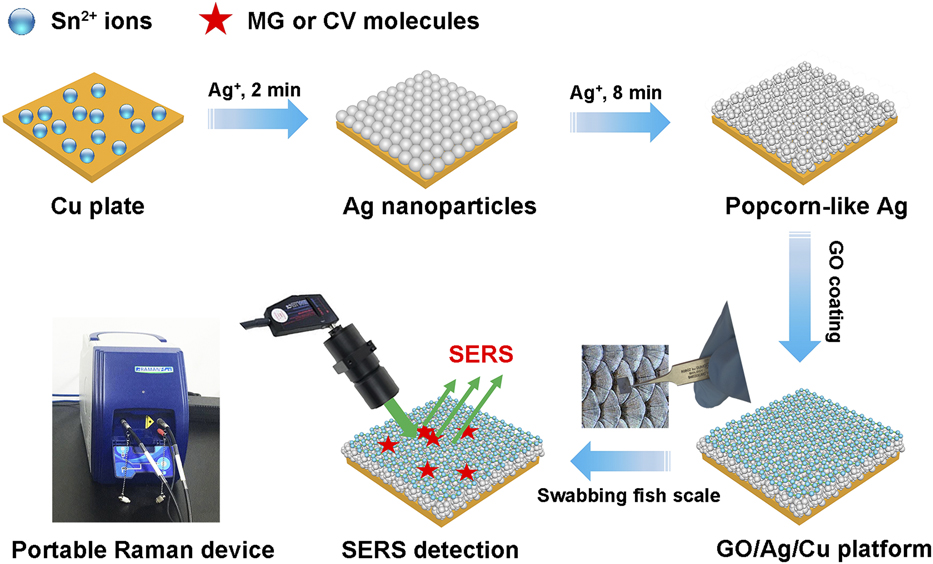
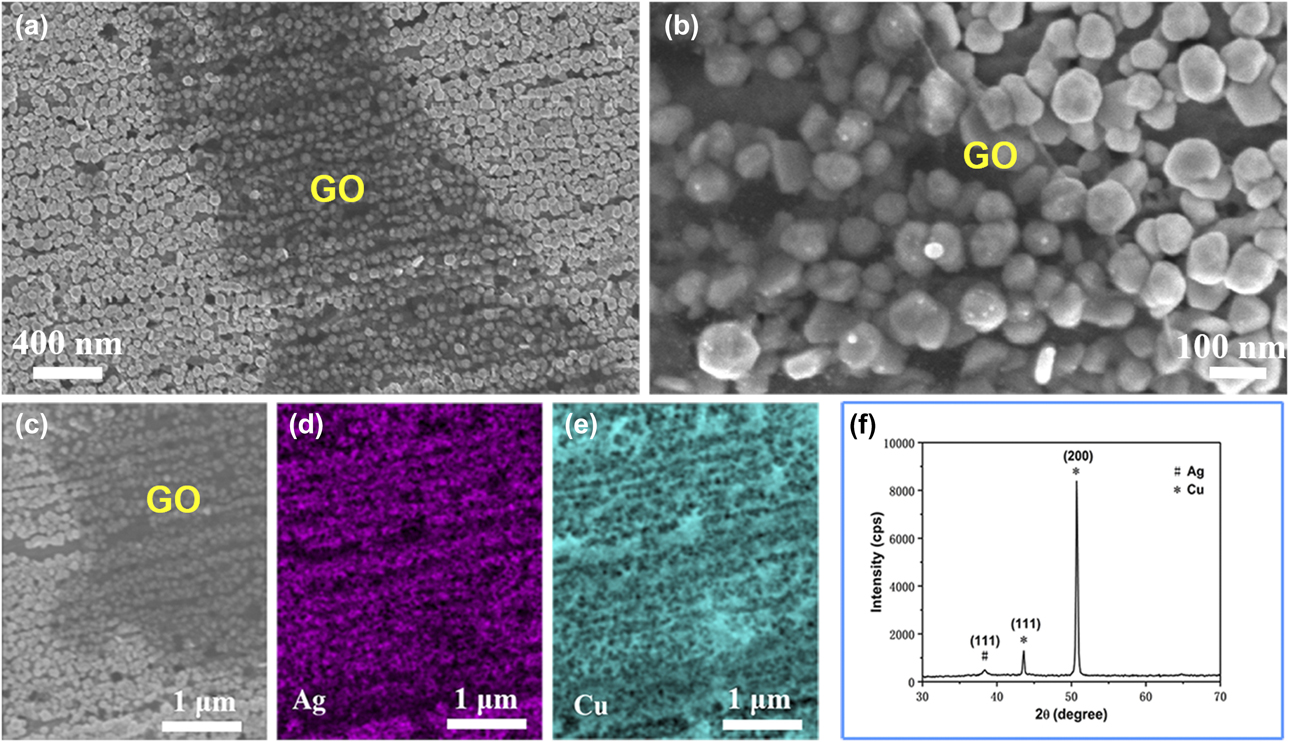
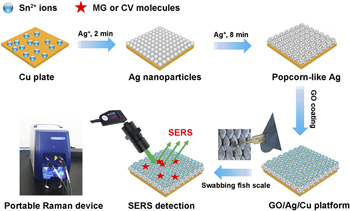
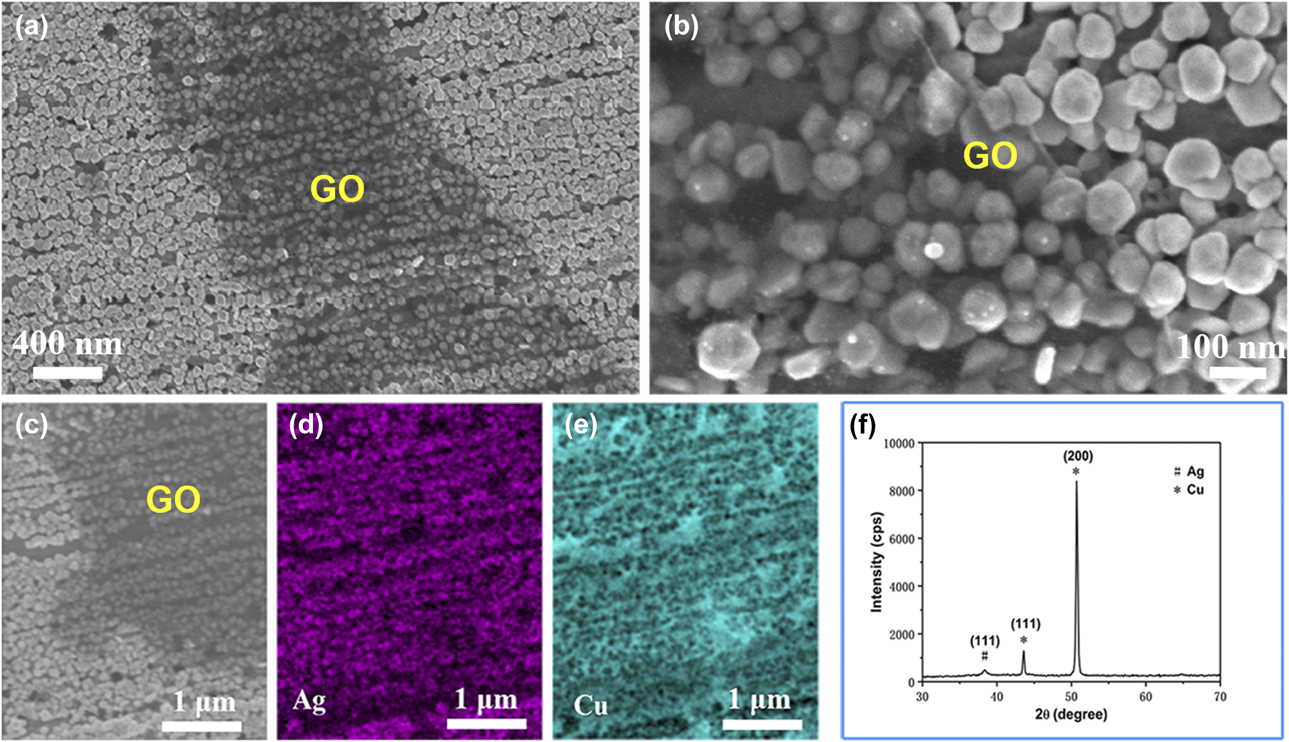
The GO coated popcorn-like AgNPs/Cu substrates were rationally designed and synthesized by a simple and efficient strategy. Figure 1 shows the fabrication schematic outline of the GO/AgNPs/Cu hybrid structure. Briefly, Sn2+ ions were first dispersed and absorbed on the clean Cu plate surface. AgNP seeds were subsequently generated by reduction of Ag+ ions with Sn2+ on the Cu plate at initial stage of 1–2 min, followed by overgrowth into popcorn-like AgNPs. The use of Sn2+ majorly contributes to the formation of uniform AgNPs on Cu surface. For comparison, we synthesized Ag/Cu hybrid without using Sn2+. As shown in Fig. S1, dendritic Ag nanostructures were formed by the displacement reaction between Cu and Ag. Hence, we believe that the formation of this popcorn-like AgNPs is due to the loading of Sn2+ ions in the reaction. After synthesizing the AgNPs/Cu substrate, GO layer was spin-coated on the popcorn-like Ag/Cu hybrids at 2000 rpm for 1 min, and the process was repeated for several times to optimum SERS performance. Typical scanning electron microscopic (SEM) images of GO/AgNPs/Cu hybrid structure are shown in Fig. 2. It shows that well-dispersed AgNPs with uniform diameter of about 68 nm were rapidly synthesized and deposited on Cu plate [Fig. 2(a)]. It is noted that the dark contrast in Figs. 2(a)–2(c) is the evidence of the GO coating layers. GO nanoflakes with an average size of about 2 μm were evenly coated on the surface of AgNPs/Cu. Energy-dispersive spectroscopy (EDS) characterization was conducted to analyze the composition of the GO/AgNPs/Cu hybrids, as shown in Figs. 2(d) and 2(e), which indicates that Ag and Cu elements coexisted in the hybrids. Besides, we did not find the presence of Sn element in the test, since Sn2+ ions had been oxidized to Sn4+ ions in the reaction and were washed away with the solution in the subsequent cleaning. Moreover, the X-ray diffractometer (XRD) result is also provided in Fig. 2(f) to determine the crystal structures of the AgNPs/Cu hybrids. One diffraction peak is attributed to the (111) plane of Ag, and the other two can be attributed to (111) and (200) planes of copper, further confirming the formation of AgNPs on Cu plate. The above SEM, EDS, and XRD analyses revealed that the GO/AgNPs/Cu solid substrate was successfully fabricated in such a simple and efficient way.
Schematic illustration of the synthesis of GO/popcorn-like AgNPs/Cu as solid SERS substrate and its detection using a portable Raman device.

SEM images of GO/AgNPs on Cu plate (a) low magnification (b) high magnification, (c) selected area of GO/AgNPs/Cu and (d and e) corresponding EDS elemental mapping images showing the Ag and Cu elements. The dark contrast in a, b and c is the evidence of the GO layer. (f) XRD pattern of the GO/AgNPs on Cu plate.
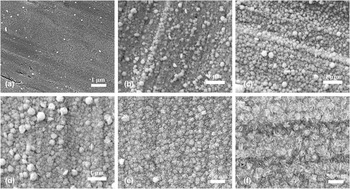
More evidences have showed that both the morphologies and sizes of metal nanostructures influence the localized surface plasmon resonance and the resultant SERS performances [Reference Hutter and Fendler26, Reference Shuford, Lee, Odom and Schatz27, Reference Zhang, Meng, Wang, Tang, Chen, Rong, Liu and Wu28]. Thus, we systematically investigated the morphology evolution process of AgNPs varying with the reaction time. Typical SEM images of the AgNPs/Cu hybrids fabricated at reaction times from 2 to 20 min are shown in Fig. 3. It can be seen that fine Ag nanocrystal seeds were created at the Cu surface at the early stage of 1 min (Fig. S2) and 2 min [Fig. 3(a)]. As the reaction time increased to 4 min, the Ag nanocrystal seeds were further grown into densely spherical AgNPs [Fig. 3(b)]. When the reaction time was prolonged to 6 min, it grew into rough spherical AgNPs with tiny and fine NPs anchored on the surface [Fig. 3(c)]. Interestingly, when it reacted for 8 min, much rougher popcorn-like AgNPs were formed and large quantity of “hot spots” were created in particle itself and between the nearby particles [Fig. 3(d)]. Increasing time to 10 min, nanoflakes began to appear on the surface of popcorn-like AgNPs [Fig. 3(e)]. Whereas further increasing time to 20 min, it completely transformed into a flat nanoflakes arrangement [Fig. 3(f)]. The results indicated that popcorn-like AgNPs could be rapidly synthesized within 8 min, and the morphologies of the AgNPs could be finely tuned simply by changing reaction times.
SEM images of Ag nanostructures on Cu plate prepared at reaction times of (a) 2 min, (b) 4 min, (c) 6 min, (d) 8 min, (e) 10 min, and (f) 20 min.

Optimizing the SERS sensitivity of the GO/AgNPs/Cu substrate
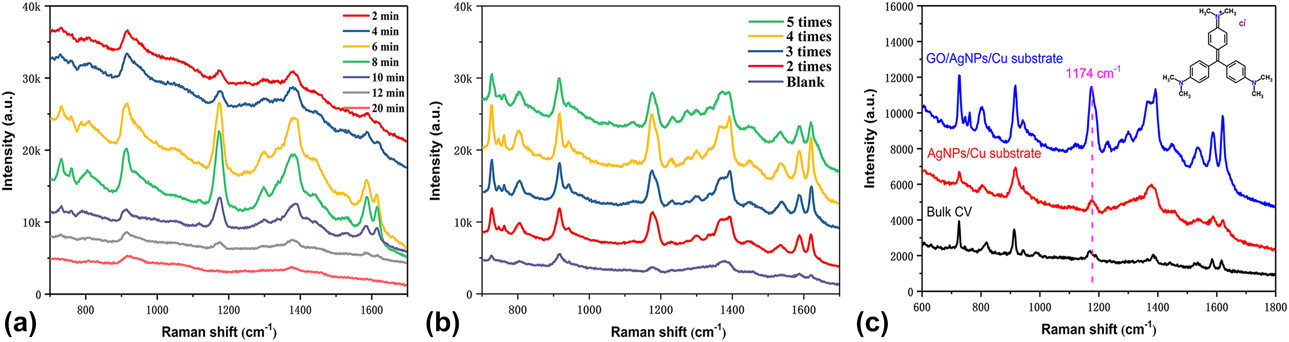
Here, the SERS activity of AgNPs with different morphologies on Cu plates was examined by using CV as probe molecules, which has been employed for SERS measurements because of its characteristic Raman signals [Reference Zrimsek, Wong and Van Duyne29, Reference Bibikova, Haas, López-Lorente, Popov, Kinnunen, Meglinski and Mizaikoff30]. Figure 4(a) shows SERS spectra of CV on different AgNPs/Cu hybrids resulted from the reaction time of 2, 4, 6, 8, 10, 12, and 20 min. The bands at 914, 1174, and 1388 cm−1 can be assigned to the ring skeletal vibrations, C–H in-plane bending vibrations, and N-phenyl stretching of CV, respectively [Reference Zhang, Liu and Wang31]. The bands at 1535, 1584, and 1617 cm−1 can be attributed to ring C–C stretching [Reference Sanci and Volkan32]. Specifically, we selected 1174 cm−1 band to investigate the relationship between SERS intensity and reaction times (Fig. S3). From Figs. 4(a) and S3, it was evident that SERS intensity of CV was very weak at the initial stage. The strongest SERS intensity was observed at reaction time of 8 min, after which it decreased with prolonging time. The above phenomena can be explained in the following observed facts. At the beginning, the produced AgNPs are sparse small-sized NPs, which cannot provide substantial hot spots to enhance the SERS signal. As the reaction time increases, large amount of AgNPs are produced and the AgNPs surface become rougher, resulting in enhanced SERS signal. Since nanoscale roughness can create high local fields, resulting giant Raman enhancements in hot spots created between two NPs [Reference Yang, Matsubara, Xiong, Hayakawa and Nogami33]. As expected, the popcorn-like AgNPs exhibit the highest SERS enhancement. However, because of the reduced hot spot on the AgNPs with nanoflakes surface structure, it shows inferior SERS performance. These observations indicated that the morphologies of the AgNPs indeed played an important role in amplifying SERS signals of target molecules. Hence, we choose the popcorn-like Ag/Cu substrate as the object for further research.
(a) Raman spectra of CV (10−5 M) absorbed on AgNPs/Cu substrate fabricated at various reaction times. (b) Relationship between GO spin-coating times and SERS performance of GO/AgNPs/Cu substrate. (c) SERS spectra of CV (10−7 M) and Raman spectra of CV solution (10−1 M) absorbed on AgNPs/Cu and GO/AgNPs/Cu substrates.

To further improve the overall SERS performance of the popcorn-like AgNPs, we coated AgNPs with GO nanosheets by a simple spin-coating method. Because GO has several obvious advantages when combining with metal nanostructures, such as protecting metal from oxidation [Reference Jung, Crowther, Kim, Kim and Brus34], absorbing variety of organic molecules [Reference Chi, Liu, Wang and He22], suppressing fluorescence, and enhancing chemical Raman signals [Reference Qu, Liu, Liu, Yang, Li and Li35]. Figure 4(b) shows the SERS spectra of GO/AgNPs/Cu substrate prepared at different spin-coating times. After coating of GO, the SERS performance of GO/AgNPs/Cu has been improved compared with that of AgNPs/Cu substrate. And the AgNPs/Cu substrates showed the highest SERS enhancement when coated for 4 times. However, the SERS performance decreases at coating times over 5, since thick GO coating will increase the distance of AgNPs and the target molecules, resulting in a reduction in SERS intensity. To quantitatively analyze the enhancement contributions from GO and AgNPs, the enhancement factors (EFs) of the optimum GO/AgNPs/Cu and AgNPs/Cu as SERS substrates were estimated by the following equation [Reference Cai, Ren, Li, She, Liu, Cai and Tian36]:
 $${\rm{EF}} = \left( {{{{I_{{\rm{SERS}}}}} / {{I_{{\rm{bulk}}}}}}} \right) \times \left( {{{{N_{{\rm{bulk}}}}} / {{N_{{\rm{SERS}}}}}}} \right)\quad ,$$
where I SERS and I bulk denote SERS and normal Raman intensities, while N SERS and N bulk represent the total number of molecules effectively excited by the laser beam. Based on Fig. 5, the EFs for GO/AgNPs/Cu and AgNPs/Cu are calculated to be 1.20 × 10⁶ and 1.56 × 10⁵, respectively. The detailed calculation of the SERS EF is shown in the supporting information. Owing to the successful modification of GO, GO/AgNPs/Cu substrate shows a 7.7-fold Raman signal stronger than that of AgNPs/Cu substrate. The enhancement can be attributed to the superior adsorbing ability of GO to CV molecules and their large chemical enhancement effects [Reference Kang, Chu, Zhao, Xu and Sun37, Reference Zhou, Li, Fan, Zhang and Zheng38]. The carbon atom of GO is hybrid sp 2, which provides many adsorption sites for probe molecules through π–π and electrostatic interactions. Figure 4(b) also indicates that a suitable thickness of GO has made an important contribution to the SERS enhancement. Although there is still no unified theory about the mechanism of SERS, we can boldly speculate that the mechanism of chemical enhancement in this GO/AgNPs/Cu substrate plays a non-negligible role. In addition, the Ag substrates modified with GO is capable of quenching the fluorescence from the labeled molecules, which improves the signal–to-noise ratio of the Raman spectrum [Reference Xie, Ling, Fang, Zhang and Liu39].
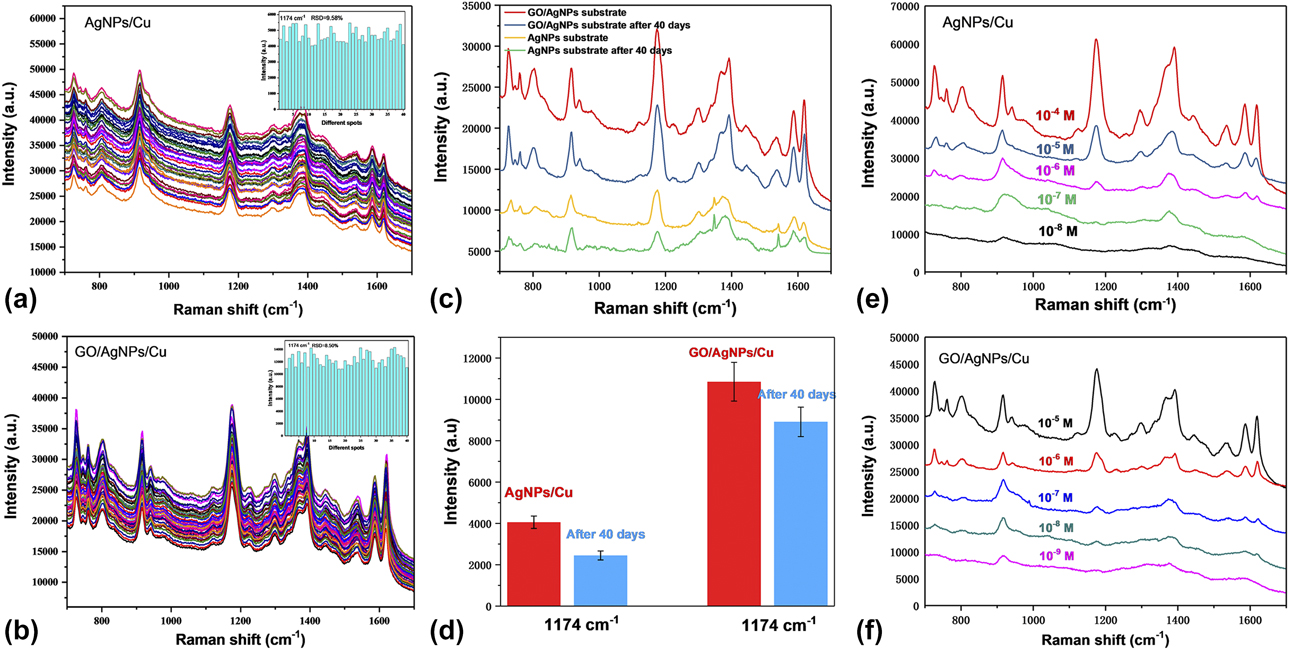
SERS spectra of CV (10−5 M) measured on (a) AgNPs/Cu and (b) GO/AgNPs/Cu substrates at 40 spots; the inset is the histogram of peak intensities at 1174 cm−1 for both substrates. (c) SERS spectra of CV molecules absorbed on AgNPs/Cu and GO/AgNPs/Cu substrates before and after exposing them to ambient conditions for 40 days, (d) Corresponding SERS intensity comparison at band of 1174 cm−1 shown in (c). SERS spectra of CV molecules on the (e) popcorn-like AgNPs/Cu and (f) GO coated popcorn-like AgNPs/Cu substrates with different concentrations.

Improved signal reproducibility, long-term stability, and sensitivity
To demonstrate how the reproducibility can be improved by coating GO, we measured the SERS signal of GO/AgNPs/Cu and AgNPs/Cu substrates. Figures 5(a) and 5(c) show SERS spectra of CV (10−5 M), which were randomly selected and measured at 40 points. The RSD values of the peak intensity at 1174 cm−1 were calculated to be 9.6% for AgNPs/Cu and 8.5% for GO/AgNPs/Cu. Though the bare AgNPs/Cu substrate can generate good reproducibility, the coating of GO layer produces improved signal reproducibility, which can be due to the formation of evenly GO coating on the AgNPs/Cu surface. And thereby the absorbed molecules can be uniformly anchored on the GO surface by their inherent adsorbing ability, resulting in improvement of the signal reproducibility.
Besides, we examined the effects of GO coating on the long-term stability of the AgNPs/Cu substrate. Figures 5(e) and 5(f) display the SERS spectra of CV absorbed on GO/AgNPs/Cu and AgNPs/Cu stored for 40 days. We observed that the Raman intensity of GO/AgNPs/Cu substrate decreased from 10,844 to 8901 cps (about 18% loss) at band of 1174 cm−1. However, for AgNPs/Cu substrate, it reduces from 4041 to 2433, cps which has around 40% signal intensity loss. The results indicate that GO coating can serve as a protective layer from oxidation and maintain the SERS activity of the AgNPs/Cu for a long time, which is consistent with the previous reported works [Reference Yu, Cai, Zhang, Li, Pan, Luo, Wang and Hou21, Reference Hu, Liu, Han, Chen, Zhang, Li, Lu, Luo and Jiang40].
Finally, we demonstrated how the detection sensitivity of AgNPs/Cu can be improved by GO coating. Figures 5(g) and 5(h) show the SERS spectra of different CV concentrations absorbed on the AgNPs/Cu and GO/AgNPs/Cu substrates. We found that GO/AgNPs/Cu substrate can detect even lower concentration of CV than AgNPs/Cu, and the LOD of 10−9 M (i.e., 0.41 ng/g) can be achieved, suggesting its enhanced sensitivity. The GO layer provides large surface area for effective adsorption of various target molecules, thereby increasing the sensitivity of the substrate. The satisfactory comprehensive performances of this GO/AgNPs/Cu substrate have potentials in portable and reliable SERS determination.
Practical applications in rapid trace detection by a portable Raman device
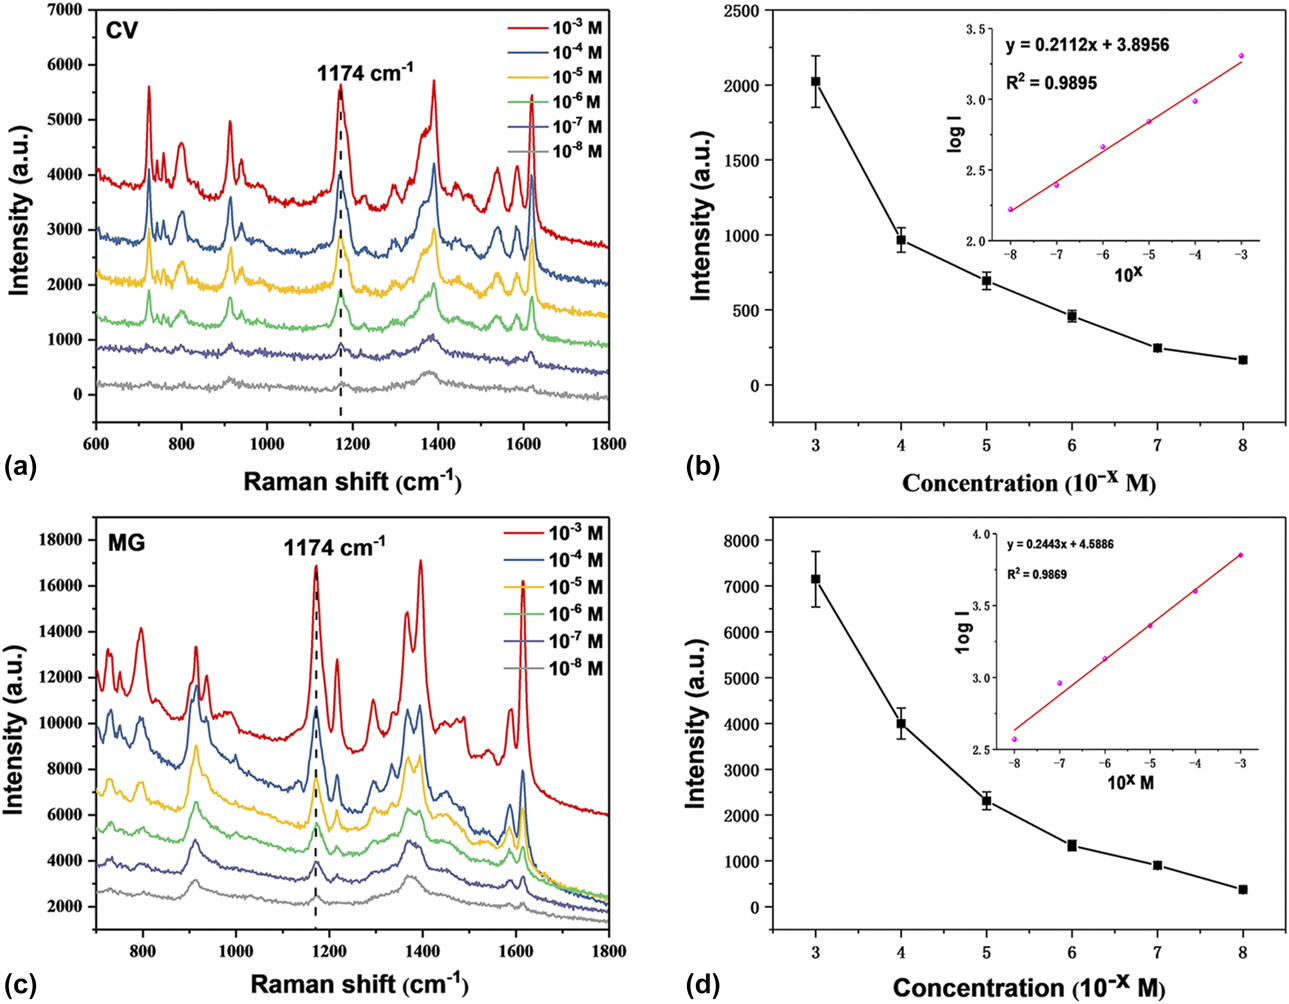
Illegally used drugs, such as CV and MG, are still found in some seafoods, and the residues of these drugs in fish and seafoods can cause serious health risks once they enter human bodies [Reference Kaplan, Olgun and Karaoglu41]. Thus, the rapid quantitative determination of these chemicals on fish is needed. Here, we carried out rapid and quantitative analysis of drug residues on fish scales, since triphenylmethane dyes, like CV and MG molecules, are readily adsorbed and accumulated on fish surface. We put fish in CV solutions with concentrations of 10−3 to 10−8 M and kept it alive for 3 days. Before SRES detection of drug residues, ethanol was dropped on the dried fish scale surface to dissociate target molecules from the fish. Then, we used solid SERS substrate to swab fish scales surface for three times. After each swabbing, the substrate was allowed for air drying at room temperature for five minutes. Consequently, CV residues would transfer to the substrate and Raman spectra were tested. The same procedure was applied to the MG detection in fish. From Figs. 6(a) and 6(c), we can observe that trace-level drug residues of CV (10−8 M, 4.1 ng/g) and MG (10−8 M, 3.6 ng/g) on fish scales can be detected by the GO/AgNPs/Cu substrate. Both have a reliable linear detection capacity with high R 2 values of 0.9895 for CV and 0.9869 for MG. In addition, they also showed a broad linear detection range from 10−3 to 10−8 M [Figs. 6(b) and 6(d), inset]. Such a low detection concentration on fish scales is comparable with those detections in fish muscles and fish samples (10 ng/g to 1 ng/g) by lab-based Raman spectrometer [Reference Li, Huang, Lai, Rasco and Fan17, Reference Chen, Nguyen, Gu and Lin18]. Hence, we believe this method can be applied to rapidly, quantitatively, and on-site detection of real-world samples. However, much work is needed to ideally detect these drug residues on real sample surface, and both the fabrication of flexible SERS substrate and coating methods of GO with precise control of thickness or layer numbers are underway.
Raman spectra of CV (a) and (c) MG on GO/AgNPs/Cu substrates swabbed on fish scale. (b) Raman intensity of CV at 11,744 cm−1 as a function of the concentration, and (d) Raman intensity of MG at 1174 cm−1 as a function of the concentration. The insets are the linear fitting curves of CV and MG.

Conclusions
A rapid and simple method for quantitative analysis of drug residues on fish scale by a portable Raman instrument was demonstrated. The solid SERS substrate based on GO/AgNPs/Cu hybrids was rationally designed and fabricated via an efficient procedure. The GO modified popcorn-like AgNPs/Cu hybrids exhibited higher sensitivity, better signals reproducibility and long-term stability than those of AgNPs/Cu counterparts. The lowest detectable concentration was determined to be 10−8 M for CV and MG residues on fish. And both shows a reliable linear detection capacity and a broad detection concentration ranges from 10−3 to 10−8 M. The proposed SERS method can provide a simple, effective, and quantitative analytical tool for drug residues in fish. Accompanied with a portable Raman device, this reliable and low-cost SERS substrates will make it possible to be widely used in field analysis.
Materials and methods
Materials
Copper (Cu) plate, silver nitrate (AgNO3), ethylene diamine tetraacetic acid (EDTA), stannous chloride (SnCl2), hydrochloric acid (HCl), CV, and MG were purchased from Shanghai Chemical Reagent Company (Shanghai, China). GO was commercially obtained from Ningguo New Materials Corporation (Xuancheng, China).
Synthesis of popcorn-like AgNPs on Cu plates
The Cu plates were first cut into pieces with a square sheet (2 × 2 cm) and washed with acetone. After that, the Cu plates were washed with ethanol and water in an ultrasonic bath for 2 min to remove any organic impurities. Then, the plates were immersed into a 1% (wt% in water) diluted sulfuric acid for 4 min and then thoroughly rinsed with deionized water. The cleaned Cu plates were subsequently immersed into an aqueous solution of SnCl2 (1.5 mM, 10 mL) for 10 min to adsorb stannous ions on Cu plates and washed by deionized water. Next, the above Cu plate was put into AgNO3 (3 mM, 5 mL) and EDTA (3 mM, 5 mL) mixtures. Last, different morphologies of AgNPs were gradually formed on Cu plate surface within 20 min.
Synthesis of the GO coated AgNPs/Cu substrates
GO dispersion with the concentration of 3 mg/L was spin-coated on the surface of AgNPs/Cu substrates at 2000 rpm for 1 min. The procedure was repeated for several times to obtain different coverage of GO on the AgNPs/Cu substrates.
Characterizations
The morphologies of the products were characterized by SEM (Quanta 200 FEG; FEI, Eindhoven, The Netherlands). EDS was used to obtain the elemental mapping analysis. The XRD was employed to determine the crystal structure of the samples. For SERS detection of drug residues in aquaculture water samples, the SERS substrates were soaked in 0.2 mL of analytes for 10 min, rinsed with ethanol and water separately, and air-dried before SERS measurements. The portable Raman spectrometer (i-Raman plus; B&W Tek Inc., Newark, Delaware, USA), as shown in Fig. 1, was used throughout the SERS and normal Raman measurements. An optical fiber was connected to microscope with an objective 20×. A 785 nm laser and a total accumulation time of 2 s were selected in collecting Raman spectra.
Supplementary material
To view supplementary material for this article, please visit https://doi.org/10.1557/jmr.2019.78.
Associated content
Supporting Information Available: The following files are available free of charge.
SEM image of Ag/Cu hybrid without using of Sn2+; SEM image of Ag nanoparticles grown on Cu substrate at 1 min reaction time; Raman intensity of CV at 1174 cm−1 as a function of the reaction times; Calculation of SERS enhancement factor (EF).
Notes
There are no conflicts to declare.
Acknowledgments
We thank the National Natural Science Foundation of China (No. 61205150), Project of Application Breeding Program of Hefei University of Technology (JZ2016YYPY0060), the Youth Academic Team Capacity Promotion Program (PA2017GDQT0023), and the Startup Foundation of Hefei University of Technology (JZ2015HGBZ0127, XC2015JZBZ17) for financial supports.