Introduction
Detecting terrestrial planets in habitable zones is exciting because life may exist on such planets. To support life, a planet must orbit in the habitable zone of its parent star and have a moderate climate. It may take a long time for life to reach complex, multicellular forms of life. For example, it took about 4 billion years for life on Earth to evolve from single-celled organisms to multicellular creatures such as plants, animals and fungi. A moderate long-term climate is crucial for life to reach multicellularity. In this paper, we assume that 5 billion years is long enough for life on other planets to evolve from the simple to the complex.
Earth's obliquity, or axis tilt, is stabilized by the Moon (Laskar et al. Reference Laskar, Joutel and Robutel1993). Mars, on the other hand, has relatively small satellites and its obliquity changes chaotically, fluctuating on a 100 000-year timescale (Laskar & Robutel Reference Laskar and Robutel1993). Hence, even if an Earth-sized exoplanet has a moon, the planetary obliquity may fluctuate wildly if that moon is too small. As planetary climate depends heavily on obliquity (Williams & Kasting Reference Williams and Kasting1997; Dobrovolskis Reference Dobrovolskis2013), such a planet may not maintain a favourable climate for evolutionarily relevant timescales. Therefore, orbital longevity of a moon may be an important factor allowing a planet to have a moderate long-term climate. The prospects for habitable planets may hinge on moons (Ward & Brownlee Reference Ward and Brownlee2000); but see also Lissauer et al. (Reference Lissauer, Barnes and Chambers2012).
The tidal torque controls the long-term orbital stability of extrasolar moons. Counselman (Reference Counselman1973) pointed out that in a planet–moon system with lunarFootnote 1 tides, there are three possible evolutionary states:
-
1. The semi-major axis of the moon's orbit tidally evolves inward until the moon hits the planet. Mars’ moon Phobos is one such example.
-
2. The semi-major axis of the moon's orbit tidally evolves outward until the moon escapes from the planet. While no solar system examples exist for this case, this result could be achieved for the Earth–Moon system if Earth's present rotation rate was doubled.
-
3. Lunar orbital and planetary spin angular velocities enter mutual resonance and are kept commensurate by tidal forces. This is the case for Charon, the dwarf planet Pluto's moon. Unlike the first two states, which are evolutionary, this state is static.
Ward & Reid (Reference Ward and Reid1973) considered a star–planet–moon system with stellar tides and examined the impact of solar tides on planetary rotation in a limited star–planet–moon without considering the effects of lunar tides or maximum distance from the planet. Barnes & O'Brien (Reference Barnes and O'Brien2002) considered a similar tidal evolution scenario, incorporating the maximum distance of the moon but not the lunar tides’ effect on planetary rotation. According to their work, the moon may either hit the planet or escape from it. Sasaki et al. (Reference Sasaki, Barnes and O'Brien2012) studied the general tidal evolution of star–planet–moon systems, extending Barnes & O'Brien (Reference Barnes and O'Brien2002) to include the lunar effect on planetary rotation. Sasaki et al. (Reference Sasaki, Barnes and O'Brien2012) also found the same two possible final states. Their result is applicable to a star–planet–moon system whose rocky planet orbits at a habitable distance. We are using lunar and stellar tides to refer to the tides raised on a planet by a moon and star, respectively.
In this paper, we investigate the conditions of star–planet–moon systems required for moons to have lifetimes greater than 5 billion years. We are especially interested in rocky planets within habitable distances. In the subsection ‘Parameters’, we provide a brief introduction of some important parameters such as the planetary tidal dissipation values and Love numbers. In the next subsection, we introduce tidal evolution trajectories. We consider the Earth in the section ‘Sun/Earth system Q p=12’. We then calculate the lifetime of moons with hypothetical moon/planet mass ratios and initial planetary rotational periods. We consider rocky planets with the same composition as the Earth in the section ‘Generalized habitable planets’. As not all extrasolar rocky planets are Earth-like, we examine four typical planet compositions in the subsection ‘Four typical compositions of planets with Q p=100’: 50% ice–50% rock, 100% rock, Earth-like (67% rock, 33% iron) and 100% iron. In the next subsection, we discuss the ‘critical line’ of moon-stability. In the section ‘Kepler-62’, we study the lifetimes of the hypothetical moons of two known rocky planets in their stars’ habitable zones, Kepler-62e and f. We discuss these results in the penultimate section and summarize our conclusion in the final section.
Method
We consider a star–planet–moon system and focus on the tidal effects on the planets due to the star and moon. We use standard tidal evolution theory with the constant Q approach (Goldreich & Soter Reference Goldreich and Soter1966). In our model, tides on a planet are induced by both the star and moon. Sasaki et al. (Reference Sasaki, Barnes and O'Brien2012) formulated tidal decay lifetimes for hypothetical moons orbiting extrasolar planets with both lunar and stellar tides. In this research, we apply the Sasaki et al. (Reference Sasaki, Barnes and O'Brien2012) method to ~1.0 M ⊙ star systems with 0.1–10 M ⊕ terrestrial planets at habitable distances. As we use the Sasaki et al. (Reference Sasaki, Barnes and O'Brien2012) method and apply their results, it is important to summarize the major assumptions of the model and the assumptions unique to this work:
-
1. The planet has 0° obliquity, the moon orbits in the planet's equatorial plane, and the planet and moon motions are prograde.
-
2. We neglect the orbital angular momentum of the moon about the star and the moon's rotational angular momentum.
-
3. The moon's orbit about the planet and the planet's orbit about the star are circular.
-
4. The star's spin angular momentum is neither considered, nor is the planet's tides on the star or the star's tides on the moon.
-
5. The specific dissipation function of the planet, Q p, is independent of the tidal forcing frequency and does not change as a function of time.
-
6. The systems start in a planet–moon synchronized state, i.e. the planetary angular spin velocity is equal to the moon's orbital angular velocity. This initial state is unstable, and the moon's orbit evolves rapidly outward thereafter.
Note that Sasaki et al. (Reference Sasaki, Barnes and O'Brien2012) does not use assumption 6. These assumptions simplify the calculations allowing us to apply them generally. They also reflect our goal of constraining the existence of moons because non-zero obliquity and eccentricities would only shorten the moons’ lifetimes.
Regarding assumption 6, if a planet–moon system does not start with the synchronized state, we can always find such a state by integrating the equations of the planetary angular spin velocity and the moon's orbital angular velocity backwards in time. A planet–moon system evolves quickly at first if it starts with the synchronized state. Hence, the error induced by assuming the synchronized state as the initial condition is small. With these assumptions, the upper bound for moons’ lifetimes can be estimated.
Parameters
The definition of a habitable distance is controversial in planetary science. Even for the Sun, there are several estimations. Dole (Reference Dole1964) predicted that the habitable distance from the Sun is between 0.725 and 1.24 AU. Hart (Reference Hart1979) concluded that the habitable distance is from 0.95 to 1.01 AU. More recently, Kopparapu et al. (Reference Kopparapu, Ramirez, Kasting, Eymet, Robinson, Mahadevan, Terrien, Domagal-Goldman, Meadows and Deshpande2013) estimated the habitable distance to be from 0.99 to 1.7 AU. Calculating the habitable distance is a difficult process even if restricted to the classic circumstellar habitable zone, which is based on sustainability of liquid water on the surface. The difference between the Sun and a lower mass star is not only the total radiant energy but also the peak wavelength which is important because it is closely related to planetary albedo. Ice on a planet's surface is very reflective in the visible light from Sun-type stars, but its albedo is low in the infrared region, the peak emission from low-mass stars (Joshi & Haberle Reference Joshi and Haberle2012; Shields et al. Reference Shields, Meadows, Bitz, Pierrehumbert, Joshi and Robinson2013). In this study, we take the habitable distance to be the distance at which the radiant energy of the centre star that the planet receives is the same as that of the Earth. At least at this distance, we know of at least one case in which a planet retains liquid water on its surface.
We use the following equation to find the habitable distance:
 $$d({\rm AU}) = \sqrt {\displaystyle{{L_*} \over {L_ \odot}}}, $$
where L * is the stellar luminosity. In lieu of a complex suite of stellar models, we adopt the rough approximation (Hansen & Kawaler Reference Hansen and Kawaler1994):
 $$\displaystyle{{L_*} \over {L_ \odot}} = \left( {\displaystyle{{M_*} \over {M_ \odot}}} \right)^{3.5}, $$
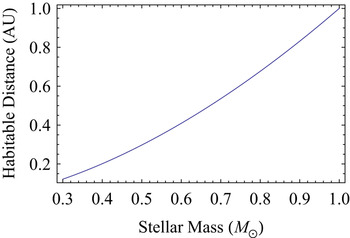
to estimate the luminosity as a function of stellar mass. Figure 1 shows our assumed habitable distance as a function of stellar mass.

Planetary radii, the planetary tidal dissipation values, and the Love numbers are important input values for the tidal theory. Planetary radii depend on the planet's composition (Fortney et al. Reference Fortney, Marley and Barnes2007). The three main ingredients of rocky planets are ice, rock and iron. We consider four planetary compositions: 50% ice–50% rock, 100% rock, Earth-like (67% rock, 33% iron) and 100% iron. Of these, 100%-iron planets may not commonly exist in the Universe. However, we consider these types of planets as end-member cases because, for a given planetary mass, a 100%-iron planet would have the smallest radius.
The planetary tidal dissipation value Q p was discussed by Goldreich & Soter (Reference Goldreich and Soter1966). Its definition comes from the analogy with forced, damped oscillators and evaluates the ratio between the maximum energy stored in during the cycle and the energy dissipated over one cycle by friction. A small value of Q p means large energy dissipation and vice versa. Estimating Q p is not an easy task because it depends on the specifics of planetary structure such as composition, equation of state, material properties, etc. The exact nature of a planet's tidal response is still under investigation (Hubbard Reference Hubbard1974; Goldreich & Nicholson Reference Goldreich and Nicholson1977; Ogilvie & Lin Reference Ogilvie and Lin2004; Ogilvie & Lin Reference Ogilvie and Lin2007). For rocky planets, the value of Q p ranges between 10 and 500 (Goldreich & Soter Reference Goldreich and Soter1966).
The Love number k 2 characterizes the overall elastic response of the planet to the tides and depends on the mass and composition of the planet. Earth's k 2 value is 0.299, for example. In the Appendix, we show the k 2 values in this study. As mentioned in the Introduction, a too small moon cannot stabilize planetary obliquity. To stabilize planetary obliquity, the moon must be large enough to exert a torque on the planet's rotational bulge comparable to that of the parent star. We estimate the minimum lunar mass capable of stabilizing planetary obliquity to be
 $$\displaystyle{{M_{\rm m}} \over {M_{\rm p}}} {\rm \mathbin{\lower.3ex\hbox{$\buildrel\gt\over {\smash{\scriptstyle\sim}\vphantom{_x}}$}}} \displaystyle{{{\rm \beta} ^3} \over 3},$$
where β is the distance of a moon in terms of the Hill radius, and M m and M p are the masses of moon and planet, respectively. This equation indicates that if we know the distance of a moon in terms of the Hill radius, we can estimate the minimum lunar mass required to stabilize a planet's obliquity. The derivation of equation (3) is in the Appendix.
Tidal evolution trajectories
To calculate the lifetime of the moon, we first determine the type of the system. There are four types of star–planet–moon systems based on the trajectories of the planets and moons: three ‘colliding’ (types I, II and III) and one ‘escaping’ (type IV) (Sasaki et al. Reference Sasaki, Barnes and O'Brien2012). The colliding type is defined by the semimajor axis of moon's orbit being continuously less than 0.36 the Hill radius all the time, with the moon hitting the planet in the end. The escaping type requires that the semimajor axis of the moon's orbit exceed this ratio at some time. A moon can maintain a stable circular orbit inside of 0.36 Hill radii because the perturbation from the Sun is small within this region. Outside of 0.36 Hill radii, the planet has difficulty holding on to the moon as its orbit evolves towards escape. While Barnes & O'Brien (Reference Barnes and O'Brien2002) suggest 0.36 for this critical ratio, Domingos et al. (Reference Domingos, Winter and Yokoyama2006) suggests 0.49. We use 0.36 for the critical ratio because it is the most conservative estimate for the moon to remain bound.
Here we summarized the types of tidal evolution paths defined by Sasaki et al. (Reference Sasaki, Barnes and O'Brien2012). If the tidal torque on the planet from the moon is always greater than that from the star, then the star–planet–moon system will be type I. As the tidal torque on the planet from the moon is greater than that from the star, the planet and moon evolve towards a synchronized state and remain synchronized once they reach this state. Systems with higher mass moons tend to be of type I. Our Sun–Earth–Moon system is type I.
On the other hand, if the tidal torque on the planet from the moon is always smaller than that of the star, then the system will be type III. As the tidal torque on the planet from the moon is smaller than that from the star, the planet's rotation will become synchronous with its year instead of the moon's orbital period. When the moon's mass is lower, the system tends to be of type III.
Type II is between types I and III. First, the planet and star reach a synchronized state, and then the planet and moon reach the synchronized state after the moon migrates inward. If the moon migrates outward to have a semimajor axis greater than 0.36 Hill radii, then the system will be type IV. In type IV system, the planet loses the moon interstellar space.
Sun/Earth system Q p=12
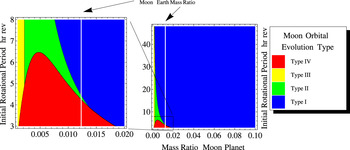
In this section, we apply the method that Sasaki et al. (Reference Sasaki, Barnes and O'Brien2012) introduced to the Sun/Earth system. Figure 2 shows the moon orbital evolution type of Sun–Earth system as a function of moon mass and initial planetary rotation. The white vertical line represents the mass ratio of real Moon and Earth.
The graph shows the moon orbital evolution type of Sun–Earth system according to the types defined by Sasaki et al. (Reference Sasaki, Barnes and O'Brien2012). Type IV is an unstable orbit where Earth loses the moon. Types I, II and III are stable orbits, which mean that Earth keeps the moon. The white vertical line represents the mass ratio of the real Moon and Earth. For the cases, our Sun–Earth system is Type I. Note that the orbital evolution types shown here are not a function of Q p.

The giant impact hypothesis is currently the favoured hypothesis for the origin of the Moon (Canup & Asphaug Reference Canup and Asphaug2001). Although this hypothesis explains the current angular momentum of the Earth–Moon system, the Moon's small iron core and the compositional similarity between the Moon and Earth (Stevenson Reference Stevenson1987), it does not explain how the oxygen isotropic composition of the Moon could be indistinguishable from that of the Earth (Wiechert et al. Reference Wiechert, Halliday, Lee, Snyder, Taylor and Rumble2001). Pahlevan & Stevenson (Reference Pahlevan and Stevenson2007), Canup (Reference Canup2012) and Ćuk & Stewart (Reference Ćuk and Stewart2012) suggested different models to solve this problem. It is beyond the scope of this paper to specifically model the formation of moons. However, the giant impact scenario might be the most common way for a rocky planet to have a moon. By this hypothesis, Earth's initial angular spin velocity would have been from 5 to 8 h rev−1 and the initial Earth–Moon distance is ~20 000 km corresponding to the orbital angular velocity of 7.8 h rev−1. The Earth–Moon system may have thus started near a planet–moon synchronized state, but an unstable one from which it evolved rapidly.
Our calculations suggest that the Sun–Earth–Moon system would be type I if both Earth's initial spin velocity and Moon's initial orbital angular velocity are between 5 and 8 h rev−1. This means that the torque on the Earth from the Moon is greater than that from the Sun. Earth's spin velocity slows down and the Moon spirals outward (we are in this stage now) until the Moon reaches a synchronous distance. Once the Moon reaches Earth's synchronous radius, the Moon's orbital angular velocity will be equal to Earth's spin angular velocity. However, because solar tides continue to rob angular momentum from the system, Earth's spin angular velocity and Moon's orbital angular velocity will both increase, meaning that the moon will spiral inward, until the Moon hits the Earth. When moons are of low mass and planets have short rotational periods, systems tend to be type IV (bottom left corner, red). In these conditions, it is hard for the planet to keep a light and fast-moving moon, which would spiral away until it was lost to interplanetary space.
If the Moon were less massive, then our Sun–Earth–Moon system would be type II. The fate of the hypothetical Sun–Earth–Moon system would be different. Earth's spin velocity slows down and the Moon spirals outward until the Moon reaches synchronous distance, like type I. As the Moon is less massive, the tidal torque due to the Moon is not large enough to keep the planet–moon synchronous state. Earth's spin velocity keeps slowing down therefore until it equals Earth's orbital angular velocity. In other words, Earth's day becomes longer and longer until 1 day equals 1 Earth's year. The system at that point is in the planet–star synchronous state. Meanwhile, the Moon starts spiralling inward. As the Moon is spiralling inward, the tidal torque due to the Moon becomes larger and larger. When the Moon is sufficiently close, the tidal torque due to the Moon overcomes that due to the Sun. At this point, the planet–star synchronous state ends. Earth's spin velocity starts increasing, which means that Earth's day becomes shorter and shorter. Eventually, the Earth and Moon reach the planet–moon synchronous state, which means that the Moon stays in one position in the sky as viewed from the Earth. When the system reaches the planet–moon synchronous state, Earth's spin velocity increases from solar tides and the Moon spirals inward until the Moon hits the Earth, similar to the end process for the type I state.
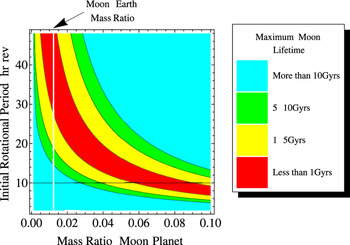
Figure 3 shows the lifetime for hypothetical moons of the Earth with differing initial planetary rotation and moon mass: less than 1 Gyr (red), 1–5 Gyr (yellow), 5–10 Gyr (green) and more than 10 Gyr (blue). Each graph of the lifetime of the moon given in Fig. 2 has its own graph of the type of the system as in Fig. 2. However, we only show the Sun–Earth case (Fig. 2) here because the basic features are the same in all cases.
The graph shows the lifetime of hypothetical moons in the Sun–Earth system. The white vertical line represents the mass ratio of the actual Moon and Earth. The black horizontal line is 10 h rev−1. The real Earth–Moon situation is on the white line and may be below the black line. Our result suggests that the lifetime of our Moon is more than 10 Gyr.

For a fixed small mass ratio, the longer the initial rotational period is the shorter the lifetime of the moon. The lifetime of the moon depends on the total initial angular momentum of the planet–moon system. When the system has smaller total angular momentum, the lifetime of the moon is shorter. For a fixed small mass ratio, the system has smaller total angular momentum when the initial rotational period is longer. Consider the Earth–Moon case as an example. The white vertical line represents the mass ratio of Moon and Earth. Our result indicates that for initial rotational periods up to 14 h rev−1, the lifetime of the moon is more than 10 Gyr, which agrees with the predictions of the giant impact hypothesis (5–8 h rev−1). On the other hand, the lifetime of the moon is shorter than the age of the Earth if the initial rotational period is 20 h rev−1 or slower. This result implies that if the initial rotational period had been 20 h rev−1 or slower, the moon would have already hit the Earth, a thankfully unachieved result.
For a fixed fast initial rotational period, say 8 h rev−1, the relationship between the mass ratio and the lifetime is monotonic. The bigger the mass of the moon, the shorter the lifetime. At 8 h rev−1, the lifetime of the moon is more than 10 Gyr when the moon–planet mass ratio is up to 0.04. The lifetimes are 5 and 1 Gyr when the mass ratio is 0.055 and 0.08, respectively. The lifetime is less than 1 Gyr when the mass ratio is more than 0.08.
For a slower rotational period, say 20 h rev−1, the relationship between the mass ratio and the lifetime is not monotonic. There are two ways for the moon to have more than 1 Gyr lifetime. In this specific case, when the moon–planet mass ratio is either up to 0.02 or more than 0.04, the moon can survive longer than 1 Gyr.
Generalized habitable planets
We now extend the investigation of the previous section to the lifetimes of moons around hypothetical habitable extrasolar planets by considering ~1.0 M ⊙ star and 0.1–10 M ⊕ planet systems with Q p=10 and 100. We consider planets made of 50% ice–50% rock, 100% rock, Earth-like (67% rock, 33% iron) and 100% iron. We show the results for those planets orbiting 0.4–1.0 M ⊙ stars because stars less than 0.4 M ⊙ all have the same results as stars with 0.4 M ⊙.
Earth-like planets with high dissipation
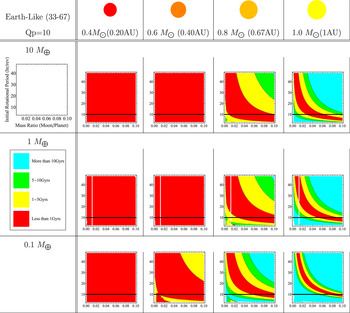
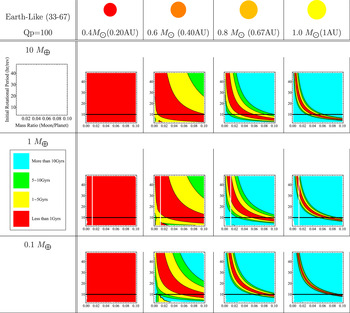
Earth-like planets at habitable distances might have environments similar to that of the Earth. By the definition of the planetary tidal dissipation value, Q p=10 indicates that there exists a mechanism that dissipates large amounts of tidal energy each cycle. On the Earth it is well known that tidal dissipation occurs mainly in the oceans (Munk & MacDonald Reference Munk and MacDonald1960; Egbert & Ray Reference Egbert and Ray2000; Ray et al. Reference Ray, Eanes and Lemoine2001). Tidal friction takes place mainly in the hydrosphere, particularly in shallow seas, those that are less than ~100 m deep on the continental shelf (Lambeck Reference Lambeck1980). Tidal energy dissipation was significantly lower over the past 3 million years on average and one possible reason is a reduction in global tidal friction during periods of glacio-eustatic sea level lowering (Lourens et al. Reference Lourens, Wehausen and Brumsack2001). For the Earth, tidal sloshing in shallow seas may be the mechanism that dissipates large amounts of energy. As it is hard to estimate Q p from the planetary structure directly, Q p=10 does not necessarily mean that a planet has shallow seas. However, given that we do not presently know of any other mechanism that can dissipate large tidal energy besides shallow seas, we assume that Q p=10 indicates that a planet may have shallow seas. Figure 4 shows the lifetimes of the moons whose planets have the same compositions of the Earth and orbit at the habitable distance from 0.4 to 1.0 M ⊙ stars. For 0.4 and 0.6 M ⊙ stars, moons cannot orbit around their planets for more than 5 Gyr in any situation. These planets’ Hill spheres are too small.
The figure shows our calculated lifetimes for moons whose planets have the same compositions as that of the Earth with high tidal dissipation (Q p=10) and orbit at a habitable distance of 0.4−1.0 M ⊙ stars. The numbers in parentheses are the habitable distance for each star. The circles represent the colour and relative size of the stars. The white vertical line represents the mass ratio of the actual Moon and Earth. The black horizontal line is 10 h rev−1. For 0.4 and 0.6 M ⊙ stars, moons cannot orbit around their planets for more than 5 Gyr in any situation.

For 0.8 and 1.0 M ⊙ stars, moons around Earth-composition planets can survive for more than 5 Gyr if the conditions are appropriate. One way that moons can survive more than 5 Gyr is to have the moon/planet mass ratio be greater than 0.09 and the initial rotational period be 30 h rev−1 or slower. If we restrict ourselves to relatively fast initial planetary rotational rates, as might result from giant-impact origins for the moon, (below the black line), the results are dramatic: if the stellar mass is 0.8 M ⊙, it is almost impossible for 1 and 10 M ⊕ planets to have a moon with a lifetime longer than 5 Gyr. If the Earth–Moon system formed at the habitable distance around a 0.8 M ⊙ star, then the moon would have already hit the Earth or been lost to interplanetary space. For 1.0 M ⊙ stellar mass, small-mass planets easily have moons whose lifetimes are longer than 5 Gyr. On the other hand, large mass planets can have moons whose lifetimes are longer than 5 Gyr if their initial rotational periods are sufficiently fast and moon/planet mass ratios are sufficiently small.
Earth-like planets with low dissipation
In this section, we examine Earth-like planets again. However, this time, we use Q p=100 as might befit a planet with no ocean or deep oceans. As we mentioned earlier, calculating Q p is not easy. Mars has a Q p value of 86 (Murray & Dermott Reference Murray and Dermott2000; Bills et al. Reference Bills, Neumann, Smith and Zuber2005) and tidal dissipation is driven by viscous dissipation within the bulk of the planetary interior (Bills et al. Reference Bills, Neumann, Smith and Zuber2005). Even though Mars has a Q p value of 86, we cannot conclude that a planet whose Q p is about 100 has the same dissipation mechanism as Mars. However, the dissipation mechanism of Mars is one possibility that a planet has a Q p value of about 100. Moreover, a deep ocean planet may have a Q p value of about 100 (Sagan & Dermott Reference Sagan and Dermott1982). An ocean planet is a type of planet whose surface is completely covered by one to hundreds of kilometres of water.
Figure 5 shows the lifetimes of the moons whose planets have the same composition as that of Earth, have Q p=100 and orbit in the habitable distance of 0.4–1.0 M ⊙ stars. For 0.8 and 1.0 M ⊙, moons can survive more than 10 Gyr in most cases. If we restrict ourselves to planets with relatively fast initial planetary rotational rates (below the black line), then lifetimes are commonly more than 10 Gyr.
The figure shows the lifetime of a hypothetical moon, whose planet is made of the same bulk composition as the Earth with low dissipation (Q p=100) and which orbits at a habitable distance from a 0.4 to 1.0 M ⊙ star. For 0.4 M ⊙ stars and later, moons cannot orbit around their planets for more than 5 Gyr in any situation.

For 0.4 and 0.6 M ⊙, it is difficult for moons to have longer lifetimes. If the star is 0.4 M ⊙, then moons cannot survive more than 5 Gyr. If the star's mass is 0.6 M ⊙, then the moons’ lifetimes are at most 10 Gyr for the 1 and 10 M ⊕ cases.
Four typical compositions of planets with Q p=100
In subsections ‘Earth-like planets with high dissipation’ and ‘Earth-like planets with low dissipation’, we considered planets with an Earth-like bulk composition. However, not all rocky extrasolar planets will be Earth-like. In this section, we examine four typical planet compositions: 50% ice–50% rock, 100% rock, Earth-like (67% rock, 33% iron) and 100% iron. For uniformity, we assume that the mass of the parent star is the same as that of the Sun.
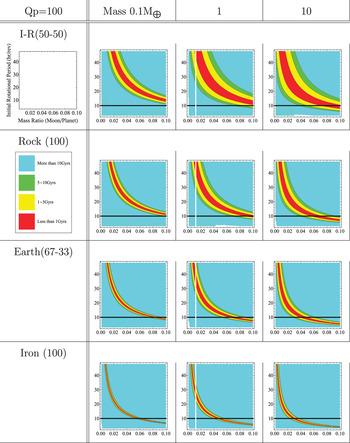
Figure 6 shows the lifetimes of moons whose planets are composed of the four considered compositions. We can see that the lifetimes of moons depend on the composition of the planets. Moons can easily survive for more than 10 Gyr around iron planets than ice–rock planets. Moons live longer when their host planet is denser. For a fixed planetary mass, the planet's radius decreases with increasing density, as do tidal torques. When the tidal torque is small, the system evolves more slowly. Hence, a moon has a longer lifetime when its host planet has higher density. For iron planets, moons can survive more than 10 Gyr in the majority of cases. On the other hand, for an ice–rock planet, there is a relatively narrow range of conditions under which a moon can survive for more than 10 Gyr. Unlike iron planets, moons of ice–rock planets must have very specific initial conditions to have more than 10 Gyr lifetimes. The black vertical lines represent the estimated minimum lunar mass required to stabilize planetary obliquity as detailed in the subsection ‘Paremeters’. When the initial rotational rate is fast, moons spiral out to greater distances. Hence, moons have to be heavier by equation (3). On the other hand, moons do not migrate outward very far when the initial rotational rate is slow. Hence, moons can be lighter and still stabilize obliquity. We include the minimum lunar masses only in Fig. 6 because they have similar features in other cases.
This table shows the lifetimes of moons whose planets have different masses and compositions. We use Q p=100. We show the assumed Love number, k 2, and moment of inertia constant, α, in the Appendix. For the same composition, the heavier the mass of the planetis, the shorter the lifetime of the moon. For the same mass, the denser the planet is, the longer the lifetime of the moon. The black vertical lines represent the minimum lunar mass to stabilize planetary obliquity mentioned in the subsection ‘Parameters’.

The critical line
In the subsection ‘Earth-like planets with high dissipation’, we showed that moons cannot survive more than 5 Gyr around 0.4 M ⊙ and 0.6 M ⊙ stars provided that Q p is 10 and from the subsection ‘Earth-like planets with low dissipation’, if the stellar mass is 0.4 M ⊙, then the lifetimes of moons are no more than 5 Gyr provided that Q p is 100.
Therefore, there is a minimum stellar mass below which moons cannot survive more than 5 Gyr. For Q p=10, this minimum stellar mass is between 0.6 and 0.8 M ⊙. For Q p=100, it is between 0.4 and 0.6 M ⊙. In Section 4.3 ‘Four typical compositions of planets with Qp=100’, we see that the lifetime of the moon depends on the composition of the planet. The minimum stellar mass for which moons cannot survive more than 5 Gyr also should depend on the composition of the planet. Thus, our results allow us to draw a ‘critical line’ of moon-stability, inward of which moons are unstable and outside of which they can survive for astrobiologically relevant timescales.
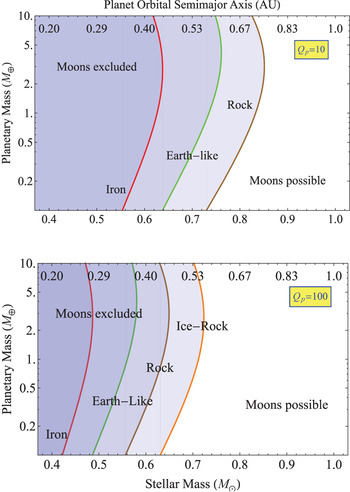
In Fig. 7, we show the critical lines not only for Earth-like planets but also for the other planetary compositions such as iron, Earth-like, rock and ice–rock. For Q p=10, we do not consider ice–rock planets because no tidal dissipation mechanism proposed has been capable of generating enough tidal friction on deep ocean planet to allow Q p=10.
The graph shows 5 Gyr critical lines for assumed Q p=10 and Q p=100. We do not consider ice–rock planets with Q p=10. For each planet composition, if a star–planet–moon system is in the left side of the line, then a moon cannot survive more than 5 Gyr. If a star–planet–moon system is on the right side of the line, then a moon may or may not survive more than 5 Gyr, depending on the initial rotational period and moon/planet mass ratio.

We draw two conclusions from the locations of the critical lines in Fig. 7. First, if Q p is lower, then the critical stellar mass is higher. For small Q p, a star–planet–moon system loses energy easily and the system evolves more quickly. Hence, the critical stellar mass becomes larger.
Second, if the planetary density is higher, then the critical mass is lower, and more moons are stable. The torque on the planet due to the moon is proportional to the radius of the planet to the fifth power. Therefore, because a higher density indicates a smaller radius, the torque on the planet is lower, all else being equal. The system then evolves slowly. Hence, the critical mass becomes smaller.
Our results indicate that a rocky planet with Q p=10 at the habitable distance cannot have a moon whose lifetime is longer than 5 Gyr if the stellar mass is less than 0.55 M ⊙. For Q p=100, if the stellar mass is less than 0.42 M ⊙, the longevity of moon cannot be longer than 5 Gyr.
Kepler-62
So far, we have considered hypothetical star–planet–moon systems. In this section, we explore the prospect for moons in a real potentially habitable star–planet system.
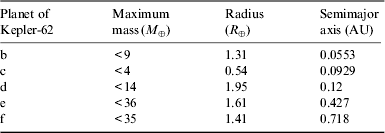
Kepler-62, a K-type star with 0.64 R ⊙ and 0.69 M ⊙, is a five-planet system. Two of these planets have 1.4 and 1.6 Earth radii and orbit in the habitable zone: Kepler-62e and f. Table 1 shows the maximum masses, radii and semimajor axes of all five planets in the Kepler-62 system. Theoretical models suggest that Kepler-62e and f could be solid, either with a rocky composition or composed of mostly solid water in their bulk (Borucki et al. Reference Borucki2013). We calculate tidal decay lifetimes for hypothetical moons of Kepler-62e and f using all four possible planetary compositions as well as both Q p=10 and 100.
(Borucki et al. Reference Borucki2013).

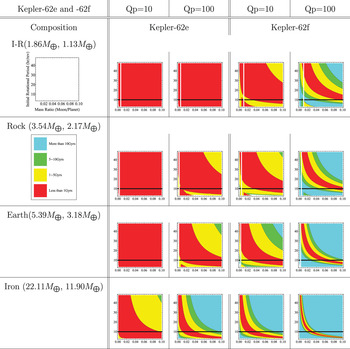
Figure 8 shows lifetimes of the hypothetical moons of Kepler-62e and f. The white vertical lines represent the mass ratio of our Moon and Kepler-62e and f. From the radii of these planets, we can estimate planetary masses depending on the compositions (Fortney et al. Reference Fortney, Marley and Barnes2007). If the planets are made of low-density material, such as ice, then their masses are about that of Earth. If the planets are made of high-density material, such as iron, then Kepler-62e and f are much more massive than the Earth. Our result shows that Kepler-62e could host a moon whose lifetime is longer than 5 Gyr only if it is made of iron and has Q p=100. On the other hand, many situations exist for a moon of Kepler-62f to have a lifetime longer than 5 Gyr. Especially for Q p=100, moons of Kepler-62f can have at least 5 Gyr lifetime regardless of planet composition.
The table shows the lifetimes of the hypothetical moons of Kepler-62e and f. The numbers in the parentheses next to planetary compositions are the theoretical masses of Kepler-62e and f, respectively. The white vertical lines are the mass ratio of our Moon to Kepler-62e and f. The black horizontal line is 10 h rev−1.

Discussion
Detecting rocky planets in habitable zones is of astrobiological interest because life as we know it may be possible on such planets. Kepler-62e and f are two known rocky planets in the habitable zone. However, we show that it is hard for a moon of Kepler-62e to survive more than 5 Gyr (Fig. 8). Without a ‘long-lived’ moon, a planet may not have a long-term moderate climate. Hence, life on Kepler-62e might not have enough time to evolve complex life.
In contrast, it is relatively easy for Kepler-62f to have a surviving moon. However, climate is sensitive. Stable planetary obliquity helps to support but does not guarantee a moderate climate. We would need more detailed calculations of planetary obliquity evolution to test whether Kepler-62f has a long-term moderate obliquity under various conditions. As Kepler-62 is a newly discovered star–planet system, we do not yet know if Kepler-62f has a suitable environment for life. We need more information to draw a conclusion. From the standpoint of its ability to retain a large moon for potential climatic stability, Kepler-62f could possibly have appropriate conditions for life.
We are interested in searching for rocky planets on which complex life might exist. Here we define complex life to mean multicellular creatures such as plants, animals and fungi. Our research shows that the minimum stellar masses below which moons cannot survive more than 5 Gyr depends on the composition of the planets (Fig. 7). For Q p=10, the minimum values of such stellar masses are 0.55, 0.64 and 0.73 M ⊙ for iron, Earth-like and rock, respectively. For Q p=100, these masses are 0.42, 0.49, 0.56 and 0.63 M ⊙ for iron, Earth-like, rock and ice–rock, respectively (Fig. 7). If a planet has a long-lived moon, then that planet may have a long-term moderate climate. Hence, the planet has a better chance to have complex life on it. Estimating the timespan for life to evolve from single-celled life forms to complex life formsis not easy. To estimate this timespan, oxygen is the key material. It took about 2 Gyr before Earth's atmosphere began to have oxygen molecules, and life on the Earth evolved from single-celled life forms to complex life forms because the concentration of oxygen became high enough 600 million years ago (Ward & Brownlee Reference Ward and Brownlee2000). For complex life on other planets, the situation may be the same. First, there are no oxygen molecules in planetary atmosphere. It may take a few Gyrs for planets to begin to have oxygen molecules in their atmosphere. It may also take a few Gyrs before the oxygen concentration became high enough to support complex life. Therefore, it may take 4–5 Gyr timescale for life on the other planets to evolve from simple life to complex life.
On the basis of this reasoning that ~5 Gyr is the time necessary for biological evolution, star–planet–moon systems whose host stars are less than 0.42 M ⊙ may not be good choice to look for habitable planets that may have complex life because in any moon/planet ratio and initial planetary rotational rate moons cannot survive more than 5 Gyr. For Q p=10, the maximum value of the critical line is 0.85 M ⊙ when the composition of the planet is rock. For Q p=100, the maximum value of the critical line is 0.72 M ⊙ when the composition of the planet is ice–rock. This means that there are moon/planet mass ratio and initial planetary rotational rates such that the lifetime of the moon can be greater than 5 Gyr regardless of the composition of the planet if the stellar mass is greater than 0.85 M ⊙. Hence, planets whose parent stars are more than 0.85 M ⊙ can easily retain large moons. If the evolution of life on other planets is much faster than in our case, then our analysis would need to be modified. If for instance the required timespan for life to become multicellular were 1 or 2 Gyr, then more worlds around less massive stars could retain their large obliquity stabilizing moons.
Conclusion
On our 4.6-billion-year-old Earth, life took about 3.8 billion years to evolve from single-celled organisms to multicellular. A long-term moderate climate is thought to be crucial for life to evolve into complex forms. Stable obliquity of the Earth is the key for such a scenario, as Earth's obliquity is stabilized by the Moon (Laskar et al. Reference Laskar, Joutel and Robutel1993). If other habitable planets require moons to maintain obliquity, then the longevity of the planet's moon is also important for life to evolve there. We assume that 5 billion years is long enough for life on other planets to become multicellular. In this research, we studied what conditions star–planet–moon systems require in order to have moons with lifetimes longer than 5 billion years.
First, we consider Earth. According to the giant impact hypothesis, the initial rotational period is from 5 to 8 h rev−1. Under this condition, our result suggests that the Earth's Moon could survive more than 10 Gyr. Even if the initial rotational rate were as slow as 20 h rev−1, the Moon would survive more than 5 Gyr.
Next, we consider hypothetical Earth-like extrasolar planets, with 0.1, 1.0 and 10.0 M ⊕, at the habitable distance from ~1.0 M ⊙ stars. These planets are assumed to have the same composition as the Earth, which is 67% iron and 33% rock, and similar tidal dissipation Q p=10. For 0.4 and 0.6 M ⊙, moons cannot orbit around their planets more than 5 Gyr in any situation. For 0.8 and 1.0 M ⊙, moons can survive more than 5 Gyr if the initial conditions are appropriate. For the case where Q p=100 and the star has 0.4 M ⊙, it is impossible for moons to have more than 5 Gyr lifetimes. For 0.6 M ⊙ and Q p=100, moons can survive more than 5 Gyr if the conditions are appropriate. For 1.0 and 0.8 M ⊙, moons can survive more than 10 Gyr in most cases.
Not all extrasolar rocky planets are necessarily Earth-like in composition. We consider five typical planet compositions that are 50% ice–50% rock, 100% rock, Earth-like (67% rock, 33% iron) and 100% iron. Our result indicates that the lifetime of the moon depends on planet compositions and the moon has a longer lifetime when its host planet has higher density, for the same planet mass.
The results of subsections ‘Earth-like planets with high dissipation’ and ‘Earth-like planets with low dissipation’ show that there is a minimum stellar mass below which moons of habitable planets cannot survive for more than 5 Gyr. We show the minimum stellar mass lines not only for Earth-like planets but also for other planet compositions. Our result shows that for Q p=10, the stellar mass should be larger than 0.55 M ⊙ for a rocky planet in the habitable distance to have a moon whose lifetime is longer than 5 Gyr. For Q p=100, the stellar mass should be larger than 0.42 M ⊙.
Finally, we calculate tidal decay lifetimes for hypothetical moons of Kepler-62e and f, which are in their star's habitable zone. We examine all four possible compositions as well as Q p=10 and 100. Our result shows that Kepler-62e could have a moon whose lifetime is longer than 5 Gyr only if the planet is made of iron and Q p=100. On the other hand, there are a lot of situations in which Kepler-62f could have a moon whose lifetime is longer than 5 Gyr. Especially for Q p=100, Kepler-62f could have a 5-Gyr-lifetime-moon for a variety of planetary compositions.
Acknowledgements
T.S and J.W.B are supported by the NASA Exobiology program grand NNX 09AM99G.
Appendix
Love numbers and moment of inertia constants
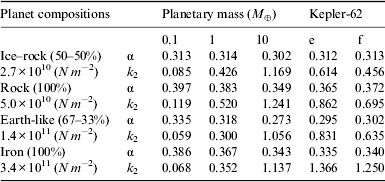
In tidal theory, the Love number, k 2, and the moment of inertia constant, α, are important numbers. These numbers depend on the planet's mass and composition. The Love number is a measure of the tidal distortion of a planet in response to the gravitational pull of nearby bodies. This number can be between 0 and 1.5. The Love number is 0 and 1.5 if a planet is a completely rigid body and made of a strengthless fluid, respectively. The moment of inertia constant tells us the mass distribution within a planet. For a uniform mass distribution planet, the moment of inertia constant is 0.4. The Earth's moment of inertia constant is 0.33. This is due to the fact that the Earth has a dense inner core surrounded by a less dense outer core and an even less dense mantle.
Table 2 shows the Love numbers and the moment of inertia constants that we used in this study. The structure of spherical symmetric planets in hydrostatic equilibrium obeys the following relationships (Fortney et al. Reference Fortney, Marley and Barnes2007). Equations (4) and (5) are called mass continuity and hydrostatic equilibrium, respectively:
 $$\displaystyle{{{\rm \partial} r} \over {\partial m}} = \displaystyle{1 \over {4{\rm \pi} r^2 {\rm \rho}}}, $$
 $$\displaystyle{{\partial P} \over {\partial m}} = - \displaystyle{{Gm} \over {4{\rm \pi} r^4}}, $$
 $${\rm \rho} = {\rm \rho} (P),$$
The table shows the Love numbers and the moment of inertia constants that we used in this study. The number below each planetary composition is rigidity of the planet.

where r is the radius of a mass shell, m is the mass of a given shell, ρ is the local mass density, P is the pressure and G is the gravitational constant. Density–pressure relationships, equation (6), depend on materials. Figure 1 of Fortney et al. (Reference Fortney, Marley and Barnes2007) is the graph of density–pressure relationships for iron, rock and water ice. We interpolate density–pressure relationships for iron, rock and water ice from Fig. 1 of Fortney et al. (Reference Fortney, Marley and Barnes2007). We numerically integrate equations (4)–(6) starting at the planetary centre conditions r(0)=(3/4πρ0)1/3 and P(0)=P central, where ρ0 is the density at the centre and P central is a chosen central pressure such that P(M)=0, where M is the planetary mass. To find the moment of inertia constant, we calculate:
 $$\displaystyle{{\displaystyle{2 \over 3}\int_0^M {r^2 dm}} \over {MR^2}}, $$
where R=r(M) is the planetary radius.
The Love number, k 2, is defined by Murray & Dermott (Reference Murray and Dermott2000):
 $$k_2 = \displaystyle{{3/2} \over {1 + {\rm \tilde \mu}}}, $$
where
 ${\rm \tilde \mu} $
is the effective rigidity. The effective rigidity is given by Murray & Dermott (Reference Murray and Dermott2000):
 $${\rm \tilde \mu} = \displaystyle{{19} \over 2}\displaystyle{{\rm \mu} \over {{\rm \rho} g_s R}},$$
where μ is rigidity, g s is the surface gravity and R is the radius of the planet. The planetary radii are provided in Fortney et al. (Reference Fortney, Marley and Barnes2007). We obtain the rigidities of ice, rock and the Earth from Dermott (2000). We choose the rigidity of ice–rock is the average of ice and rock, and iron is the linear extension of rock and is Earth-like.
Equation (9) was derived for the assumption of a uniform interior of a planet. For a non-uniform interior, equation (9) will only give us an approximation of the correct value. The planet's rigidity depends on its internal structure. The rigidity of non-uniform planet may not be just the average of the rigidities of two materials; however, we do not have enough knowledge to estimate the rigidity and effective rigidity for non-uniform interior planets. Therefore, equation (9) is a reasonable way to estimate the effective rigidity for a non-uniform interior planet. As our knowledge of rocky exoplanets matures, more sophisticated approaches like that of Moore & Schubert (Reference Moore and Schubert2000) may be warranted.
The minimum lunar mass
The minimum lunar mass required to stabilize a planet's obliquity is important but complicated. Here, we calculate an estimate of the minimum lunar mass necessary to affect a planet's axial precession. In order to affect planetary obliquity, the torque on a planet due from its moon must be comparable to that due to a star. The torque on the planet due to the moon τ p−m is given by Goldreich & Soter (Reference Goldreich and Soter1966); Murray & Dermott (Reference Murray and Dermott2000); Barnes & O'Brien (Reference Barnes and O'Brien2002) in Chapter 4:
 $${\rm \tau} _{{\rm p} - {\rm m}} = - \displaystyle{3 \over 2}\displaystyle{{k_{2{\rm p}} GM_{\rm m}^2 R_{\rm p}^5} \over {Q_{\rm p} a_{\rm m}^6}}, $$
where k 2p is the tidal Love number of the planet, G is the gravitational constant, R p is the radius of the planet, M m is the mass of the moon and a m is the semimajor axis of the moon's orbit. Similarly, the torque on the planet due to the star τp−s is:
 $${\rm \tau} _{{\rm p} - {\rm s}} = - \displaystyle{3 \over 2}\displaystyle{{k_{2{\rm p}} GM_{\rm s}^2 R_{\rm p}^5} \over {Q_{\rm p} a_{\rm p}^6}}, $$
where M s is the mass of the star, a p is the semimajor axis of the planet's orbit. Set |τp−m |>|τp−s | and simplify. We have:
 $$M_{\rm m} \gt M_{\rm s} \left( {\displaystyle{{a_{\rm m}} \over {a_{\rm p}}}} \right)^3. $$
Let β be a constant such that
 $$a_{\rm m} = {\rm \beta} R_{\rm H} $$
where R H is the radius of the Hill sphere (de Pater & Lissauer Reference de Pater and Lissauer2001):
 $$R_{\rm H} = a_{\rm p} \left( {\displaystyle{{M_{\rm p}} \over {3M_{\rm s}}}} \right)^{1/3}. $$
Simplify equation (12) using equations (13) and (14).
We have
 $$\displaystyle{{M_{\rm m}} \over {M_{\rm p}}} \gt \displaystyle{{{\rm \beta} ^3} \over 3}.$$