Introduction
Depression is a common disorder in informal caregivers (Dura et al., Reference Dura, Stukenberg and Kiecolt-Glaser1991; Coope et al., Reference Coope1995; Cohen, Reference Cohen2000). Caregivers of dementia patients, in particular, experience higher levels of depressive symptoms compared to non-caregivers, but also compared to caregivers of physically-impaired older adults (Ory et al., Reference Ory, Hoffman, Yee, Tennstedt and Schulz1999). A systematic review reported that almost half of the caregivers develop a depressive disorder within a year (Cuijpers, Reference Cuijpers2005). A recent cohort study estimated that the incidence of depression in spouses of patients with dementia was more than four times higher than in persons with a spouse with no dementia (Joling et al., Reference Joling2010).
Depression in caregivers not only reduces their quality of life, but also leads to less optimal care for their relatives, which begs the question how the incidence of depression in caregivers can be lowered. A meta-analysis of 19 randomized prevention trials (among non-caregiving populations) showed that the incidence of depression can be reduced by 22% (Cuijpers et al., Reference Cuijpers, van, Smit, Mihalopoulos and Beekman2008b). Depression prevention programs might be a successful strategy to improve the health of dementia caregivers.
Current data suggest that focusing attention on high-risk groups is likely to be more fruitful than adopting preventive strategies aimed at the whole population (Beekman et al., Reference Beekman, Smit, Stek, Reynolds and Cuijpers2010). Therefore, it is important to know how to select groups of caregivers at increased risk of developing depression to target preventive efforts effectively.
With more precise information about the risk indicators of the onset of depression in caregivers, we could identify high-risk groups in which prevention programs might generate substantial health gains for the least effort. Since long-term institutionalization of patients is extremely costly and the mental health of the informal caregiver is often decisive in the timing of nursing home placement (Mittelman et al., Reference Mittelman, Haley, Clay and Roth2006), targeted prevention of depression may be likely to be cost-effective as well. The aim of this study was to identify target groups for prevention of depression among caregivers of persons with dementia.
Methods
Design and procedures
Data were derived from the Resources for Enhancing Alzheimer's Caregiver Health study (REACH). The design of REACH has been described elsewhere (Gitlin et al., Reference Gitlin2003; Wisniewski et al., Reference Wisniewski2003). Briefly, REACH tested the effectiveness of a series of interventions aimed at improving the health and well-being of family caregivers living with and caring for persons with dementia. Data for 1229 dyads of caregivers and care recipients recruited from multiple community sites and health services were collected at six sites in the USA. Follow-up assessments were administered at 6, 12 and 18 months.
Sample
For the present study, caregivers of the intervention and control group were combined into a single cohort. Of the 1229 caregivers of dementia patients interviewed at baseline, 504 persons had clinically significant depressive symptoms at baseline (defined as a score ≥16 on the Center for Epidemiologic Studies - Depression Scale (CES-D)). The cohort at risk of becoming incident cases of depression thus consisted of 725 persons who at baseline had not met the criteria for depression. The longitudinal data of 725 of the 1229 caregivers were available for this analysis based on the baseline and all follow-up assessments of REACH.
Depression
Depression was measured with the CES-D scale. This instrument was designed for screening and monitoring depression and consists of 20 items with total scores ranging between 0 and 60 with higher scores indicating greater depressive symptom severity. Scores of 16 and higher indicate the presence of clinically significant depression (Radloff, Reference Radloff1977). The CES-D was measured at baseline and at all follow-up interviews.
A person was deemed to be an incident case when two criteria were met: (1) presence of depression at follow-up (CES-D score ≥16), and (2) significant increase in depression severity between two follow-up measurements (change score on the CES-D ≥ 5). Criterion 1 was used to ascertain depression status at one of the three follow-up measurements, and criterion 2 to prevent false-positive cases due to measurement error in the CES-D. A change of 5 scale points on the CES-D was chosen, because it represents, in clinical terms, a medium to large change (Lipsey and Wilson, Reference Lipsey and Wilson1993; Beekman et al., Reference Beekman2002; Smit et al., Reference Smit, Beekman, Cuijpers, de and Vollebergh2004).
Putative risk indicators
To identify variables that predict the onset of depression, several putative predictors were assessed at baseline interview, including sociodemographics, clinical variables and characteristics of the caregiver context. We based the selection of predictors on previous cross-sectional studies on risk factors for depression in caregivers (Schulz and Williamson, Reference Schulz and Williamson1991; Schulz et al., Reference Schulz, O'Brien, Bookwala and Fleissner1995; Livingston et al., Reference Livingston, Manela and Katona1996; Donaldson et al., Reference Donaldson, Tarrier and Burns1997; Clyburn et al., Reference Clyburn, Stones, Hadjistavropoulos and Tuokko2000; Janevic and Connell, Reference Janevic and Connell2001) All risk indicators were dichotomized at the median such that the index category (coded 1) was the assumed higher risk compared with the reference category (coded 0). Dichotomization was carried out before the analysis.
Socio-demographics of the caregiver included: gender, age, race/ethnicity (black = reference category, as black persons in our sample had the lowest risk of developing depression), education (primary school vs. secondary school or higher), being spouse of the patient. Age and gender of the care recipient were also measured.
Clinical characteristics included self-rated poor health (1 = poor/fair, 0 = good- excellent), depressive symptoms (1 = CES-D scores between 7 and 15, 0 = CES-D <7, i.e. below 50th percentile), anxious symptoms as measured with the Anxiety Inventory (Spielberger et al., Reference Spielberger, Gorsuch, Lushene, Vagg and Jacobs1983) (1 = score > 18, 0 = scores ≤ 18), antidepressant use.
Severity of dementia-related problems was assessed using threes measures of the severity of the care recipients’ problems: physical health of the care recipient was rated by the caregiver (1 = poor/fair, 0 = good- excellent); cognitive functioning was assessed with the Mini-Mental State Examination (MMSE) (Folstein et al., Reference Folstein, Folstein and McHugh1975), a higher score indicating better cognitive functioning (1 = MMSE below 13, 0 = MMSE 13 or higher); and behavioral problems were measured with the disruptive behavior subscale of the Revised Memory and Behavior Problems Checklist (Teri et al., Reference Teri, Truax, Logsdon, Uomoto, Zarit and Vitaliano1992) (1 = 2 or more disruptive behaviors, 0 = less than 2 disruptive behaviors).
Characteristics of the caregiving context included: hours a day “doing things for the patient” (1 = 6 or more, 0 = less than 6), how long caregivers had taken care of their relative (1 = 3 years or more, 0 = less than 3 years) and social support (help from family and friends last week yes/no), distress or burden caused by the presence of memory and behavior problems as measured with the Revised Memory and Behavior Problems Checklist (RMBPC) burden score (1 = high burden, 0 = low burden).
Methodology for selecting high-risk groups
The methodology used to select high-risk groups was developed by Smit et al. (Reference Smit, Beekman, Cuijpers, de and Vollebergh2004), and has been used in previous research (Schoevers et al., Reference Schoevers2006; Smit et al., Reference Smit, Ederveen, Cuijpers, Deeg and Beekman2006; Reference Smit, Comijs, Schoevers, Cuijpers, Deeg and Beekman2007; Batelaan et al., Reference Batelaan, Smits, de, van Balkom, Vollebergh and Beekman2010). First, the risk indicators that are most strongly related to the onset of depression were selected from our set of putative risk indicators, based on the magnitude of their odds ratio (OR). This set of strongest risk indicators was used as a starting point for the selection of the best target groups for preventive interventions: i.e. those in which the expected health gain of a preventive intervention is as large as possible, the effort to generate that health gain as small as possible, and in which prevention is likely to be efficient. This selection process was based on the OR, the attributable fraction (AF), the exposure rate (ER), and the number needed to be treated (NNT). The OR describes the strength of the association between the risk indicator and the subsequent risk of developing depression. The AF represents the percentage by which the incidence rate of depression can be reduced when the adverse effect of a risk factor is completely eliminated (Miettinen, Reference Miettinen1974; Rothman and Greenland, Reference Rothman and Greenland1998). The ER represents the percentage of the caregiver sample exposed to the risk indicator. Finally, the NNT indicates how many caregivers would have to receive a preventive intervention to avoid one new case of depression, assuming that the adverse effect of the risk factor can be completely blocked by the preventive intervention, and is thus an indicator of the maximum efficiency of the intervention. Thus, risk indicators with higher ORs and AFs, and lower ERs and NNTs are likely to have greater value for the prevention of depression. These metrics can be computed for each risk indicator separately, but also for combinations of risk indicators.
To select the best target groups for prevention risk profiles were generated using the significant risk indicators from the complete multivariate model. From these indicators, the most promising risk indicator was selected (with the highest OR and AF, and lowest ER and NNT). This was followed by consecutively selecting and adding risk indicators in such a way that the values for the potential health benefit (OR and AF) were kept as high as possible and the values for effort and cost (ER and NNT) as low as possible.
Statistical analyses
All analyses were controlled for group assignment because active REACH interventions were superior to control conditions for specific sites and subgroups. First, ORs were calculated in a multivariate logistic regression model including all putative risk indicators. Using conventional back-stepping procedures, the smallest set of statistically significant risk indicators was retained (p < 0.05). In both models, a maximum-likelihood estimate of the AF was calculated using Stata's downloadable aflogit procedure for each of the risk indicators under a logistic regression model (Greenland and Drescher, Reference Greenland and Drescher1993). Second, the best target groups for preventive interventions were selected, based on the OR, AF, ER and NNT, calculated in bivariate analyses. The NNT was calculated as the inverse of the risk difference. The risk difference was obtained by regressing the outcome on a risk indicator in a linear probability model, e.g. a generalized linear model with a binomial distribution for its outcome and identity as its link function. Because placement and bereavement of the patient might affect reported depressive symptoms on the CES-D, the analysis was replicated removing the caregivers where the patient either died or was institutionalized during the study. Missing CES-D data points on the follow-up measurements were imputed with the Maximum Likelihood Estimation (MLE) procedure, as implemented by the EM algorithm in SPSS. In order to replace missing values on the CES-D follow-up measurements by their most likely values while also taking into account the mechanism that generated the missing values, statistically significant predictors of the CES-D score and missing values were used in the MLE imputation procedure to obtain the required predicted values. All statistical analyses were performed using SPSS version 15 or Stata version 9 (StataCorp LP, College Station, TX).
Results
Incidence and persistence of depression
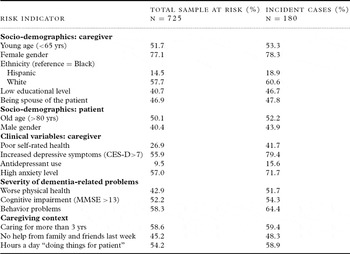
The caregivers at risk for depression who were included in the study sample scored significantly better on most of the baseline variables compared with the excluded caregivers with prevalent clinically depressive symptoms at baseline. The baseline characteristics of the study sample are described in Table 1. Of the 725 caregivers at risk, 180 (24.8%) developed depression during the 18-month follow-up. Fifty-eight cases had high levels of CES-D (≥16) for all following measurement points. Forty caregivers only became a case at the last measurement point. Depression was not persistent in 82 cases.
Baseline characteristics of sample at risk and the incident sample

CES-D = Center for Epidemiologic Studies - Depression scale; MMSE = Mini-Mental State Examination.
Selecting a small set of risk indicators
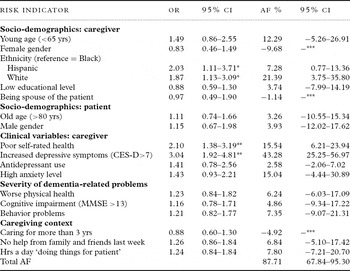
Table 2 shows the complete multivariate model for incident depression, including all 18 putative risk indicators. The total AF of the complete multivariate model was 87.8%. Using conventional back-stepping procedures, the smallest set of significant risk indicators was selected (Table 3). Only four risk indicators were retained in this parsimonious model: increased initial depressive symptoms in the caregiver, poor self-rated health of the caregiver, and Hispanic or white ethnicity/race of the caregiver. Using the selected risk indicators, 72.3% of future cases of clinically relevant depression can be identified (total AF in Table 3). We also calculated the attributive fraction for the two risk factors that are amenable to change (poor self-rated health and increased depressive symptoms) and this resulted in an attributive fraction of 58.72% (95% CI 45.46–68.76). This implies that it is possible to achieve a substantial health gain when using a much smaller set of risk indicators.
Complete multivariate model of the risk indicators for 725 caregivers at risk for developing depression

CI = confidence interval; CES-D = Center for Epidemiologic Studies - Depression scale; MMSE = Mini-Mental State Examination; OR = odds ratio; AF = attributable fraction; NNT = number needed to be treated.
*p<0.05, **p<0.001. ***A confidence interval of a negative AF cannot be computed.
Significant predictors of incident depression from the multivariate model (parsimonious model)

CG = caregiver; ER = exposure rate; OR = odds ratio; CI = confidence interval; AF = attributable fraction; NNT = number needed to be treated.
*p<0.05; **p<0.001.
Selecting risk profiles for indicated prevention
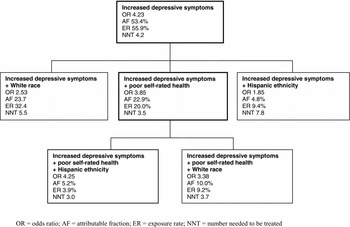
Having “increased initial depressive symptoms” was the strongest predictor of depression onset (Table 3) and was the best candidate to be selected as a starting point for identifying the “best” high-risk group for prevention. Caregivers with slightly increased depressive symptoms are associated with a high risk. The NNT suggests that five caregivers would have to receive an intervention blocking the adverse effect of increased initial depressive symptoms, to avoid depression onset in one caregiver. But this group is still large (56% of the caregivers) and prevention might be difficult to deliver. Next, three risk indicators can be added to the risk profile (Figure 1). Poor self-rated health was the best candidate to be added. This step reduced the OR and the AF, but the exposure rate declined which means a considerably smaller group would need to be targeted. When adding ethnicity/race as a third risk indicator to the risk profile a much smaller group would have to be targeted. The OR increased, but the AF has dropped significantly while the NNT remained more or less the same.
Selecting high-risk groups for depression prevention.

Model without caregivers where the patient died or was institutionalized
During the study period, 135 (18.6%) patients were institutionalized, 78 (10.8%) died and 38 (5.2%) died after placement. A separate analysis was carried out using only caregivers where the patient survived and lived at home during the entire study period. The model based on the smallest subset of statistically significant risk indicators (at p<0.05) only consisted of the risk indicators “increased depressive symptoms” (OR = 3.67, p = 0.000, 95% CI 2.16–6.22) and “poor self-rated health” (OR = 1.87, p = 0.011, 95% CI 1.15–3.05). The total AF of this model was 58.04% (95% CI 39.84–70.74). Caregiver race/ethnicity was no longer a significant independent predictor of incident depression (for Hispanic ethnicity: OR = 1.98, p = 0.070, 95% CI 0.95–4.13 and for White race: OR = 1.55, p = 0.185, 95% CI 0.81–2.99)
Discussion
In this study we tried to identify the high risk groups of dementia caregivers in which prevention is likely to generate substantial health gains for the least effort and hence for the lowest costs. We used an innovative method to determine which persons are at risk for developing depression, the condition that was the focus of this study.
Main findings
Results suggested that targeting people with some signs or symptoms but no disorder (indicated prevention) is the most effective strategy to prevent the onset or development of a full-blown disorder and may thus offer a good starting point for preventive efforts.
A recent meta-analysis demonstrated that prevention programs are actually capable of reducing the incidence of depression in different target populations and settings (Cuijpers et al., Reference Cuijpers, van, Smit, Mihalopoulos and Beekman2008a). Indicated prevention could become more specific and cost-effective by expanding the risk profile with other risk indicators. Beyond an increased level of depressive symptoms, we found poor self-rated health as a strong predictor of incident depression in the caregiver. Finally, there were race-ethnic differences in the risk. However, race/ethnicity was no longer a significant predictor when analyzing the sample without the caregivers whose patient was placed in an institution or died. Therefore, it appears that the race/ethnicity factor is not a predictor for depression unless the patient is institutionalized or deceased. A reason for race/ethnic differences in placement might be attributed to cultural norms regarding family care. It would be worth exploring in future studies how various ethnic caregivers deal with such events and how this relates to the development of depression.
When targeting the caregivers with the first two indicators the attributable fraction was 22.9%. When targeting only the caregivers with the strongest single risk factor (increased initial depressive symptoms) the incidence of depression could even have been halved. On the other hand, the target group would then have to increase from 20% to almost 56%. We emphasize that these estimates are upper limits and will only be reached if an intervention is completely effective, which is not realistic.
Placing our findings in the context of the literature
Depressive symptoms on self-report scales are short-term predictors of major depressive episodes (Cuijpers and Smit, Reference Cuijpers and Smit2004). Poor self-rated health has also been reported to be a good predictor (Beekman et al., Reference Beekman, Deeg, van Tilburg, Smit, Hooijer and van Tilburg1995; Cole and Dendukuri, Reference Cole and Dendukuri2003). The risk indicators we identified are well known in the existing depression literature. We had expected that risk factors reflecting the contextual distress of the caregivers would have played a much larger role in the development of depression. However, we did not find a significant contribution of patient-related indicators and indicators related to the specific caregiving context to the onset of depression in the caregivers. This may suggest that depression in caregivers is not necessarily a contextual problem but that the same causal pathways as in other populations may be involved.
Strengths and limitations
Our study has several strengths. It is the first study to apply this methodological approach of identifying risk indicators for prevention and goes much further than the conventional risk factor studies. Statistics were used to quantify potential health benefits and the efforts required to generate these benefits. The risk profiles also give guidance on the type of intervention that needs to be offered to the intended target group. The use of a large sample size and long follow-up period should be regarded as the other strengths of the study.
Our study also has some limitations. First, the US caregivers included in this study may not be representative of the total population of caregivers of dementia patients. They were already caring for persons with relatively severe dementia. In addition, subjects were willing to participate in a trial to test psychosocial interventions and so might have been help-seeking and at a higher risk of developing depression. On the other hand, they may represent persons willing to accept a preventive intervention. Secondly, we could examine only a selection of relevant risk indicators. For example, we lacked information on history of depression, an important predictor of new episodes. Also some other risk factors already found to be related with depression, such as personality of the caregiver and dysfunctional coping style, were not included in this study (Clark and Diamond, Reference Clark and Diamond2010). Finally, we used the CES-D to measure depression, which has good psychometric properties but is not a diagnostic instrument.
Implications and conclusions
With the methodology we employed, we were able to select a very small set of risk indicators to identify groups at high risk for the onset of depression. Instead of measuring a variety of variables, the use of a simple checklist of the relevant risk indicators (depressive symptoms, self-rated health and ethnicity of the caregiver) will be required to recognize the subgroups in which preventive efforts should be made. The two strongest risk indicators we found can be measured relatively quickly with the help of short self-rated scales. Use of this strategy is feasible, might yield substantial health gains, and hence might prove to be cost-effective.
Conflict of interest
None.
Description of authors’ roles
KJ, FS, HM and HH formulated the research questions and designed the study. RS supervised the data collection. FS was responsible for the statistical design of the data. KJ carried out the statistical analysis and wrote the paper. All authors assisted with writing the paper and approved the final version.
Acknowledgments
This research was supported through the Resources for Enhancing Alzheimer's Caregiver Health (REACH) project, which is supported by the National Institute on Aging and the National Institute of Nursing Research (Grants U01-NR13269, U01-AG13313, U01-AG13297, U01-AG13289, U01-AG13265, U01-AG13255 and AG13305). The National Institute on Aging and the National Institute of Nursing Research had no further role in the study design, in the collection, analysis and interpretation of the data, in the writing of the report, and in the decision to submit the paper for publication.