Gender inequality is a major problem in the Arab world. The Middle East ranks at the bottom of regional comparisons with regard to female labor participation rates, financial independence, Footnote 1 and civil rights and political participation. Footnote 2 The causes are disputable, but the impacts are undeniable. The first Arab Human Development Report (AHDR), published in 2002, argued that the lack of women’s rights, along with constrained political freedom and poor education, explain the region’s stunted political and economic development. Footnote 3 Government officials, activists, donor communities, and scholars continue to voice similar concerns, warning that gender inequality violates fundamental human rights, thwarts development, and fosters instability. Footnote 4
And the problem threatens to worsen. Even as some celebrated the downfall of long-standing dictators after 2011, many raised concerns that women’s rights would suffer setbacks in political transitions. They feared that authoritarian elites, who had often used women’s rights to gain international approval even as they trampled on public opinion, would no longer hold patriarchal views and practices in check. A UN Women report put it succinctly: “The biggest challenge currently experienced by the region is that the so-called Arab Spring does not mutate into [a] ‘winter storm’ or ‘hurricane with the highest degree of the scale’ … [with] regard to Democracy and Peace and for women.” Footnote 5 So too, activists and elites across the political spectrum in Tunisia and Egypt expressed concerns about the future of women’s rights. Footnote 6
A particular fear was that free and fair elections would bring to power misogynist leaders and regimes. Given widespread gender stereotypes, it seemed unlikely that women would fare well at the polls. At the same time, many viewed Islamists as forces against women’s advancement and saw their electoral success as nearly inevitable. Footnote 7 A 2005 AHDR report noted that “no serious political power in the Arab world can ignore the fact that religion, particularly Islam, is an essential wellspring of the cultural and spiritual life of the Arab people. Any force that ever engaged in Arab politics that neglected that lesson ended up as either marginal or defunct, whatever temporary success it enjoyed.” Footnote 8 And after 2011, many concurred with observers like Bill Schneider, who argued with regard to Egypt that “a majority of its voters are religious and, given a chance to compete in free elections, they will elect an Islamist government.” Footnote 9
In essence, the concern was that biases regarding gender and religiosity would drive voters’ behaviors. The influence of bias in elections is neither new nor unique to the Arab world. Bias against women in politics is nearly universal. One Algerian female candidate put it bluntly when she argued that “people won’t vote for a woman,” Footnote 10 and even in the US, Europe, and elsewhere, the fact that a candidate is a woman is notable (witness the debate over Hillary Clinton’s potential presidential candidacy). So too, voters appear to have biases regarding religiosity and electability. The nature of this bias is more debatable. Even in the West, an appearance of religious piety is often equated with honest leadership. However, where secularism and statesmanship have been linked, and where it is imagined that global integration necessitates secular-appearing leaders, there may be biases against ultra-conservative religious candidates. A Tunisian woman noted that Rachid Ghannouchi, founder of the ruling Islamist party EnNahda, looked more the European intellectual than the bearded sheikh; a more conservative style would not appear “statesman-like.” Equally, it is difficult to imagine candidates in overtly religious attire faring well in Western elections.
Such biases are readily apparent, but the mechanisms underlying these biases remain opaque. The dominant view is that political culture, shaped particularly by oil or Islam, explains these biases. These explanations are based in modernization theory. Generally, modernization theory argues that the rural, less educated, more religious, and traditionally employed (e.g., agriculture, handworks) are more likely to oppose women’s political engagement, while those who are urban, educated, and employed in “modern” sectors should support female candidates. Footnote 11 Regarding the Middle East, some have argued that the issue is not the level of urbanization or education, but the mode of production. As Ross, a major proponent of this perspective, argues, “oil production reduces the number of women in the labor force, which in turn reduces their political influence. As a result, oil-producing states are left with atypically strong patriarchal norms, laws, and political institutions.” Footnote 12 Those who focus on Islam do so from a perspective that links religiosity and gender biases, arguing that religious individuals—whether Christians in the US and Germany or Muslims in the Middle East—are more likely to support gender inequality. Footnote 13 And among religions, Islam is viewed as particularly patriarchal. Indeed, Ronald Inglehart and Pippa Norris (2003a, b) maintain that “Islamic religious heritage is one of the most powerful barriers to the rising tide of gender equality.” Footnote 14 Helen Rizzo, Abdel-Hamid Abdel-Latif, and Katherine Meyer Footnote 15 and Michele Angrist Footnote 16 do not entirely disagree, although they argue that the role of Islam varies between non-Arab and Arab societies, with individuals in Arab Muslim societies exhibiting lower levels of support for women’s rights.
We contend that such arguments treat the region as exceptional and, more importantly, do not encourage us to recognize a more general theory of electoral bias that accounts for political bias in the US, Tunisia, and elsewhere. The mechanism underlying the electability of candidates, and attendant biases based on gender and religiosity, is best understood through a new perspective drawn from role congruity theory in social psychology. Role congruity theory was developed as a result of work uncovering the “wonderful women effect,” which noted that while women were seen as extremely capable in arenas such as child rearing and hosting, and in fact, often viewed as superior to men with regards to traits such as honesty and kindness, they were not seen as having qualities associated with effective leadership (e.g., decisiveness, strength). Attributing different stereotypical traits to men and women, based on gender roles stemming from sex differentiation in the labor force, combined with established notions of a “good leader,” leads observers to undervalue women as potential and actual leaders. Footnote 17
Adapted to electoral behavior, the theory suggests that bias stems from a mismatch between stereotyped traits of a candidate and beliefs about what makes a good leader. The extent to which voters view gender or religiosity as signaling capable leadership depends largely on preconceptions about characteristics of good leaders; these preconceptions, in turn, are based on individuals’ and societies’ past experiences. Potential voters are more likely to view women or religious individuals as effective leaders in societies where such individuals have held these positions in the past. Among citizens in these societies, those who explicitly view these leaders as capable are less likely to exhibit political bias.
The theory has wide applicability, but we examine it here through a survey experiment implemented in Tunisia following the 2011 transitional elections. The experiment, described in more detail later, presented respondents with photographs of potential candidates (male and female, apparently religious or non-religious) and asked how likely they would be to vote for them. This approach offers a novel tool that complements and extends existing approaches by indirectly tapping into biases that might not be readily expressed in surveys or interviews due to social desirability. By examining the extent to which different subgroups within the population exhibit biases based on gender or religion, we are able to test competing hypotheses regarding the mechanisms underlying political bias.
Tunisia’s social composition and political history make it well suited for testing competing hypotheses drawn from modernization and role congruity theories. A middle-income, predominantly Muslim country with 11 million citizens, a per capita GDP of $9,900, and a literacy rate of 72 percent, Tunisia has a population with significant socio-economic variation that allows us to test expectations from modernization theory. There is also variation in religious observance and attitudes and, to some extent, a secular-religious divide, Footnote 18 offering useful conditions for testing modernization and social identity theories. Additionally, Tunisia’s history of leadership—explicitly secular and predominantly male—leads to fairly well established expectations about the relationships between gender, religiosity, and leadership that aid in testing role congruity theory. Finally, Tunisia’s transition helps to isolate the impact of political bias on election preference from other strategic considerations. Examining Tunisian attitudes in the transitional period, when voters have high uncertainty and voters’ ability to engage in strategic voting is diminished, leaves us with a clearer understanding of individuals’ assessments of candidates without strategic considerations.
While Tunisia is a useful case in which to explore the mechanisms underlying political bias, the findings have broader implications, shedding light on political bias at three levels. First, and most immediately, the results help us understand biases regarding gender and religion in Tunisia. The individual-level biases will affect candidate assessment beyond the immediate transitional period, although the impact of these biases may change in the post-transitional period, since voters’ decisions to support a candidate are based on assessments of individual candidates (based on role congruity) and on strategic voting. Second, the findings regarding religion and gender biases extend beyond Tunisia and can be generalized to countries where gender and religion (whether in regard to religiosity or adherence to different religions) are viewed as reflecting leadership capabilities. This is a wide scope of countries, including much of the West. The features that signal “religiosity” may vary, but the issue is not what factors signal religion, but whether these are salient and how they affect voters’ choices. Finally, ultimately the argument is not simply about gender and religion, but also about stereotypes of individuals’ traits and leadership capacity. We expect similar effects with regard to factors such as race and ethnicity, regional biases, or even linguistic or physical characteristics. The important points are two-fold: first, that these biases are independent of education, class, income, and other features that are associated with modernization; and second, that they are associated directly with leadership and are not general biases against these individuals in other realms of life.
Identifying role congruency as the mechanism underlying electoral biases prompts political scientists to rethink prevailing assumptions about these biases. It is not negative traits of women, minorities, or other groups that drive these biases, but rather the gap between stereotyped traits of these groups and the traits associated with capable leaders. In the US, for example, many may view those from the South as kinder and more socially well-heeled than those from the North, but they do not necessarily see them as having effective leadership traits. To understand political bias, we need to know what demographic groups are stereotyped as having different traits and how these map onto expectations regarding leadership. These traits may differ across countries and vary over time, but the mechanism that drives biases and electability remains the same.
Indeed, the findings from our study show how incongruities lead to underrepresentation of women across a broad range of cases and regions, and also how incongruities may drive political biases based on other traits. The study contributes a new theoretical framework for the cross-regional study of women, religion, and politics. Substantial literature regarding women and politics in the US highlights the role of trait, Footnote 19 competency, Footnote 20 and issue Footnote 21 stereotypes in explaining why so few women attain elected higher office. Footnote 22 Such attitudes toward gender roles have been found to affect the electability of women in US state elections, Footnote 23 Senate races, Footnote 24 and potential presidential races. Footnote 25 But this literature does not explicitly draw on role congruity theory, which emphasizes the mismatch between these stereotyped traits and traits of good leaders. Moreover, too little is understood regarding the intersection of different traits. Footnote 26 Our study suggests that the interactions of traits are likely to have different effects than traits considered independently. Footnote 27 It also gives us a framework by which we can understand when and why overtly religious candidates and those from minority groups or other distinct populations (e.g., based on ethnicity, tribe, or even physical traits) fare better or worse in political competition.
The study prompts us to rethink explanations for women’s disempowerment in the Arab world. As discussed above, existing literature focuses narrowly on the often-polemical debate between Islam and structural conditions, such as oil and economic modernization. Footnote 28 This debate not only views the Arab world as exceptional, but it also sees unalterable conditions as the foundation of gender bias in the region.
In contrast, recognizing the more general mechanisms of role congruity theory that underpin gender bias in the Arab world points to potentially powerful policy interventions. There are two ways to reduce political bias against disadvantaged groups: first, by altering views of traits held by women, minorities, religious, or other groups; and second, by expanding views of traits associated with effective leaders. The theory suggests that policymakers should be encouraged to establish institutions that help assure representation of women, religious minorities, or others. Quotas and other policies that bring women and minorities into the public sphere can reshape stereotypes of women and religious candidates as leaders, while fostering more diverse conceptualizations of effective leadership, independently of social or economic changes associated with modernization. Footnote 29 Similarly, greater turnover in leadership and, potentially, diverse leadership styles may foster appreciation of a wider range of leadership styles and skills. Quotas play a role in this regard, but so do political transitions. Indeed, unprecedented political turnover in countries undergoing transition provides an opportunity for citizens to experience and recognize a wider range of leadership styles, potentially expanding notions of traits associated with political leadership.
We next consider how role congruity theory can be distinguished from and tested against modernization and social identity theories. Since these theories operate at both the population and individual levels, our empirical approach will take into account both levels as well. The following section uses an experiment embedded in an original, nationally-representative survey of 1,202 Tunisians conducted in October–November 2012 to test hypotheses derived from the competing theories at the population level. The third section examines the underlying mechanisms in more detail at the individual level—highlighting the potency of role congruity theory in explaining electoral biases. We conclude by exploring the theoretical and policy implications of our findings. We argue that it is important when designing policy solutions to understand not only the stereotypes that citizens hold about members of underrepresented groups, but also the beliefs that citizens hold about characteristics associated with good leaders. Institutional mechanisms, such as gender quotas, that increase the representation of previously excluded groups may be useful because they can shift both perceptions of excluded groups and the requirements of leadership. When citizens have more expansive notions of leadership qualities, they may be willing to vote for women, minorities, or other groups targeted by these institutions and may also entertain supporting other non-traditional candidates as well.
Role Congruity against Competing Theories
Role congruity theory yields a number of unique hypotheses that can be used to test it against competing theories. For instance, because electoral bias depends on the extent to which voters view a group’s characteristics as consistent with perceived leadership qualities, voters who take a more expansive view of gender roles (e.g., believing that women’s competence extends beyond nurturing), and those who envision leadership more broadly (e.g., appreciating a range of leadership styles), are less likely to exhibit gender bias. The same can be said of religiosity; those who see religious individuals as having traits consistent with capable leadership or who view leadership more expansively are likely to support apparently religious candidates. Moreover, research on role congruity theory, more generally, has found some factors that tend to influence the extent of role incongruity: men are more likely to hold incongruent beliefs toward gender and leadership, and those who have experienced female political representation are less likely to see these roles as incongruent. Footnote 30 As we shall see later, these expectations differ significantly from those derived from modernization theory, which dominates studies of election bias in non-Western contexts, or social identity theory, a less prevalent but also influential theory that argues that individuals tend to classify themselves into in-groups and out-groups, with people favoring members of their in-group. Footnote 31
To test role congruity theory, we need a clear understanding of the stereotypes of social groups as well as the qualities associated with effective leadership. Some stereotypes are widespread, such as biases based on gender or age. Yet, the extent of these biases, as well as perceptions of other social groups and traits associated with leadership, vary across social groups, countries, and time, and are shaped by historical experiences.
Tunisia’s historical experiences shaped stereotypes regarding group qualities and leadership traits. Tunisia’s two presidents, Habib Bourguiba and Zine Al Abidine Ben Ali, promoted gender equality. Immediately upon coming to power in 1956, founding president Bourguiba pushed for enactment of the Code of Personal Status, abolishing polygamy and unilateral divorce (repudiation), granting divorce to women, and setting a minimum age for marriage. Footnote 32 Since the 1970s, women increased their presence in politics at the local, regional, and national levels, Footnote 33 and under Ben Ali, the ruling party established a voluntary gender quota. Footnote 34 By 1999, women held 12 percent of parliamentary seats, increasing to 19 percent in 2004, and 28 percent in 2009.
Bourguiba and Ben Ali also took aggressive steps to establish laïcité (secularism). Bourguiba repressed those with religious leanings: he banned women from wearing the veil in public and discouraged companies from hiring Islamists. He deemed Ramadan bad for the economy, encouraged businesses to remain open, and drank alcohol on television during the holy month. Ben Ali followed much the same path, issuing Law No. 102, which considered the hijab a sign of “extremism,” banned men from wearing beards, and closed religious institutions. Political power was unambiguously tied to secularism. Footnote 35
State policies thus fostered beliefs about the relationship between gender, religiosity, and leadership that are useful for our study. The gender project narrowed the gap between men and women, but men still dominated the political elite and were likely viewed as more competent and capable leaders. That women comprised only 27 percent of the Constituent Assembly, despite the zipper system established before the 2011 elections, suggests that role incongruence may affect their chances at the polls. Footnote 36 Thus, stereotypes about gender, religiosity, and leadership provide a basis for examining role congruency theory, while the religious-secular divide allows us to consider social identity theory, exploring the possibility that in-group/out-group bias affects how candidate gender and religiosity mediate electability.
Survey Experiment
We assess the impact of candidate gender and religiosity on voter preferences through a survey experiment embedded the Tunisian Post-Election Survey (TPES). The TPES is a nationally representative, face-to-face, household survey of 1,202 Tunisians, 18 years and older. Footnote 37 It was implemented October 7–November 13, 2012 and took approximately 40 minutes to complete. An interviewer training program and five field supervisors ensured high quality data collection. The minimum response rate was 56 percent, calculated using cover page records. Footnote 38 The survey was fielded a year after the October 23, 2011 Constituent Assembly elections—prompted by protests and the departure of Ben Ali—but before the constitution was ratified or a date set for new parliamentary elections. The general feeling at the time of the survey was impatience and uncertainty, amidst concerns about the slow pace of constitution-drafting and growing economic problems.
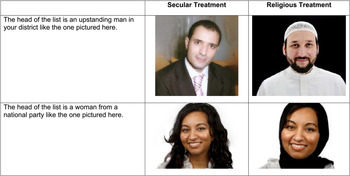
In the experiment, all respondents were shown photographs of potential candidates and asked, “Please tell me how likely you would be to vote for a candidate or list like this in the future. Would you definitely not vote for (1), probably not vote for (2), probably vote for (3), or definitely vote for (4) the following?” as shown in figure 1. Half of the respondents received the secular treatment—first a secular-appearing man then woman—and the other half received the religious treatment—first a male wearing an Islamic cap then the female wearing a headscarf. Footnote 39 Candidate dress was chosen to signal religiosity. Footnote 40 Religiosity is a complex, non-dichotomous concept, and certainly the veil does not have a single meaning for all women; Footnote 41 however, since the 1980s, the headscarf has been a marker of identification with revivalist Islamic piety movements. Footnote 42 Thus, we expect that manipulating dress is a valid method for signaling religiosity. Indeed, this methodological approach offers a novel tool that complements and extends existing approaches by indirectly tapping into biases that might not be readily expressed in surveys or interviews due to social desirability concerns. Footnote 43
Questions and photos in the survey experiment

We carefully selected the photos and crafted the question wording taking into consideration issues of internal validity, priming, and contamination. We chose males and females of similar age, attractiveness, and “believability” as a candidate to ensure that comparisons are not confounded. We used a different man in treatment 1 (secular) and treatment 2 (religious) because numerous attempts to adapt the religious appearance of the male rendered the photo obviously “photo shopped,” and we could not ask a male volunteer to change from religious to secular (i.e., shaving his beard) due to the cultural importance of facial hair. Accordingly, we used photos of two males of similar age and apparent social class, one secular and one overtly religious. Footnote 44
Gender, Religiosity and Electability
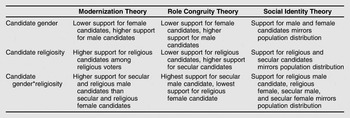
The three theories provide different expectations regarding gender and electability. Modernization theory predicts lower support for female candidates due to the relatively low level of socioeconomic development in Tunisia. It also expects higher support for religious candidates among those who are more religious. Footnote 45 In contrast, role congruity theory predicts biases against females, but that female secularists may be viewed more positively, given Tunisia’s long history of laïcité. Social identity theory suggests that support for candidates reflect divisions in the population; secularist women should vote for secularist women, religious men for religious men, etc.
Importantly, extant theories do not offer clear expectations about the intersection of candidate identities. One possible expectation, examined here, is that identities are simply additive; that is, modernization theory would predict more support for religious candidates than secular candidates; role congruity theory would predict religious females to be least electable and secular males most electable; and, social identity theory would expect that support for candidates would reflect the relative size of their groups in the population. Population-level expectations based on these theories are summarized in table 1.
Population-level expectations from competing theories

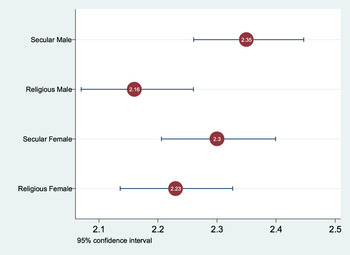
The survey experiment finds support for role congruity theory, which predicts that the candidate who looks most like previous leaders—the secular male—will be most electable. As shown in figure 2, respondents appear to prefer the secular male to other candidates; the mean level of support for the secular male is 2.35, which is a small but statistically significant preference over the secular female, at 2.30. Both secular candidates are preferred over the religious female at 2.23 and religious male, who receives the least support at 2.16. The mode is 3 (“probably would vote for”) for the secular male and 1 (“definitely would not vote for”) for other candidates. This lends support to role congruity theory and runs counter to expectations from modernization theory. Yet, the fact that the religious female is evaluated more highly than the religious male presents a puzzling finding that merits further investigation.
Support by candidate gender and religious dress
Note: Given 95 percent confidence intervals, mean support for the secular male is 2.26–2.44, compared to 2.07–2.26 for the religious male, a statistically significant difference. Support for the secular female is 2.21–2.34 and for the religious female, 2.14–2.33, indicating no significant difference in popularity.

Demographic Differences and the Relationship between Gender, Religion and Electability
We further analyze these theories by exploring predictions regarding the support that different demographic groups exhibit for the candidates. Modernization theory suggests that education, urbanization, less religiosity, and rising incomes weaken traditional patriarchal views and thus should increase support for female candidates. Conversely, less education, less urbanization, more religiosity, and lower incomes should increase support for male and religious candidates.
Role congruity and social identity theories do not predict that biases are related to education, urban residence, and class, but rather predict that men and women assess candidates differently. Role congruity theory suggests that men are more likely to view women as unfit for leadership roles, Footnote 46 and thus less likely to support female candidates than women are; however, men and women are equally likely to support outwardly religious candidates. Social identity theory predicts that Tunisians will support candidates of their own “in-group” (e.g., religious women support religious women, secular women support secular women). Footnote 47
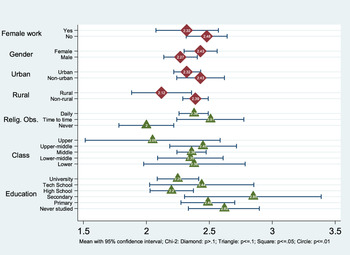
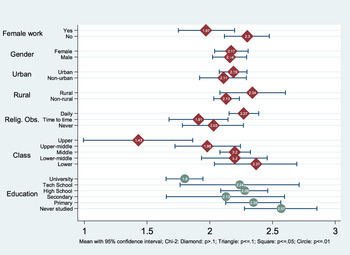
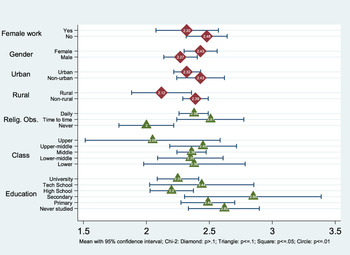
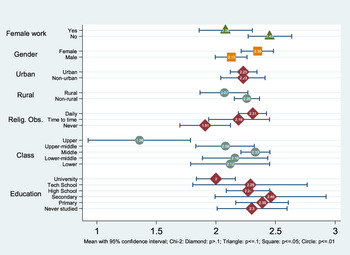
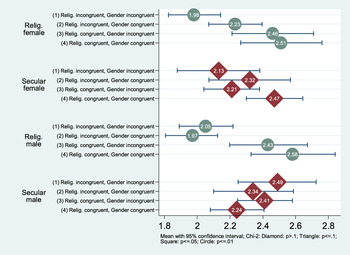
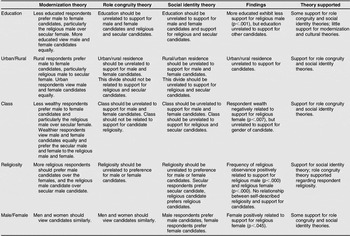
Our initial analysis finds support for role congruity and social identity theories, but not for modernization theory. As shown in figures (3a–3d) education is not significantly related to support for male or female candidates, although more educated individuals are less likely to support religious males (p<.001). Similarly, class is also not related to gender bias, although upper classes are less likely to prefer religious females (p<.007). While modernization would expect that the upper class to be more resistant toward religious candidates, this same class should be more hospitable to women. It is not. Urban residence was not related to support for any candidate. Society does not appear to change inevitably towards gender equality as populations become urbanized, wealthier, and more educated.
Support for secular males by subgroup

Support for religious males by subgroup

Support for secular females by subgroup

Support for religious females by subgroup
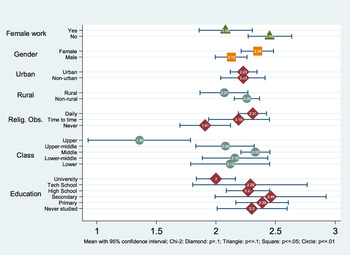
Further, religiosity does not affect gender bias, although there is some evidence that it is related to attitudes toward apparently religious candidates. Examining a scale of self-described religiosity, we find no significant gender bias, but rather that more religious respondents favor religious over secular males (p<.000), and religious over secular women (p<.000). Women favor the religious females (p<.045), although men and women did not differ in their support of the other candidates. Taken together, these findings offer some support for role congruity and social identity theories.
The results from figures 3a–3d are summarized in table 2. No theory receives support across all tests of demographic subgroups among Tunisians and, with regard to religiosity, the findings reveal the importance (and difficulties) of measurement choices. Yet the findings suggest that role congruity and social identity theories drawn from social psychology are more powerful than the modernization-based theories that have pervaded political science.
Support for candidates by religious and gender role congruity

Hypotheses and findings by respondent demographic group

Role Congruity, Social Identity and Individuals’ Attitudes toward Gender, Religion and Electability
Given the support for role congruity and social identity theories found here, we now turn to adjudicating between them by focusing on individual attitudes and election bias. Role congruity theory suggests that individuals’ beliefs about group characteristics and leadership traits are key to understanding electoral bias; individuals who hold flexible beliefs about gender roles (e.g., regarding work outside the home as equally important for females as males) or more expansive views of leadership (e.g., holding a diverse conception of leadership styles and traits) should be more likely to support women and religious candidates. Social identity theory also posits that voters will tend to hold biases against members of their out-group, with women more likely to vote for women, and men for men, secular individuals more likely to vote for secular candidates, and religious ones for religious candidates.
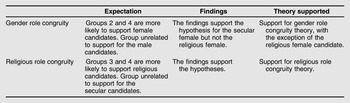
Role Congruity Theory. As shown in table 3, role congruity theory yields three hypotheses. First, it suggests that the gender gap is smaller when voters hold congruent views toward female characteristics and leader roles. Second, it suggests similarly that the gap between secular and religious candidates is smaller when voters hold congruent views toward religiosity and leadership. Third, because of his similarity to Tunisian leaders, the popularity of the secular male will not depend on views about gender and leadership or religion and leadership. To test these hypotheses, we divide respondents into four group: 1) religious incongruent/gender incongruent, 2) religious incongruent/gender congruent, 3) religious congruent/gender incongruent, and 4) religious congruent/gender congruent. Expectations regarding these potential voters are outlined in table 3.
Role congruence: Hypotheses and findings

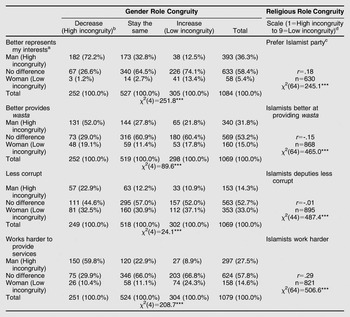
Traits and competencies of candidates by level of gender and religious role congruity

Gender role congruity (TPES 2012):
a In general, would you have more confidence in a man or a woman to represent your interests in Parliament or would you say there is no difference? In general, would you say that male or female deputies are better able to provide wasta or would you say there is no difference? In general, would you say that male or female deputies are less likely to be involved in corruption or would you say there is no difference? In general, would you say that male or female deputies work harder to provide services and represent citizens, or would you say there is no difference?
b As you may know, there are presently 58 women elected to the Constituent Assembly (27% of seats). In your opinion, would it be best if this level were to decrease, increase, or stay about the same? Religious role congruity (UNDEF/TPES 2014):
c What type of party do you prefer, where 1 is prefer a party that seeks to have a strong role for religion in the politics and 9 is prefer a party that keeps religion and politics separate. Islamist deputies are better able than others to provide wasta to me. Islamist parliamentarians are less corrupt than other parliamentarians? Islamist parliamentarians do not work harder than any other deputies.
d Religious leaders should have no influence over the decisions of the government.
To measure the attitudes about gender roles and leadership traits, we ask “As you may know, there are presently 58 women elected to the Chamber of Deputies (27 percent of seats). In your opinion, would it be best if this level were to decrease (23 percent), increase (28 percent), or stay the same (46 percent)?” For the analysis shown in figure 4, we dichotomize respondents: those who say that the number should decrease (23 percent) and those who say it should stay the same or increase (77 percent). We also created a scale of more congruent gender and leader roles by combining the non-missing mean of responses to six highly-correlated indicators (refer to the Appendix), which we use in the multivariate analysis to establish the robustness of our results. Footnote 48
To measure role congruity regarding religion, we use the following measure: “Religious leaders should not influence government: strongly agree (47 percent), agree (26 percent), disagree (19 percent), strongly disagree (9 percent).” We dichotomize this into strongly agree/agree (73 percent) and disagree/strongly disagree (28 percent). This measure serves as proxy for the degree to which citizens believe religious candidates are suitable to serve in public office.
Table 4 shows the stereotypes about gender and religiosity in conjunction with leadership traits. Consistent with role congruity theory, women are seen as less corrupt than men, but stereotyped as less likely to have policy positions (i.e., whether women or men reflect one’s interests), competencies (i.e., whether they can provide clientelistic benefits), and traits (i.e., whether they are corrupt and hard-working) for effective leadership. Footnote 49 Fourteen percent of Tunisians see men as less corrupt, while 33 percent think women are less corrupt. Respondents who see men as more corrupt are also more likely to see women and leadership as congruent (p<.001).
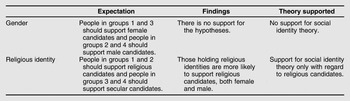
Social identity: Hypotheses and findings

Support for candidates by social identity

The same is true of other issues, competencies, and traits. Thirty-six percent of Tunisians believe a man would better represent their interests, compared to 5 percent who believe a woman would do so. Respondents who see women as working harder than men are more likely to see women and leadership as congruent (p<.001). However, this pattern holds less well for clientelism. Thirty-two and fifteen percent, respectively, see men and women as better at providing wasta (personal connections or influence to achieve goals or solve problems). Although men were systematically seen as better at providing wasta, women’s ability to provide wasta does not predict role congruity.
Assumptions about religious candidates and religious role congruity were measured on a nine-point scale in a 2014 poll conducted by the same research team using identical sampling and methodology. Those who see Islamist parties as matching their policy positions (r=.18) and those who regard Islamist deputies as working harder than others (r=.29) are more likely to see religious candidates as congruent with leadership. However, those who see Islamist deputies as better at providing wasta (r=-.15) or more corrupt (r=-.01) are less likely espouse a high degree of religious role congruity.
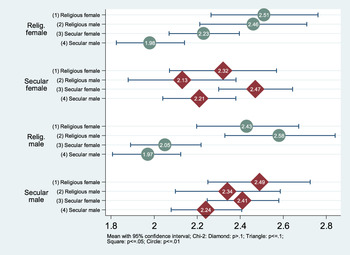
In tests of competing explanations for voter bias, congruent roles regarding gender lead to less bias against female candidates, but only secular females (p<.009), while those who view religious leaders as effective leaders, support religious candidates (p<.001 for the religious male and p<.029 for the religious female). Moreover, as shown in Figure 4, support for the religious female is higher, on average, among supporters of religious leaders, regardless of whether they think gender equality is desirable. This is important. Whereas the secular female draws support from those who hold congruent roles and support gender equality, the religious female draws support from those who believe religiosity and leadership are congruent, regardless of their views on gender. This perhaps indicates that religion has far more influence on candidate electability than gender.
The candidate who best represents the status quo is able to draw support from all groups. Secular males receive support from almost all groups, including those who see leadership and religion as congruent, as well as from those who see women and leadership as consistent. The secular male candidate draws support from all groups and differs from religious male and female candidates, who enjoy significant levels of support mostly from groups that hold congruent views on gender, religiosity, and leadership. Further, the secular male enjoys generally higher levels of support from all groups than does the secular female. Even when these results are disaggregated across male and female respondents, the same patterns of support hold.
Social Identity Theory. As shown in table 2, social identity theory yields the following hypotheses: respondents are more likely to support candidates of the same gender, while respondents’ secular/religious identity shapes support for secular/religious candidates. Finally, the interaction of religiosity and gender should yield similar results, for example, with female religious respondents supporting female religious candidates, and male secular respondents supporting male secular candidates. To test these hypotheses, we divide respondents into four groups: 1) religious female, 2) religious male, 3) secular female, and 4) secular male (refer to table 5). To measure religious identity, we dichotomize respondents by their frequency of religious observance, with 1 (“Rarely”) to 3 coded as secular and 4 and 5 (“Frequently”) coded as religious.
Gender identity does not influence support for candidates. Male candidates are no more likely to support male candidates, and female candidates are no more likely to support female candidates. Nor is there an interaction between religious and gender identity and support for the candidates. Religious female respondents are no more or less likely to support female candidates than religious males; secular female respondents are no more likely to support secular females than secular males.
The secular-religious divide is more significant than gender identity in shaping support for candidates. Importantly, however, religious identity is a strong predictor of support for religious candidates, but not secular ones. Religious males and females are more likely to support both the religious male (p<.000) and the religious female (p<.002). However, identity does not impact support for secular male or female candidates. Once again, the status-quo oriented secular male is able to draw support from all groups. (See Figure 5)
Fostering Equal Representation: Implications for Tunisia, Transitions and Beyond
The survey experiment in transitional Tunisia lends strong support for the role congruity theory of electability. Few of the factors associated with modernization theory—education level, class, urban residence, or religiosity—predict support for candidates, and social identity theory only predicted voting for religious candidates. Rather, voters’ perceptions regarding the congruence between group characteristics and leadership are the most powerful predictors of attitudes toward potential candidates. When voters go to the polls, they are likely to cast their ballot for a candidate who “looks like a leader.” They do not simply vote for someone who is “one of them”; indeed, women and men were not more prone to prefer a candidate of their gender. Nor are they necessarily determined to elect someone whose policies they prefer, although religious candidates drew support from those who saw a role of religious leaders in politics. Instead, individuals across the board (e.g., men and women, religious and secular, “feminist” or not), sought to elect someone who appeared like leaders of the past.
The notion of a leader appears to be based on past experience. In Tunisia, more than a half-century of laïcité (or secularism) and male political leaders gave rise to a dominant understanding of political leadership as secular and male. Not surprisingly, then, it was the secular-appearing male who fared best in the survey. He was able to draw support from all groups, including men and women holding very different positions with regard to the role of religion and women in politics more likely to vote for him. And, where bias emerged, it stemmed from the candidate having underrepresented traits (e.g., female or religious) and the respondent seeing this trait or traits as incongruent with leadership.
These findings are important. At a time when Tunisia is undergoing transition, they provide a baseline for understanding political bias and a path forward. Notions established about leadership characteristics are not easily changed, and they continue to impact voters long after the regime declines.
By understanding the importance of role congruity, we can have a better understanding of likely political outcomes. This has important implications for understanding elections in Tunisia today. Owing to their ascriptive similarity with most political leaders in Tunisian history, secular males are the most electable precisely because they are not subject to systematic biases. The secular male candidate draws support equally from all groups of respondents, regardless of whether the respondents are grouped according to attitudes toward gender, religion, and leadership underpinning role congruity, or according to gender and religiosity, which underlie social identity. At the same time, female candidates can overcome biases at the polls, but given the importance of religiosity in driving some voters’ choices, it may be easier for religious females to overcome the effects of biases at the polls. Religious females may draw support from some voters based on their religiosity, even if the voters personally do not espouse gender equality. Secular-appearing females must rely to a greater extent on changes in gender stereotypes to make strides in political representation.
The findings also point to potential solutions. One solution is to design institutions that increase representation of groups that are excluded because they are not seen as leaders and are thus underevaluated for the role. For instance, creating quotas or reserved seats for previously excluded groups can help put them in leadership positions, despite existing biases. Over time, citizens can come to see them as potential leaders. Even if policies are not changed in the short run (and there are many reasons to believe they are not), expanding notions of leadership make later changes possible.
The study also helps us recognize different underlying reasons for exclusion, and thus locate where institutional solutions are most needed. Both Islamists and women were underrepresented in the political sphere before 2011, yet Islamists and women faced different forms of exclusion and bias. Women had been incorporated into the political sphere under the Bourguiba and Ben Ali regimes. As a result, they were a known commodity but nevertheless not “statesmen.” Islamists were also excluded, but due to authoritarian policies. Thus, at least some believed that Islamists were less corrupt and potentially better leaders than their secular opponents; they did not require institutional mechanisms to be seen as leaders. Indeed, the fact that Islamist-appearing candidates fared well in our survey—and at the polls in 2011 without quotas or reservations—suggests that different kinds of exclusion require different solutions. When designing policy proposals during transitions it is not sufficient to know simply the extent to which groups were previously excluded. What matters are citizens’ beliefs about leadership qualities, their stereotypes about social groups, and the extent to which these coincide. This is the fundamental lesson of role congruity theory.
Role congruity theory yields a very different understanding of the problem of electoral bias than one located in culture and Islam. We see gender discrimination, for instance, as a result of a patriarchal logic that found its manifestation in the secular-authoritarian structures of the Tunisian state. To reverse this trend requires institutional remedies, not cultural “prescriptions.” Scholars like Ronald Inglehart and Pippa Norris might advocate for quotas to override a “patriarchal culture,” but they believe that fundamental change in bias is only possible with modernization. We argue that such mechanisms as quotas can ultimately make it more likley for women or other excluded groups to be seen as leaders and have access to political power, regardless of culture.
Moreover, our study provides insights into other forms of discrimination that scholars focused on gender, culture, and Islam miss. For instance, gender and religion play an important role in shaping voters’ attitudes, but their roles are not equal. Tests of social identity or role congruence theories indicate that religion currently has far more influence over Tunisian voters’ preferences than gender. Moreover, candidate religion and gender appear to interactively affect electability. Whereas the secular female draws support from those who hold congruent roles and support gender equality, the religious female draws support from those who believe religiosity and leadership are congruent, regardless of their views on gender.
These lessons extend beyond Tunisia. The precise relationships between religion, gender, and electability in contemporary Tunisia are not expected to be universal, or even to remain immutable across time in Tunisia. In fact, a major tenet of the role congruity theory is that it is stereotypes of social groups and beliefs about leaders’ traits that drive political bias, and that these beliefs can vary across societies and change over time. Yet, regardless of whether it is gender, religiosity, race, regionalism, or other characteristics that are socially salient, the theory points to two key factors: first, the importance of identifying the social groupings that are salient and understanding how stereotypes associated with them relate to perceptions of leadership traits, and second, the significance of considering the relative strength of, and interactions between, these traits on electability.
Recognizing how role congruence underpins political bias provides a basis of advice and hope to activists, policymakers, and development specialists who aim to promote equal inclusion, regardless of gender, race, religiosity, or social characteristics. The study gives support for quotas and similar efforts aimed at increasing the presence of underrepresented groups. Such programs may alter stereotypes about these groups and expanding notions of what makes a good leader, leading to greater congruity between these roles and reducing political bias. Such programs must take into account intersectionalities that can affect discrimination. Footnote 50 As noted above, women from different backgrounds—religious and secular—face unique challenges to electability. Nevertheless, the fact that such effects are independent of the socioeconomic factors emphasized by modernization theorists means opportunities for undermining social bias need not depend on more complex socio-economic change.
It also informs scholars. The findings should prompt scholars to turn away from variants of modernization theory as they attempt to understand electoral bias, taking into account more carefully how historically-based perceptions of social stereotypes and leadership traits affect political bias.
Of course, much remains to be known. Our study reinforces recent calls to focus more on the intersection of traits in order to understand political bias, and it draws attention to the need to study perceptions of social groups and leadership more precisely. Future research should move beyond Tunisia and ask more explicitly about leaders’ competence, group stereotypes, and the policies the respondent believes the candidates are likely to support. It can explore the relationships between traits, interrogating further our finding that biases based on religiosity and gender not only interact but also have different strengths. More work needs to be done, as well, in new arenas by showing how discrimination at the polls and gender differences in political interest and efficacy affect the propensity of women or members of other groups from running for office and voting. Footnote 51 Finally, research is called for regarding the historical evolution of stereotypes over social groups and leadership traits. Understanding how such beliefs regarding social groups change and what factors prompt individuals to take a more expansive view of leadership can ultimately foster more inclusive political arenas. This can help better understand the barriers to incorporating women, minorities, and other groups, without prejudice, in public life.
Supplementary Materials
-
• Experimental Methodology
-
• Randomization Checks and Question Wording
-
• Multivariate Checks of Robustness
-
• Tables A1–A3
-
A1. Randomized block design
-
A2. Randomization of treatment and descriptive statistics for independent variables
-
A3. Ordered probit models of support for candidates
-
• Figures 6a–6c
Appendix

-
This get-out-the-vote poster entitled “Tunisia Votes” from the October 23, 2011 elections shows that females are more likely to smile than males.