INTRODUCTION
All agricultural production, including rice, requires some form of energy, whether for ploughing, applying fertilizers and pesticides, planting, watering, crop cultivation, harvesting, food processing or transport (Chauhan et al. Reference Chauhan, Mohapatra and Pandey2006). Therefore, globally, agriculture has been one of the major sources of greenhouse gases (GHG). Agriculture accounted for 0·14 of global anthropogenic GHG emissions (Bouwman Reference Bouwman2001), 0·47 of CH4 emissions and 0·84 of N2O emissions (US-EPA 2006). From 1990 to 2005, GHG emissions from agriculture increased by 14%, with average annual emissions of 49 Mt CO2e/yr (CO2 equivalent per year) (US-EPA 2006). In 2005, developing and developed countries were responsible for 0·74 and 0·26 of total agricultural emissions, respectively (Smith et al. Reference Smith, Martino, Cai, Gwary, Janzen, Kumar, McCarl, Ogle, O'Mara, Rice, Scholes, Sirotenko, Howden, McAllister, Pan, Romanenkov, Schneider and Towprayoon2007).
Rice is a staple food that forms an important part of the diet for a large part of the world's human population. It is the second-most consumed cereal grain in tropical Latin America and East, South and Southeast Asia (FAO 2006). Rice constitutes the major economic activity and a key source of employment and income for the rural population in these regions. In 2006, over 154 million ha of land globally was cultivated with rice, 0·98 in developing countries and only 0·02 in developed countries (FAO 2006). Rice production, especially from developing countries, accounted for 0·11 of all agricultural anthropogenic GHG emissions (Smith et al. Reference Smith, Martino, Cai, Gwary, Janzen, Kumar, McCarl, Ogle, O'Mara, Rice, Scholes, Sirotenko, Howden, McAllister, Pan, Romanenkov, Schneider and Towprayoon2007).
Rice is a labour-, water- and energy-intensive crop. Therefore, rice production is most cost effective where there is cheap labour and high rainfall. Ancient rice cultivation systems involved scattering of seed and accepting the low yields that resulted, whereas traditional rice cultivation systems require production of seedlings, preparation of land by animal and human labour, planting of seedlings and frequent flooding or submerging land after seedling establishment. This traditional method reduces weed growth and probably lowers GHG emissions, but it requires large quantities of fresh water (Tuong & Bouman Reference Tuong, Bouman, Kijne, Barker and Molden2003). The reduction of farm area and the increased need for water resources necessitated the invention of new irrigation techniques and farm machinery, resulting in the intensive and mechanized modern rice cultivation system of today. However, intensification, mechanization and modernization have never been emissions free, thus demanding more fuel, farm machinery and agrochemicals. In addition, production, packing, transportation and application require significant energy resources, resulting in even more GHG emissions (Stout Reference Stout1990; Hülsbergen et al. Reference Hülsbergen, Feil, Biermann, Rathke, Kalk and Diepenbrock2001; Vlek et al. Reference Vlek, Rodriguez-Khul and Sommer2003; Maraseni et al. Reference Maraseni, Cockfield and Apan2007).
The quantity of GHG emissions from rice farming not only depends on the amount and types of farm inputs, but also varies with irrigation systems and water management practices. Rice flooding cuts off oxygen supply to the soil. This results in anaerobic fermentation of organic matter and thus methane (CH4) gas production, which has 21 times more global warming potential than CO2. From 1990 to 2000, global CH4 emissions from rice fields increased from 845 to 898 Mt CO2e, mainly due to the increased area devoted to rice production (Verge et al. Reference Verge, de Kimpe and Desjardins2007). However, in contrast, some studies report a reduction of CH4 emissions in rice fields arguing that (1) reductions in flooding duration reduces GHG emissions by about 50% (Cole et al. Reference Cole, Duxbury, Freney, Heinemeyer, Minami, Mosier, Paustian, Rosenberg, Sampson, Sauerbeck and Zhao1997); (2) improved fertilization reduces emissions by 28–36% (Lindau et al. Reference Lindau, Bollich, Delaune, Mosier and Bronson1993); and (3) cultivating better rice cultivars can reduce emissions by up to 20% (Sass et al. Reference Sass, Fisher, Wang, Turner and Jund1992).
The present study estimates and compares the GHG emissions from rice farming inputs and irrigation systems in key rice-growing countries, such as in Pakistan, the Philippines, China, Indonesia, Myanmar, Nepal, Australia and the USA.
GHG EMISSIONS FROM FARM INPUTS
With rising farm inputs due to increasing mechanization, GHG emissions from farms are increasing (Graham & Williams Reference Graham and Williams2003). Farm inputs include agrochemicals (fertilizers, herbicides, insecticides, fungicides and molluscides), fuel, machinery, labour and farm yard manure. Compared to the 1950s, the global use of fertilizers (as at 1999) was about 23 times higher in the case of nitrogen (N), eight times for phosphorus (P) and four times for potassium (K; Smil Reference Smil1997). In Australia between 1987 and 2000, N fertilizer use increased by 3·25 (Dalal et al. Reference Dalal, Wang, Robertson and Parton2003). The main GHG concern with N fertilizer is that more than 0·50 is either lost through leaching into the soil or released into the atmosphere as nitrous oxide (N2O; Verge et al. Reference Verge, de Kimpe and Desjardins2007), which has 296–298 times more global warming potential than CO2. From 1990 to 2002, N2O emissions from N fertilizer increased by 18·7%, to 444 Mt CO2e (Verge et al. Reference Verge, de Kimpe and Desjardins2007). The worldwide use of agricultural pesticides also increased by an average of 3%/year from an equivalent value of US$20.5 billion in 1993 to US$27.5 billion in 2003, which is also contributing to GHG emissions (Vlek et al. Reference Vlek, Rodriguez-Khul and Sommer2003). However, GHG emissions from agrochemicals at the farm level have been largely ignored.
GHG emissions from farm machinery are another area of concern. In developing countries, farmers use little by way of farm machinery (Stout Reference Stout1990), whereas in developed countries farming mechanization has resulted in a high dependence on fossil-fuel reliant machinery. Of the total energy used in world agriculture, 0·51 is expended in farm machinery manufacture and 0·45 in the production of chemical fertilizer (Helsel Reference Helsel and Fluck1992). To produce 1 kg of farm machinery requires c. 83·7 mega joules (MJ) of energy (Stout Reference Stout1990), yet GHG emissions from farm machinery production has been largely ignored in the literature. Similarly, many land use activities, such as the production, transportation and utilization of different land use products (such as rice and straw) require fossil fuels, which emit significant amounts of GHG into the atmosphere, yet their GHG contributions have not been properly accounted (Gower Reference Gower2003).
MATERIALS AND METHODS
Data collection
The present study utilized a dataset, collected between 2001 and 2005 from the International Rice Research Institute (IRRI), in the Philippines, whereas the USA data were obtained from Arkansas University 2006/2007 (University of Arkansas 2006). All data used contained plot-level rice production information, such as machine, fuel, agrochemicals, farm yard manure, and human and animal labour use. For all major inputs into rice production, GHG emissions associated with these activities were calculated.
The selected countries – six developing and two developed countries – are the world's largest rice producers and/or consumers. Data from the selected developing countries include Liuyuankou Irrigation System in the Yellow River Basin, North West China; Rechna Doab in Punjab, Pakistan; Upper Pampanga River Integrated Irrigation System in Central Luzon, the Philippines; Semarang and Pati Districts in Central Java, Indonesia; Banke district in Terai, Nepal; and Myitthar Township in Mandalay Division, Myanmar. The data from the selected developed countries include Coleambally Irrigation Area (CIA) in NSW, Australia and Arkansas, in the USA (Appendix 1).
Estimation of GHG emissions from farm machinery
In rice cropping, farm machinery includes tractors, pumping machines and pipes. Since the weight of these pumping machines and pipes are low, so are GHG emissions, and therefore they were not considered. On average, approximately 12·8 kg CO2e of GHG is emitted in the manufacture of 1 kg of a tractor (Wells Reference Wells2001). Emissions involved in transporting tractors from manufacturing sites to rice farms are negligible on a per ha basis and is thus not considered in the present study. The average life span (12 500 h : Harris Reference Harris2004) and average weight of a tractor (6277 kg) were taken from the production company, John Deere (a John Deere tractor with 92 kW power and 6277 kg weight was assumed for this study). The proportion of time the tractor was used in land preparation and other farming activities was derived from farmers’ survey data (Appendix 2) and, in the case of the USA, from data provided by the University of Arkansas (2006). Based on the work of Maraseni et al. (Reference Maraseni, Cockfield and Apan2007), the following equation was used to estimate tractor-generated GHG emissions in rice production:

Production, packing, transportation and application of agrochemicals
Relative to other fertilizers such as P and K, N requires more energy for its production (Helsel Reference Helsel and Fluck1992; Vlek et al. Reference Vlek, Rodriguez-Khul and Sommer2003). Furthermore, rice requires considerable protection from disease and pests and more energy is required in the production of insecticides, herbicides, fungicides and molluscides. Hence, an increase in agrochemical inputs is likely to mean an increase in emissions at some point in the production chain.
There are two common procedures for estimating GHG emissions from agrochemical inputs: (1) estimating the amount of energy used for all processes of production, packing, transportation and application, and then estimating the subsequent GHG emissions (3·6 MJ=1 kWh=0·411 kg CO2e GHGs); or (2) estimating the global warming potential of each agrochemical.
The Government of the State of São Paulo (2004) estimated the amount of energy required for producing different agrochemicals in Brazil. Mudahar & Hignett (Reference Mudahar, Hignett and Helsel1987) estimated the energy requirement for production, packing, transportation and application of fertilizers. Shapouri et al. (Reference Shapouri, Duffield and Graboski1995) estimated the energy required for the production of fertilizers and pesticides in the USA. Kim & Dale (Reference Kim and Dale2003) independently estimated the amount of energy required for the production, packing, transportation and application of fertilizers. However, the estimation of net GHG emissions from all these studies is problematic. As chemical reactions are exothermic, they release energy. Given that no information is provided from the studies mentioned above about how much energy was released during these reactions, it is hard to determine the amount of external energy needed during agrochemical production. Although the total energy figure gives some clue about the relative emissions of different agrochemicals, it is problematic. Therefore, the second option, estimating global warming potential of agrochemicals, was used in the present study.
Kim & Dale (Reference Kim and Dale2003) estimated the global warming impact (GWI) value (gm CO2 equivalent/kg) of most agrochemicals (Table 1). The GWI value included all three GHGs (CO2, CH4 and N2O) and their impact due to agrochemical production, packing, transportation and application. In addition, the GWI also considered the emission of N2O during the process of denitrification after applying nitrogen fertilizers (Kim & Dale Reference Kim and Dale2003). As the GWI has a broad impact, these values were used for the estimation of GHG emissions from agrochemicals. Kim & Dale (Reference Kim and Dale2003) did not provide any data for the GWI for insecticides, fungicides, herbicides and molluscides. Therefore, values for insecticides, fungicides and herbicides were taken from Barber (Reference Barber2004), whereas for molluscides the average of all three was used.
Global warming impact (GWI) (kgCO2e/kg) of agrochemicals

Sources:* Kim & Dale (Reference Kim and Dale2003);
† Barber (Reference Barber2004).
GHG emissions due to on-farm fossil fuel usage
Production, transportation and combustion of diesel produce significant amounts of GHG emissions. For the present study, 3·8 kg CO2e of GHG emissions per litre of diesel was used (Flessa et al. Reference Flessa, Ruser, Dorsch, Kamp, Jimenez, Munch and Beese2002). The amount of fuels consumed in the establishment, production, harvesting and transportation of rice was obtained from farm surveys (Appendix 2). The total fuel consumption and GHG emissions for each litre of fuel was used to calculate the total amount of GHG emissions from fossil fuel usage.
GHG emissions due to animal labour and farm yard manure
Animal labour and bullocks emit CH4 from ruminant fermentation. A pair of plough bullocks have a working life of 10–12 years in the open-field environment, but in the rice tracts the usual duration of life is only c. 5 years (Maharashtra Government 2006). Bullocks are not used in developed countries; however, they are extensively used in the developing countries of Indonesia, Myanmar and Nepal. Due to different animal sizes, food intake and digestibility, the average emission rates of cows in developed and developing countries' are different: 55 kg/head/yr in developed countries and 35 kg/head/yr in developing countries (Crutzen et al. Reference Crutzen, Aselmann and Seiler1986, cited in Eckard et al. Reference Eckard, Dalley, Crawford, Keenan, Bugg and Ainslie2000). However, data could not be located on bullock emissions. Given that bullocks and cows are similar in size, food intakes and digestibility, the developing countries' average of 35 kgCH4/yr, equivalent to 2 kg CO2e/day (1 kg of CH4=21 kg CO2), was used. As bullocks do not work all year round, the present study assumed that, on average, bullocks work for 3 h/day (1095 h/yr), which equates to GHG emissions of 0·67 kg CO2e/working hour.
While farmyard manure (FYM), which includes urine, faeces and litter, generally increase CH4 and N2O emissions in rice crops, the application of FYM results in a net mitigation of emissions due to carbon being sequestered into the soil (Wassmann et al. Reference Wassmann, Neue, Ladha and Aulakh2004). Therefore, FYM data are not used, as it is assumed that they neutralize the overall GHG effects.
Relationship between rice yield and GHG emissions
In the present study, it is hypothesized that there is a statistically significant relationship between rice yield and GHG emissions, with higher yields attributed to higher farm inputs. Therefore, regardless of country and irrigation system, a simple linear regression model between GHG emissions (as a dependent variable) and rice yield (as an independent variable) was developed and tested.
RESULTS
Rice production area and productivity in 1990 and 2006
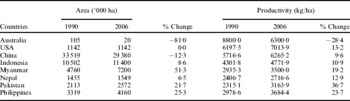
Among the eight countries used in the present study, China in 1990 had the highest rice production area, followed by Indonesia and Myanmar, whereas the developed countries, USA and Australia, have relatively small areas devoted to rice production (Table 2). In 1990, about 147 million ha was planted with rice, with the majority occurring in developing countries (0·97). Between 1990 and 2006, global rice production area increased by 0·05 (decreasing by 0·088 in developed countries and increasing by 0·054 in developing countries). Surprisingly, during this period, the rice production area in Australia decreased by 0·8–20 000 ha. This was largely due to prolonged drought that resulted in lower rice production and thus lower profits.
Rice/paddy harvested area (‘000 ha) and productivity (kg/ha) in the selected developing and developed countries in 1990 and 2006

Source: FAO (2006).
In 1990, Australia actually had the highest rice productivity followed by the USA and China, whereas Pakistan and Nepal had the lowest productivity (Table 2). In 2006, USA had the highest rice productivity followed by Australia and China; however, from 1990 to 2006, rice productivity in Australia decreased by 0·284 (for reasons noted earlier) yet it increased in all other countries. The highest increase in productivity was in Pakistan, followed by Myanmar and USA.
Comparison of GHG emissions from farm inputs
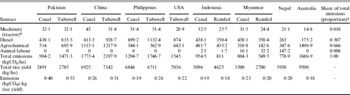
The total GHG emissions/ha of rice grown in the eight countries in the present study was 24 503 kg CO2e. Regardless of irrigation type, GHG emissions from farm machinery were found to be similar in each country (Table 3 and Appendix 2). The Philippines had the highest GHG emissions from farm machinery, whereas Australia had the lowest emissions. Emissions related to the use of farm machinery comprised 0·018 of total emissions. Therefore, farm machinery has little impact on the total GHG budget from farm inputs.
Emissions of GHGs (kg CO2e/ha) from primary farm inputs in rice cropping in various irrigation systems in selected developed and developing countries

* Farm machinery also covers water-pumping machines, but emissions associated with them are insignificant. Therefore, they are not considered.
† Share of total emissions from the eight countries in the present study.
Unlike farm machinery, emissions associated with fossil fuel use were different under the various irrigation systems. In general, they were highest for tubewell, followed by canal and rainfed irrigation systems. Consistent with emissions from farm machinery, the Philippines had the highest GHG emissions both from tubewell and canal irrigation systems from farm fossil fuel, whereas Australia had the lowest emissions (in canal irrigation system). On aggregate, fossil fuels accounted for 7534 kg CO2e, or 0·31, of total emissions, showing that fossil fuels have a significant role in overall GHG emissions.
Similarly, emissions associated with production, packing, transportation and application of agrochemicals accounted for 0·666 of total emissions from farm inputs. In general, for each country there was little difference in agrochemical emissions for the various irrigation systems; however, canal irrigation in Myanmar had considerably higher emissions than rainfed irrigation. Emissions of GHGs from agrochemicals were highest from canal irrigation systems in Australia, followed by tubewell irrigation in China, whereas the lowest emissions were from rainfed irrigation in Myanmar.
Of the eight countries, emissions associated with the use of animal labour were estimated only for Indonesia, Myanmar and Nepal, as other countries did not use animal labour for rice production. Nepal had the highest emissions followed by Myanmar and Indonesia. Regardless, emissions from animal labour are insignificant at 0·008 of total emissions.
Comparison of GHG emissions from farm inputs in canal, tubewell and rainfed irrigation systems
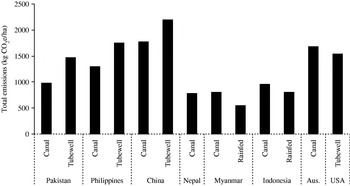
Canal irrigation is the most common type of irrigation system in most of the countries studied. China was found to be the highest emitter followed by Australia, the Philippines, Pakistan and Indonesia, whereas Myanmar and Nepal were among the lowest emitters (Fig. 1). Higher emissions from China and Australia were mainly due to larger quantities of agrochemicals used compared with other countries (Table 3). Average emissions from all developing countries were 1098·3 kg CO2e/ha, 1·53 times Australia's emissions.
Total GHG emissions (kg CO2e/ha) from selected developing and developed countries in different irrigation systems.

Also, emissions from tubewell irrigation were higher in China, followed by the Philippines, USA and Pakistan. Average emissions from all developing countries were 1805·3 kg CO2e/ha, which was 1·17 times the USA's emissions. The lower emissions from the USA were attributed to lower applications of agrochemicals (Table 3).
Rainfed irrigation data were applicable only for Indonesia and Myanmar, with emissions due to farm inputs calculated for Indonesia being higher than for Myanmar largely due to higher amounts of agrochemicals used in Indonesian rice-growing practices.
Regardless of the irrigation system, on a per hectare basis, emissions from tubewell were found to be higher than canal and rainfed irrigation systems. Average emissions for all countries with tubewell irrigation systems were 1·64 times higher than canal and 2·64 times higher than rainfed irrigation systems. The higher emissions from tubewell were due to higher amounts of diesel used to pump water, whereas the lowest emissions from rainfed irrigation systems were due to lower quantities of agrochemicals and fuels used.
Comparison of efficiencies between countries and irrigation systems
The production of rice (kg/ha) and GHG efficiencies (kg CO2e/kg rice yield) for various irrigation systems in the eight countries are presented in Table 3. As expected, rainfed irrigation systems were found to be more efficient, followed by canal and tubewell irrigation systems. On average, the GHG emissions/kg of rice grown varied with different irrigation systems. Rainfed irrigation systems emitted 0·19 kg CO2e, whereas canal and tubewell irrigation systems produced 0·24 and 0·33 kg CO2e, respectively (Table 3).
Among the countries using tubewell irrigation systems, Pakistan was the least efficient with more than twice the GHG emissions (0·53 kg CO2e/kg rice) of the most efficient country, the USA (0·22 kg CO2e/kg rice). Although comparing GHG emissions on a per hectare basis in tubewell irrigation systems, Pakistan had lower emissions than China, the Philippines and USA, but this is not the case if GHG emission efficiency was considered. This is probably due to lower rice productivity in Pakistan (Table 2). Rice productivity not only depends on farm inputs but also on climatic, edaphic and topographic factors. Pakistan was again the least efficient among the canal irrigation system users, more than double the GHG emissions (0·40 kg CO2e/kg rice) of the most efficient country Australia (0·18 kg CO2e/kg rice).
Average emissions for all developing countries (0·37 kg CO2e/kg rice) using tubewell irrigation systems were 1·68 times higher than the emissions from tubewell irrigation systems in the USA. Similarly, average emissions with canal irrigation systems in developing countries (0·25 kg CO2e/kg rice) were 1·39 times higher than the emissions from canal irrigation systems in Australia. This indicates that developed countries are more efficient in terms of GHG efficiency, probably due to higher rice productivity (Table 2) and better land use suitability than in developing countries.
Relationship between rice yield and GHG emissions
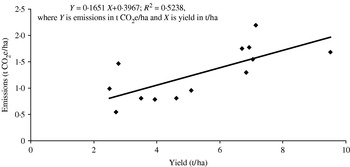
As higher yield is primarily attributed to increased farm inputs, it was hypothesized that the increasing rice yield would have some contribution to GHG emissions. The present study found that only about 0·52 of the variation in GHG emissions from rice farming is explained by rice yield (Fig. 2), whereas the other 0·48 could be explained by best management practices, low emissions technologies and land use suitability. However, the relationship between GHG emissions and yield is statistically significant (P<0·01) (Y=0·1651 X+0·3967; R 2=0·5238 and P=0·01). Based on this relationship, a yield increase of 100 kg would increase GHG emissions by 16·51 kg CO2e.
Relationship between rice yield and GHG emissions.

DISCUSSION
Rice is the major staple food for most Asian countries. The move to more mechanized plus intensified farming processes has led to impressive gains in rice productivity, despite the increasing cost of farm inputs. The present study estimated and compared the GHG emissions from rice farming, resulting from different farm inputs and irrigation systems, in the major rice growing regions of the world, such as Pakistan, the Philippines, China, Indonesia, Myanmar, Nepal, Australia and the USA. Results indicate that farm machinery, fuels, agrochemicals and animal labour accounted for 0·018, 0·0307, 0·0666 and 0·008, respectively, of GHG emissions. The quantity of GHG emissions from fossil fuels varies with the type of irrigation systems being used; highest in tubewell followed by canal and rainfed irrigation systems. Similarly, in each country, where both the canal and tubewell irrigation systems, or the canal and rainfed irrigation systems, were used, the difference in emissions from agrochemicals was minimal.
Emissions from tubewell irrigation systems were higher than canal and rainfed irrigation systems. Average emissions from all countries with tubewell irrigation systems were 1·64 times the GHG emissions from canal and 2·64 times rainfed irrigation systems. The higher emissions from tubewell were driven by higher amounts of diesel used to pump water, while the lowest amount of emissions resulted from rainfed irrigation systems due largely to lower amounts of agrochemicals and diesel fuel use.
Considering GHG emission efficiency (emissions/kg of rice yield), developing countries were found to be less efficient than developed countries in both the canal and tubewell irrigation systems.
About 0·50 of the variation in GHG emissions in rice farming is explained by rice yield. The relationship between them was statistically significant (P<0·01); an increase of 100 kg yield would increase GHG emissions by 16·51 kgCO2e. Therefore, increasing rice productivity to some extent was linked to higher farm inputs and thus higher GHG emissions.
We would like to extend our thanks to the International Rice Research Institute, the Philippines for supplying invaluable rice production data, and the Australian Centre for Sustainable Catchments, University of Southern Queensland, for logistical and other support. We cordially thank two anonymous referees for their valuable suggestions that were gratefully acknowledged.
APPENDIX 1
CHARACTERISTICS OF THE STUDY LOCATIONS
• China: Data were collected during 2002 from a total of 45 farmers, 12 of which were using tubewell irrigation in the Liuyuankou Irrigation System (LIS), located in the Yellow River Basin, northwest China. Surface water from the Yellow River and local groundwater are two key sources of irrigation water in the irrigation systems in LIS. The LIS lies in a semi-arid climatic zone with a highly variable annual rainfall of 530 mm. The annual average temperature is 14°C and annual evaporation is 1150 mm.
• Australia: Data were collected during 2005/06 from 18 farmers using canal irrigation in the Coleambally Irrigation Area (CIA) located south of the Murrumbidgee River in New South Wales, Australia. The CIA was developed during the 1960s to make use of diverted water as a result of the Snowy Mountains Hydro-Electric Scheme. This water is diverted to the CIA from the Murrumbidgee River at Gogelderie Weir. The CIA lies in a semi-arid climatic zone with a highly variable annual rainfall of 530 mm. The annual average temperature is 20°C and annual evaporation is 1000 mm.
• Pakistan: Data were collected during 2001/02 from a total of 188 farmers, of which 53 farmers use tubewell irrigation, and are located in Sheikhupura, Mangtanwala and Dhaular subdivisions in Rechna Doab (RD), Pakistan. RD utilize surface and groundwater for irrigation, with groundwater being the dominant source. The RD area lies in a semi-arid climatic zone with a highly variable annual rainfall of 530 mm. The annual average temperature is 21°C and annual evaporation is 1200 mm.
• Philippines: Data were collected during the 2002 dry season from a total of 150 farmers, out of which 50 farmers were using tubewell for rice irrigation, in the Upper Pampanga River Integrated Irrigation System (UPRIIS), Central Luzon, Philippines. The UPRIIS covers an area of 10 000 ha and produces an average of 63 million tonnes of rice per annum. The climate in the UPRIIS is characterized by two pronounced seasons: dry from November to April with an average rainfall of 193 mm; wet from May to October with an average rainfall of 1654 mm. The annual average temperature ranges from 324°C and annual evaporation varies from 503 to 665 mm.
• Indonesia: Data were collected during 2002/04 for both wet and dry seasons from 85 farmers in the Semarang and Pati districts in Central Java, Indonesia. Semarang and Pati have a tropical climate with two seasons: the wet season is from November to April influenced by the monsoon, whereas the dry season is from May to October influenced by the eastern monsoon. Annual rainfall is between 2065 and 2460 mm with the maximum rainfall occurring in the months of December and January. The average temperature range is from 28·0 to 34·3°C.
• Nepal: Data were collected during 2002/03 from 160 farmers from the Banke district in Terai, Nepal. The total area of the Banke district is about 278 674 ha, in which rice is the dominant crop in summer. Heavy monsoon rains begin in June and end in September; this monsoon comprises about 87% of the annual total precipitation. The average annual rainfall of Banke District was 1445 mm. Minimum mean monthly temperature is 19·0°C with the maximum mean monthly temperature of 31·2°C.
• Myanmar: Data collected during 2002/03 from 105 rice farmers revealed that 30 farmers grew rainfed rice, from the Kingda Dam irrigated area in Mandalay Division, in particular, the Myitthar Township, Myanmar. Myitthar occupies 87 725 acres or 44·9% of the total Kingda Dam irrigated area. The average rainfall is 993 mm. Minimum mean monthly temperature is 21°C and the maximum mean monthly temperature is 34°C. Rice is the major crop grown during the wet season in Myitthar Township.
• USA: Data on the Northeast Louisiana Rice Area were made available from the University of Arkansas and Louisiana State University. The Northeast Louisiana Rice Area is characterized by flat to slightly rolling topography. Northeast Louisiana has a mixed-humid climate with more then 550 mm of precipitation. The average monthly temperature drops below 7°C in winter.
APPENDIX 2
Emissions of GHGs (kgCO2e/ha) from primary farm inputs in rice cropping in various irrigation systems in selected developed and developing countries