



1. Introduction
Coherent structures have been studied in turbulent flows for some time now. Findings in that area led to a change in view: instead of considering turbulence as completely stochastic, this is now seen as having a clear coherent motion among the apparent unsteady, chaotic field. In turbulent jets, for instance, structures governed by the Kelvin–Helmholtz instability were found to be important not only for transition (Michalke Reference Michalke1964), but also for the sound radiation at shallow angles (Cavalieri et al. Reference Cavalieri, Jordan, Colonius and Gervais2012). In wall-bounded flows, streamwise elongated, spanwise organised structures (called streaks), found firstly by Kline et al. (Reference Kline, Reynolds, Schraub and Runstadler1967), are also ubiquitous in shear flows. These structures are found for all kinds of turbulent shear flows, including channels (Gustavsson Reference Gustavsson1991), pipes (Hellström, Sinha & Smits Reference Hellström, Sinha and Smits2011) and even round jets (Nogueira et al. Reference Nogueira, Cavalieri, Jordan and Jaunet2019).
The mechanism behind streak formation was firstly studied by Ellingsen & Palm (Reference Ellingsen and Palm1975), later complemented by Landahl (Reference Landahl1980). In their study they concluded that the presence of shear in the mean flow and a non-zero wall-normal velocity induce momentum transfer between different layers of the fluid. If streamwise vortices are present, for instance, these generate streaks via a non-modal, linear mechanism such that, when fluid is lifted from high- to low-speed regions of the flow, a high-speed streak is formed (the opposite happening for a low-speed streak). This is called the lift-up effect and, considering that streaks are present in several shear flows, this effect should be an important part of the turbulent dynamics. This is explored, for example, by Hamilton, Kim & Waleffe (Reference Hamilton, Kim and Waleffe1995) and Waleffe (Reference Waleffe1997) where a self-sustaining process for wall-bounded turbulence was proposed. This can be summarised as follows: (i) streamwise vortices in the turbulent medium generate streamwise streaks via the lift-up effect; (ii) streaks grow until the instability is triggered, leading to their breakdown; (iii) the resulting flow interacts nonlinearly in order to regenerate the streamwise vortices, thus restarting the process. The first step is well understood, and was considered by the work of Ellingsen & Palm (Reference Ellingsen and Palm1975). The other stages have also received a good deal of attention: the streak breakdown was studied by Schoppa & Hussain (Reference Schoppa and Hussain1999) using numerical simulation and linear stability theory, revealing that the breakdown of a low-speed streak directly generates new streamwise vortices in the end of the process. This was further explored numerically (Jiménez & Pinelli Reference Jiménez and Pinelli1999; Andersson et al. Reference Andersson, Brandt, Bottaro and Henningson2001), experimentally (Asai, Minagawa & Nishioka Reference Asai, Minagawa and Nishioka2002) and even theoretically (Kawahara et al. Reference Kawahara, Jimenez, Uhlmann and Pinelli2003), using a simplified vortex sheet model. As synthesised by Brandt (Reference Brandt2007), this process can occur via either a varicose or a sinuous mode, the latter being the dominant mechanism; in both cases, the final structures resulting from the instability of a low-speed streak are elongated in the streamwise direction (quasi-streamwise vortices).
The cited works focused on the steps leading to the breakdown of streaks, looking at the self-sustaining cycle in the time domain (in order to evaluate the sequence of events); in most cases results confirm qualitatively trends observed in turbulent flows, but quantitative comparisons are difficult due to the simplifications introduced in the modelling process. Alternative approaches for studying these phenomena are based on the analysis of the linearised Navier–Stokes operator, considering the mean field as the base flow. In this framework, linear methods such as resolvent analysis (Jovanovic & Bamieh Reference Jovanovic and Bamieh2005; McKeon & Sharma Reference McKeon and Sharma2010) and linear transient growth (Butler & Farrell Reference Butler and Farrell1992; Schmid & Henningson Reference Schmid and Henningson2001) are useful to obtain optimal responses from the harmonically forced linearised Navier–Stokes system (resolvent) or the flow structure resulting from a non-modal growth of initial disturbances (linear transient growth). Both analyses, albeit linear, reproduce some experimental trends in both wall-bounded flows (del Álamo & Jiménez Reference del Álamo and Jiménez2006; Cossu, Pujals & Depardon Reference Cossu, Pujals and Depardon2009; Pujals et al. Reference Pujals, García-Villalba, Cossu and Depardon2009; Sharma & McKeon Reference Sharma and McKeon2013; Abreu et al. Reference Abreu, Cavalieri, Schlatter, Vinuesa and Henningson2019; Morra et al. Reference Morra, Semeraro, Henningson and Cossu2019) and free-shear flows (Schmidt et al. Reference Schmidt, Towne, Rigas, Colonius and Brès2018; Lesshafft et al. Reference Lesshafft, Semeraro, Jaunet, Cavalieri and Jordan2019). Nevertheless, there are intrinsic limitations to these approaches. An exact match of resolvent predictions and data from experiments is only expected if forcing were spatially white noise (Towne, Schmidt & Colonius Reference Towne, Schmidt and Colonius2018a). It is nonetheless clear that nonlinearities in the Navier–Stokes system have ‘colour’ (Zare, Jovanović & Georgiou Reference Zare, Jovanović and Georgiou2017). We may consider, for instance, that nonlinear terms are zero on a wall, and should be negligible in regions of uniform flow. Moreover, nonlinear terms are expected to have a specific structure, as they result from the turbulent flow field which itself has a level of organisation.
Hence, attempts have been made to identify the colour of such ‘forcing’ terms using some flow statistics. Zare et al. (Reference Zare, Jovanović and Georgiou2017), for instance, proposed a formulation to estimate the nonlinear forcing statistics from a turbulent flow field based on the knowledge of a limited number of velocity correlations. Similar work was performed by Towne, Lozano-Durán & Yang (Reference Towne, Lozano-Durán and Yang2020), who proposed a method for estimating the systems response statistics via an indirect estimation of the system force statistic, although a comparison between the estimated and real forces is not presented. The method was applied to different problems, such as Ginzburg–Landau and linearised Navier–Stokes, showing that it can outperform several approaches in flow cases that are not dominated by the first resolvent mode. It is worth noting that the cited works focused on estimating the forcing from a limited number of sensors, in an optimisation framework aimed at matching statistics from such sensors, instead of evaluating the characteristics of such forcing. Also, there is thus no a priori guarantee that the identified forcing is that actually present in turbulence dynamics. In his thesis, Towne (Reference Towne2016) also analysed the structure of the equivalent nonlinear forcing of a turbulent jet using data from a large-eddy simulation (LES). The preliminary results of forcing, as computed in the cited work, can be considered as a first approximation of the nonlinear terms of the Navier–Stokes equations; still, it also accounts for the subgrid model in the simulation. The same holds for the analysis of Towne, Brès & Lele (Reference Towne, Brès and Lele2017), who also studied forcing statistics using LES data, in order to provide models for resolvent analysis of high- and low-Reynolds-number jets. These earlier efforts did not account for windowing issues later studied by Martini et al. (Reference Martini, Cavalieri, Jordan and Lesshafft2019), and, hence, the presented results may suffer from signal processing issues. Another way to consider the structure of nonlinear terms is by introducing an eddy viscosity model on the linearised Navier–Stokes operators (del Álamo & Jiménez Reference del Álamo and Jiménez2006; Pujals et al. Reference Pujals, García-Villalba, Cossu and Depardon2009; Illingworth, Monty & Marusic Reference Illingworth, Monty and Marusic2018; Morra et al. Reference Morra, Semeraro, Henningson and Cossu2019), which models at least part of the nonlinear effects as turbulent diffusion on the flow structures. However, such a model should not be required when full force knowledge is available and the proper signal treatment is performed.
None of the cited works dealt with the exact covariance, within numerical accuracy, of nonlinear terms, as each included some degree of approximation whose effect is difficult to evaluate a priori. In order to avoid the simplifications above, one may consider the exact covariance of the nonlinear terms in the analysis. By taking the exact covariance of the nonlinear terms into account (or the cross-spectral density (CSD) if the analysis is carried out in the frequency domain), the exact response of the system can be obtained. To the best of the authors’ knowledge, this has not been attempted for turbulent flows, but only for model problems such as the forced Ginzburg–Landau equation (Towne et al. Reference Towne, Schmidt and Colonius2018a; Cavalieri, Jordan & Lesshafft Reference Cavalieri, Jordan and Lesshafft2019). A notable exception is the work of Chevalier et al. (Reference Chevalier, Hœpffner, Bewley and Henningson2006), where time covariances of the nonlinear terms are obtained from a simulation of turbulent channel flow, and subsequently used, assuming white noise in time, to design estimators of flow fluctuations using Kalman filters. However, the use of the exact covariance of the nonlinear forcing term can be prohibitive for complex flow cases. Therefore, an approximation or modelling of the forcing term is usually needed to reduce the number of variables to be computed/modelled, and may also lead to insight on the relevant physics, as the dominant mechanisms of excitation of flow structures may be thus isolated. An analysis of forcing covariances should reveal the degree of organisation of the excitation, showing how significant are the departures from the simplified white-noise assumption.
This work focuses on the analysis of the nonlinear forcing term in the resolvent analysis of a turbulent Couette flow, here studied in the minimal computational box of Hamilton et al. (Reference Hamilton, Kim and Waleffe1995), which allows a full determination of the CSDs of forcing and response without any simplifying assumption. Differently from other previous approaches (Zare et al. Reference Zare, Jovanović and Georgiou2017; Towne et al. Reference Towne, Lozano-Durán and Yang2020), instead of estimating the forcing from a subset of data in order to estimate other flow statistics, we explicitly compute the nonlinear term of the Navier–Stokes equations, performing the whole analysis using the actual statistics of these terms. Reduction of the complexity of forcing statistics can be performed subsequently in modelling steps, whose accuracy may be evaluated by computing flow responses to simplified forcings using the resolvent operator. The paper is divided as follows. In § 2 the relevant parameters of the simulation are defined, followed by the methods showing how the covariance of the velocity fluctuations is obtained from the covariance of the nonlinear terms of the Navier–Stokes equations. The reconstruction of the velocity statistics from the forcing covariance is evaluated in § 3, where the role of the windowing correction term is highlighted. After that, in § 4 we focus on obtaining the relevant parts of the nonlinear terms (those that will generate the bulk of the covariance of the response) for two different cases (streaks, and streamwise oscillations of spanwise velocity). The paper closes in § 5 with a connection between this analysis and the self-sustaining cycle characteristic of turbulent Couette flow.
2. Numerical approach
The case chosen for the study is the Couette flow in the minimal flow unit. Such a flow case retains salient features of turbulent flows, like the dominance of streaks by the lift-up effect and the self-sustaining process defined by Hamilton et al. (Reference Hamilton, Kim and Waleffe1995) and Waleffe (Reference Waleffe1997), and minimises computational power requirements.
2.1. The minimal flow unit
The flow case chosen is that explored by Hamilton et al. (Reference Hamilton, Kim and Waleffe1995). It is defined by the smallest box and the smallest Reynolds number in which turbulence can be sustained without any external forcing. For Couette flow, the minimal box has dimensions  $(L_x,L_y,L_z)=(1.75{\rm \pi} h,2h,1.2{\rm \pi} h)$, denoting lengths in the streamwise, wall-normal and spanwise directions, respectively;
 $h$ is the channel half-height. Plane Couette flow is realisable in experiments (Tillmark & Alfredsson Reference Tillmark and Alfredsson1992; Bech et al. Reference Bech, Tillmark, Alfredsson and Andersson1995; Bottin & Chaté Reference Bottin and Chaté1998). Numerical simulations with sufficiently large domains lead to statistics matching experiments (Komminaho, Lundbladh & Johansson Reference Komminaho, Lundbladh and Johansson1996). Minimal domains such as the present one have qualitative agreement with experimental results (see, for instance, Jiménez & Moin (Reference Jiménez and Moin1991) for an early example with channel flow), but greatly simplify the analysis; because of this, such small domains are often used in dynamical-system descriptions of turbulent flows (Kawahara & Kida Reference Kawahara and Kida2001; Waleffe Reference Waleffe2003; Gibson, Halcrow & Cvitanović Reference Gibson, Halcrow and Cvitanović2009). The discretisation was chosen as
 $(n_x,n_y,n_z)=(32,65,32)$ before dealiasing in the wall-parallel directions, which gives a slightly higher resolution than that used in Hamilton et al. (Reference Hamilton, Kim and Waleffe1995). We consider Couette flow with walls moving at velocity
 $\pm U_w$; the Reynolds number for this case is
 $Re=400$, based on wall velocity
 $U_w$ and half-height
 $h$. For this flow, this leads to a friction Reynolds number
 $Re_\tau \approx 34$, based on the friction velocity. From now on, all quantities are non-dimensional values based on outer units, with
 $h$ and
 $U_w$ as reference length and velocity. The simulation is performed in SIMSON, a pseudo-spectral solver for incompressible flows (Chevalier, Lundbladh & Henningson Reference Chevalier, Lundbladh and Henningson2007), with discretisation in Fourier modes in streamwise and spanwise directions, and in Chebyshev polynomials in the wall-normal direction.
The simulation is initialised with white noise in space for  $Re=625$, which becomes turbulent after a few timesteps; the Reynolds number is, then, slowly decreased until the desired value of
 $400$. After reaching the desired value of
 $Re$ and discarding initial transients, flow fields are stored every
 ${\rm \Delta} t=0.5$ in the interval
 $10\,000 < t < 25\,000$. During this period, several streak regeneration cycles are observed, and the flow is expected to be statistically stationary. The mean turbulent velocity profile is shown in figure 1(a), which has the usual ‘
 $S$’ profile typical of turbulent Couette flow. The mean profile and fluctuation levels match previous results for the same computational domain and Reynolds number (Gibson, Halcrow & Cvitanović Reference Gibson, Halcrow and Cvitanović2008). A snapshot of the streamwise velocity fluctuations for a
 $(\kern-0.05em y,z)$ plane is shown in figure 1(b). As expected, streaks arise clearly in the velocity field, since these structures are the most relevant in the turbulent dynamics of this sheared flow; they are flanked by streamwise vortices with the expected lift-up behaviour: positions with downward/upward motion display lifted high/low momentum, leading to a high/low-speed streak.
Mean velocity for Couette flow and snapshot of the velocity field in the  $(\kern-0.05em y,z)$ plane (colours: streamwise velocity; arrows: spanwise and wall-normal velocities). (a) Mean flow and (b) snapshot of velocity field.

Using the results from the direct numerical simulation (DNS), the velocity fluctuations around the mean-flow profile (treated as response of the input–output version of the Navier–Stokes system) were computed; these, in turn, were used to compute the nonlinear terms of the Navier–Stokes equations, which will be treated as a forcing term in the Navier–Stokes equations expanded around the mean flow. These are computed directly as a function of time in the physical domain. After that, the resulting forcing was Fourier transformed in space, leading to forcings as a function of streamwise and spanwise wavenumbers, but still in the time domain. Using the forcing and velocity in the time-wavenumber domain, we computed the CSDs of the response ( ${\boldsymbol {S}}$) and of the forcing (
 ${\boldsymbol {P}}$). This is further detailed in the next section.
2.2. Recovering response statistics from the forcing CSD
Since Couette flow is homogeneous in  $x$ and
 $z$ directions, the first step for the analysis of this flow is to perform a spatial Fourier transform of both response and forcing, so the analysis can be performed separately for each wavenumber. Modes are defined by the integers
 $(n_\alpha ,n_\beta )$, with
 $\alpha =2 {\rm \pi}n_\alpha /L_x$ and
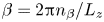 $\beta =2 {\rm \pi}n_\beta /L_z$ being the wavenumbers, following the same notation of Hamilton et al. (Reference Hamilton, Kim and Waleffe1995). The wall-normal integrated kinetic energy of the first two modes, some of the most relevant ones in the analysis of Hamilton et al. (Reference Hamilton, Kim and Waleffe1995), is shown in figure 2, showing the fluctuations peak at vanishing frequency
 $\omega \to 0$ for mode
 $(0,1)$, and a plateau is observed at low frequencies for mode
 $(1,0)$. Since we consider a Couette flow with walls moving at opposite velocities,
 $\pm U_w$, this very low-frequency behaviour reflects that the two modes peak at approximately zero phase speed, without preferred motion following some streamwise or spanwise direction, as can be induced from the results of Hamilton et al. (Reference Hamilton, Kim and Waleffe1995). The time power spectral density (PSD) for each mode was estimated using the Welch method, with the signal divided in segments of
 $n_{fft}=1024$ with
 $75\,\%$ overlap, which led to 114 blocks for the analysis. A Hanning window was used to reduce spectral leakage, allowing accurate relation between forcing and response of the system.
Power spectral density of the wall-normal integrated kinetic energy for the different modes studied herein.

We will study the two most energetic modes at low frequencies, as showed in Hamilton et al. (Reference Hamilton, Kim and Waleffe1995): mode  $(0,1)$, which is related to the appearance of streaks; and mode
 $(1,0)$, which emerge once the amplitude of mode
 $(0,1)$ decreases, characterising streak breakdown (Hamilton et al. Reference Hamilton, Kim and Waleffe1995). Applying the Reynolds decomposition, we will consider an expansion around the mean flow, averaged over streamwise and spanwise directions and in time, so that each component of the velocity can be written as the sum of mean and fluctuation fields (
 $U_i+\tilde {u}_i$), with
 $U_i$ denoting the mean velocity profile and the tilde indicating fluctuations in time domain. Thus, we can write the incompressible Navier–Stokes equations for the fluctuations as
 \begin{equation} \frac{\partial \tilde{u}_i}{\partial t} + U_j \frac{\partial \tilde{u}_i}{\partial x_j} + \tilde{u}_j \frac{\partial U_i}{\partial x_j} = -\frac{\partial \tilde{p}}{\partial x_i} + \frac{1}{Re}\frac{\partial^2 \tilde{u}_i}{\partial x_j \partial x_j} + \tilde{f}_i, \end{equation}
and the continuity equation
 \begin{equation} \frac{\partial \tilde{u}_i}{\partial x_i}=0, \end{equation}
where Einstein summation is implied,  $\tilde {u}_i$ are the three velocity components,
 $\tilde {p}$ is the pressure and the forcing term
 $\tilde {f}_i$ is considered to gather the nonlinear terms of the Navier–Stokes equations,
 \begin{equation} \tilde{f}_i = -\tilde{u}_j\partial \tilde{u}_i/\partial x_j + \overline{\tilde{u}_j\partial \tilde{u}_i/\partial x_j},\end{equation}
where  $\overline {\tilde {u}_j\partial \tilde {u}_i/\partial x_j}$ is the mean Reynolds stress, which is only be present in the zero-frequency/zero-wavenumber equation (i.e. the mean-flow equation, which is the Reynolds averaged Navier–Stokes equation). Taking the Fourier transform in
 $x$,
 $z$ and
 $t$, and considering that the mean flow has only the streamwise component
 $U(\kern-0.05em y)$, leads to
 \begin{gather} -\textrm{i} \omega u + \textrm{i} \alpha U u + v \frac{\partial U}{\partial y} = -\textrm{i} \alpha p + \frac{1}{Re}\left(-\alpha^2-\beta^2+\frac{\partial^2}{\partial y^2}\right) u + f_x, \end{gather}
 \begin{gather}-\textrm{i} \omega v + \textrm{i} \alpha U v = -\frac{\partial p}{\partial y} + \frac{1}{Re}\left(-\alpha^2-\beta^2+\frac{\partial^2}{\partial y^2}\right) v + f_y, \end{gather}
 \begin{gather}-\textrm{i} \omega w + \textrm{i} \alpha U w = -\textrm{i} \beta p + \frac{1}{Re}\left(-\alpha^2-\beta^2+\frac{\partial^2}{\partial y^2}\right) w + f_z, \end{gather}
 \begin{gather}\textrm{i} \alpha u + \frac{\partial v}{\partial y} + \textrm{i} \beta w =0, \end{gather}
where  $\omega$ is the frequency,
 $(u,v,w,p)$ are the Fourier transformed perturbation quantities and
 $(f_x,f_y,f_z)$ the Fourier transforms of
 $\tilde {f}_i$. From the equations above, we can write the incompressible Navier–Stokes equations for the perturbations in the wavenumber and frequency domain in an input–output form as
 \begin{equation} -\textrm{i} \omega {\boldsymbol{H}} \boldsymbol{q} ={\boldsymbol{A}} \boldsymbol{q} + \boldsymbol{f}\!, \end{equation}
where 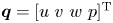 $\boldsymbol {q} =[u \ v \ w \ p]^{\textrm {T}}$ is the output and
 $\boldsymbol {f}=[f_x \ f_y \ f_z \ 0]^{\textrm {T}}$ is the forcing term (input). The matrix
 ${\boldsymbol {A}}$ is the linear operator defined by Navier–Stokes and continuity equations (which is a function of the streamwise and spanwise wavenumbers
 $\alpha$ and
 $\beta$) and the matrix
 ${\boldsymbol {H}}$ is defined to zero the time derivative of the pressure. This can be rewritten in the usual resolvent form:
 \begin{gather} (-\textrm{i} \omega {\boldsymbol{H}} - {\boldsymbol{A}}) \boldsymbol{q} = \boldsymbol{f}\!, \end{gather}
 \begin{gather}\Rightarrow {\boldsymbol{L}} \boldsymbol{q} = \boldsymbol{f}\!, \end{gather}
 \begin{gather}\Rightarrow \boldsymbol{q} = {\boldsymbol{L}}^{-1} \boldsymbol{f} = {\boldsymbol{R}} \boldsymbol{f}\!. \end{gather}
With the equations written in this shape, optimal forcings and responses (in the linear framework, based on linearisation of the Navier–Stokes equations around the mean flow) can be obtained for a turbulent flow by performing a singular value decomposition of the resolvent operator, which leads to orthogonal bases for responses  $\boldsymbol {q}_i$ and forcings
 $\boldsymbol {f\!}_i$, related by gains
 $s_i$. The singular value decomposition considers the weighting matrix corresponding to Clenshaw–Curtis quadrature associated to the Chebyshev weights in the present grid (Trefethen Reference Trefethen2000).
Optimal response and the respective gain from resolvent analysis are directly comparable to the most energetic structures in the flow if the forcing is considered to be statistically white in space (Towne et al. Reference Towne, Schmidt and Colonius2018a). In order to consider the actual statistics of the flow in this framework, we define the covariance matrices of the response  ${\boldsymbol {S}}=\mathcal {E}(\boldsymbol{q q}^H)$ and of the forcing
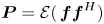 ${\boldsymbol {P}}=\mathcal {E}(\,\boldsymbol{f f}^H)$, and
 $\mathcal {E}$ representing the expected value of a signal, which is computed by averaging realisations in the Welch method (taking the block average of
 $\boldsymbol {q} \boldsymbol {q}^H$ as a function of frequency). Following Towne et al. (Reference Towne, Schmidt and Colonius2018a) and Cavalieri et al. (Reference Cavalieri, Jordan and Lesshafft2019), these quantities are related via
 \begin{equation} \left.\begin{gathered} \boldsymbol{q} \boldsymbol{q}^H = {\boldsymbol{R}} \boldsymbol{f} \boldsymbol{f}^H {\boldsymbol{R}}^H, \\ \mathcal{E}(\boldsymbol{q} \boldsymbol{q}^H) = {\boldsymbol{R}} \mathcal{E}(\boldsymbol{f} \boldsymbol{f}^H) {\boldsymbol{R}}^H, \\ {\boldsymbol{S}}={\boldsymbol{R}} {\boldsymbol{P}} {\boldsymbol{R}}^H. \end{gathered}\right\} \end{equation}
If it is assumed that the covariance of the forcing is uncorrelated in space then  ${\boldsymbol {P}} = \mathrm {I}$ and the covariance of the response is given by
 ${\boldsymbol {S}}={\boldsymbol {R}} {\boldsymbol {R}}^H$. Therefore, if the statistics of the forcing follows this hypothesis, the spectral proper orthogonal decomposition (SPOD) modes, defined by the eigenfunctions of
 \begin{equation} \int_{-1}^1 {\boldsymbol{S}}(\kern-0.05em y,y',\omega) \boldsymbol{q}_{SPOD}(\kern-0.05em y',\omega)\,\textrm{d} y' = \sigma \boldsymbol{q}_{SPOD}(\kern-0.05em y,\omega) \end{equation}
are identical to response modes (left singular vectors of  ${\boldsymbol {R}}$). For more details on this derivation, the reader should refer to Towne et al. (Reference Towne, Schmidt and Colonius2018a) and Cavalieri et al. (Reference Cavalieri, Jordan and Lesshafft2019). As in the computation of resolvent modes, SPOD modes are computed numerically with the inclusion of integration weights (Schmidt et al. Reference Schmidt, Towne, Rigas, Colonius and Brès2018), such that flow structures resulting from both analyses can be directly compared with each other.
However, non-white forcing covariance (which must be the case in turbulent flows) must be included in the formulation in order to correctly educe the response statistics. The inclusion of  ${\boldsymbol {P}}$ can be done in several ways. One of them is to directly compute the nonlinear terms of the Navier–Stokes equations from simulation data. Other approaches include modelling the forcing starting from specific assumptions on the flow case (Moarref et al. Reference Moarref, Sharma, Tropp and McKeon2013), its identification from limited flow information (Zare et al. Reference Zare, Jovanović and Georgiou2017; Towne, Yang & Lozano-Durán Reference Towne, Yang and Lozano-Durán2018b), and modelling by means of an eddy viscosity included in the linear operator (Tammisola & Juniper Reference Tammisola and Juniper2016; Morra et al. Reference Morra, Semeraro, Henningson and Cossu2019).
The present work focuses on exploring different forcing covariances and their effect on the covariance of the response. The first approach is to simply consider the forcing to be uncorrelated in space; for this case, previous analyses for wall-bounded flows has shown that even though reasonable agreement may be obtained for near-wall fluctuations (Abreu et al. Reference Abreu, Cavalieri, Schlatter, Vinuesa and Henningson2019), a mismatch is observed for large-scale structures (Morra et al. Reference Morra, Semeraro, Henningson and Cossu2019). One can also compute the nonlinear terms directly from a numerical simulation and then determine accurately  ${\boldsymbol {P}}$. If the simulation is converged and the signal processing is done properly, the result of (2.9) using the actual forcing covariance
 ${\boldsymbol {P}}$ (in the sense that this quantity is directly obtained from the simulation) should be equal to the response covariance
 ${\boldsymbol {S}}$ computed from the same simulation.
3. Reconstruction of response statistics from the full forcing CSDs
3.1. Connection between forcing and response statistics: role of the correction due to windowing
Although (2.9) is exact, if  ${\boldsymbol {P}}$ and
 ${\boldsymbol {S}}$ are estimated from a finite set of data, large errors arise in the velocity statistics recovery process using the resolvent operator, leading to non-negligible values for
 ${\boldsymbol {S}}-{\boldsymbol {R}}{\boldsymbol {P}}{\boldsymbol {R}}^H$. From the analysis of Martini et al. (Reference Martini, Cavalieri, Jordan and Lesshafft2019) (summarised in appendix A for the present case), application of windowing in the data (which is necessary for applying Welch's method) generates extra force-like terms that must be accounted to have the correct input–output relation, so that (2.9) holds for the estimated covariances. The impact of these extra terms can be measured as
 \begin{equation} Error = \frac{||{\boldsymbol{S}}_{rec} - {\boldsymbol{S}}||}{||{\boldsymbol{S}}||}, \end{equation}
where  ${\boldsymbol {S}}_{rec}$ is the covariance of the response recovered from the statistics of the forcing using (2.9), applied for both uncorrected and corrected forcing terms; the norm was chosen as the standard 2-norm for matrices. Similarly, the effect of the correction on the covariance of the forcing can be evaluated by the metric
 \begin{equation} \epsilon=\frac{||{\boldsymbol{P}}_{DNS+c}-{\boldsymbol{P}}_{DNS}||}{||{\boldsymbol{P}}_{DNS+c}||}, \end{equation}
where  ${\boldsymbol {P}}_{DNS}$ denotes the covariance of the forcing obtained from the simulation without correction, and
 ${\boldsymbol {P}}_{DNS+c}$ denotes the corrected covariance. With these metrics, we can evaluate how this correction term affects the process of recovering
 ${\boldsymbol {S}}$ from
 ${\boldsymbol {P}}$. The comparison of the errors with and without this correction term is shown in figure 3(a) for the two Fourier modes studied in this work.
Effect of the correction term in the recovery of  ${\boldsymbol {S}}$ and on the forcing covariance
 ${\boldsymbol {P}}$. Spectra normalised by
 ${\rm \Delta} \omega$. (a) Response CSDs error norm and (b) influence on
 ${\boldsymbol {P}}$.

From figure 3(a), we can see that the correction affects a wide range of frequencies, with a slightly lower effect in higher frequencies. Following Martini et al. (Reference Martini, Cavalieri, Jordan and Lesshafft2019), we can divide the aliasing error into two components: the first is due to spectral content at frequencies higher than the Nyquist frequency, and the other is due to the window spectral leakage, which generates extra content above the Nyquist frequency. Only the latter can be reduced with a proper choice of windowing function. The aliasing behaviour of the error explain the larger errors obtained at higher frequencies in figure 3(a), and indicates that the first type of aliasing is dominant in that region. As this work will focus on the study of low-frequency structures, no further effort is made in order to reduce the error in higher frequencies; moreover, since the normalised errors are below  $10^{-4}$ in all cases, an optimisation of the window was deemed unnecessary for our purposes.
A similar trend is found for the influence of the correction on the covariance of the forcing, shown in figure 3(b). The correction strongly affects the lower frequency region, but most of this covariance is still dominated by the nonlinear terms of the Navier–Stokes equations. As  $\epsilon$ is only a fraction of the overall forcing, it is thus meaningful to study the forcing covariance
 ${\boldsymbol {P}}$ in an attempt to simplify it, keeping in mind that once predictions of the response
 ${\boldsymbol {S}}$ are needed one needs to account for the correction term.
The correction greatly improves the recovery process for all modes, leading to a reduction of the error of about five orders of magnitude for the two considered modes, which is possibly related to the low-order dynamics of the flow for this combination of wavenumbers, a feature that will be further explored in §§ 4.1 and 4.2. The effect of the correction on the shapes of each case will be studied in the next section.
The role of the forcing terms is studied throughout this work. All the comparisons between forces and responses will implicitly consider the correction term, unless otherwise stated. In all other contexts ‘external force’ will refer only to the term  $\boldsymbol {f}\!$, without considering the correction term.
3.2. Comparison with statistics from white-noise forcing and no correction
Here, we analyse the effect of the different choices of forcing CSDs  ${\boldsymbol {P}}$ on the velocity statistics. As stated previously, we focus on very low frequencies in order to evaluate the effect of the statistics of the nonlinear terms on the most energetic streaks, and on the equivalent structures for other combinations of wavenumbers. For that reason, we choose
 $\omega =0.0123$ for the analysis of modes
 $(0,1)$ and
 $(1,0)$; this is the first non-zero frequency from the Welch method for the present case (this frequency can be seen as the limit
 $\omega \to 0$ in this analysis). This frequency was chosen so as to analyse the behaviour of the very large, almost time-invariant structures observed in the minimal flow unit. Analogous structures have been identified by a number of authors (Komminaho et al. Reference Komminaho, Lundbladh and Johansson1996; Tsukahara, Kawamura & Shingai Reference Tsukahara, Kawamura and Shingai2006; Pirozzoli, Bernardini & Orlandi Reference Pirozzoli, Bernardini and Orlandi2011, Reference Pirozzoli, Bernardini and Orlandi2014; Lee & Moser Reference Lee and Moser2018) for turbulent Couette flow at higher Reynolds numbers. For the present low Reynolds number, these large structures have the same characteristic length of the near-wall streaks; since they have the same overall behaviour, it becomes harder to separate these in such a small box. The analysis of Rawat et al. (Reference Rawat, Cossu, Hwang and Rincon2015) indicates nonetheless that the minimal flow unit streaks become very large-scale structures in turbulent Couette flow if continuation methods are applied. Therefore, the analysis of mode
 $(n_\alpha ,n_\beta )=(0,1)$ should be seen as a study of the overall dynamics of the largest streaks in Couette flow.
Figure 4 shows the comparison between the absolute value of the main diagonal of  ${\boldsymbol {S}}$, which corresponds to the PSD of the three velocity components. We consider the response CSD of case
 $(n_\alpha ,n_\beta )=(0,1)$ using the statistics of the forcing obtained from the simulation without any correction (
 ${\boldsymbol {P}}_{DNS}$), that considering the correction term (
 ${\boldsymbol {P}}_{DNS+c}$) and that using the white noise
 ${\boldsymbol {P}}=\gamma \mathrm {I}$ (with constant
 $\gamma$ chosen so as to match the maximum PSD for this frequency). It can be seen that the shape of the main component (streamwise velocity
 $u$) can be fairly well reproduced by simply using
 ${\boldsymbol {P}}=\gamma \mathrm {I}$. Streaks are represented, with peak amplitudes distant of about
 $0.4$ from the wall; this may be related to the higher shear near the walls, as shown in figure 1, leading to a stronger lift-up mechanism in that region. Considering white-noise forcing, we can see some discrepancies in the amplitudes and in some details of the shapes of the streamwise vortices (
 $v$ and
 $w$ components). Despite acknowledging the origin of the forcing terms as arising from triadic interactions, resolvent analysis as formulated by McKeon & Sharma (Reference McKeon and Sharma2010) assumes white-noise forcing statistics, predicting thus streamwise vortices and streaks that are in reasonable agreement with the DNS, although with a mismatch in the relative amplitudes of
 $u$,
 $v$ and
 $w$ components; similar results were obtained for turbulent pipe flow by Abreu et al. (Reference Abreu, Cavalieri, Schlatter, Vinuesa and Henningson2019). This will be explored in more detail in § 4.1. For an accurate quantitative comparison, the statistics of the nonlinear terms should be used; by doing that without the correction, the overall relative levels are closer to that from the simulation, but the amplitudes are still off, especially at the peak of each component (which explains the errors seen in figure 3). When the correction is taken into account, the exact shapes are recovered for all components, without any rescaling.
Response  ${\boldsymbol {S}}$ from simulation and from the recovery process using different
 ${\boldsymbol {P}}$ (white noise, uncorrected and corrected) for case
 $(n_\alpha ,n_\beta )=(0,1)$. Prediction using white-noise
 ${\boldsymbol {P}}$ was scaled to match the maximum of
 ${\boldsymbol {S}}$ by the factor
 $\gamma =1.029\times 10^{-4}$. (a) Streamwise component, (b) wall-normal component and (c) spanwise component.

The same process was carried out for case  $(1,0)$, and the results can be seen in figure 5. For this combination of wavenumbers, the flow is dominated by the spanwise velocity component, and the energy of the other velocity components are several orders of magnitude lower, as shown in figure 5. The dominance of
 $w$ for the (1,0) mode was also observed by Smith, Moehlis & Holmes (Reference Smith, Moehlis and Holmes2005); analysis of spectral density of turbulent channels also shows that structures with large spanwise extent are observed for
 $w$ (del Álamo & Jiménez Reference del Álamo and Jiménez2003). By considering white-noise statistics of the forcing, this dominance of spanwise velocity fluctuations could not be captured, and all components predicted by
 ${\boldsymbol {R}}{\boldsymbol {R}}^H$ have the same overall levels, leading to large errors for the
 $(u,v)$ components. For the spanwise component, however, the position of the peak and the shape of
 ${\boldsymbol {S}}$ at the centre of the domain is roughly captured by the method, even though larger errors are found for regions closer to the wall. These facts altogether point out to an action of the nonlinear terms in forcing mainly in the spanwise direction, with a more effective action closer to the wall (highlighted by the higher amplitude of the response around
 $y=0.4, 1.6$). By including the uncorrected statistics of the forcing,
 ${\boldsymbol {P}}_{DNS}$, the problem of the relative amplitudes of the different components is solved; now the spanwise component dominates the response, and its shape resembles that obtained directly from the simulation, even though a slight mismatch is found in the centre of the channel. This comparison is further improved by including the correction term in the statistics of the forcing; by using it, a perfect match between
 ${\boldsymbol {S}}$ computed from the simulation and the one from the forcing statistics is obtained, and the normalised error for this case is lower than
 $10^{-5}$.
Response  ${\boldsymbol {S}}$ from simulation and from the recovery process using different
 ${\boldsymbol {P}}$ (white noise, uncorrected and corrected) for case
 $(n_\alpha ,n_\beta )=(1,0)$. Prediction using white-noise
 ${\boldsymbol {P}}$ was scaled to match the maximum of
 ${\boldsymbol {S}}$ by the factor
 $\gamma =3.6295 \times 10^{-5}$. (a) Streamwise component, (b) wall-normal component and (c) spanwise component.

4. Analysis of the forcing CSD
The previous analysis detailed the full response statistics recovery process, aiming at obtaining accurately the response statistics from the full statistics of the nonlinear terms of the Navier–Stokes equations. However, the structure of the nonlinear terms can be complex, and analysis of the full nonlinear term can hardly lead to clear physical insight about the flow turbulent dynamics. For this reason, it would be interesting to simplify the forcing, with an evaluation of which components are mostly responsible for the energy of the response. This is performed in this section for wavenumbers  $(n_\alpha ,n_\beta )=(0,1)$ and
 $(1,0)$. The present analysis can uncover some of the physical mechanisms behind the action of the nonlinear terms of the Navier–Stokes equations in the linearised operators, which can be useful in the design of turbulence models. Thus, in this section we analyse the structure of the nonlinear terms from the DNS, evaluating their relevant characteristics and performing simplifications whenever possible. The focus is on vanishing frequency,
 $\omega \to 0$, but other frequencies are considered in appendix B.
We highlight that the calculated response  ${\boldsymbol {S}}$ always include the effect of forcing correction, whereas the forcing statistics
 ${\boldsymbol {P}}$ and associated modes are shown without correction. This provides a compatibility between forces and responses via the resolvent operator. All simplifications of the nonlinear terms are performed prior to the addition of the correction term. If responses are written as
 \begin{equation} \boldsymbol{q} = {\boldsymbol{R}} (\boldsymbol{f} + \boldsymbol{f\!}_{c}), \end{equation}
where  $\boldsymbol {f}$ is the forcing computed from the nonlinear terms of the Navier–Stokes equations, and
 $\boldsymbol {f\!}_c$ is the correction term, simplifications are sought exclusively for
 $\boldsymbol {f\!}$, which gathers the relevant terms in the turbulence dynamics.
4.1. Case  $(n_\alpha ,n_\beta )=(0,1)$

4.1.1. Contribution of each component of the nonlinear terms
In this section we analyse more closely the structure of the nonlinear terms for the case  $(0,1)$ for
 $\omega \to 0$ (
 $\omega =0.0123$). Our objective here is to look closely at the forcing statistics in order to isolate the important parts for this simple case. The number of components of the nonlinear terms, as defined in (2.3), makes an ad hoc modelling approach prohibitive; still, if only certain parts of the forcing are necessary to reproduce the statistics of the response, modelling can be considered an option. Specifically for the case
 $(n_\alpha ,n_\beta )=(0,1)$, the momentum equations (2.4b) and (2.4c) (
 $v$ and
 $w$) decouple from the streamwise velocity, and these equations become also independent of the mean flow
 $U$. That allows us to rearrange the system in order to obtain separate equations for streamwise vortices (concentrated in the
 $v,w$ components) and streaks (concentrated in the
 $u$ component) as
 \begin{align} & \underbrace{\left[-\textrm{i} \omega +\frac{1}{Re} \left(\beta^2-\frac{\partial^2}{\partial y^2}\right)\right]}_{{\boldsymbol{L}}_{01}} \underbrace{\left(\beta^2-\frac{\partial^2}{\partial y^2}\right)}_{{\boldsymbol{B}}_{01}} v = \textrm{i}\beta\left(-\textrm{i}\beta f_y+\frac{\partial f_z}{\partial y}\right) \nonumber\\ &\quad =\left(\beta^2-\frac{\partial^2}{\partial y^2}\right) f_y + \frac{\partial}{\partial y} \underbrace{\left( \frac{\partial f_y}{\partial y} + \textrm{i}\beta f_z \right)}_{\text{zero response}} \nonumber\\ &\quad \Rightarrow {\boldsymbol{L}}_{01} {\boldsymbol{B}}_{01} v={\boldsymbol{B}}_{01}\, f_y, \end{align}
 \begin{align} &\left[-\textrm{i} \omega +\frac{1}{Re}\left(\beta^2-\frac{\partial^2}{\partial y^2}\right)\right] u = f_x - v \frac{\partial U}{\partial y} \Rightarrow {\boldsymbol{L}}_{01} u = f_x - v \frac{\partial U}{\partial y}, \end{align}
where the influence of the spanwise component of the forcing is already considered in (4.2), by considering that only the solenoidal part of the forcing leads to a response in velocity; inspection of the linear operators in the Orr–Sommerfeld-Squire formulation (Jovanovic & Bamieh Reference Jovanovic and Bamieh2005) confirms that hypothesis, which was also verified by Rosenberg & McKeon (Reference Rosenberg and McKeon2019) and Marsden & Chorin (Reference Marsden and Chorin1993). The spanwise component  $w$ can be obtained from
 $v$ using the continuity equation. The linear optimal response of (4.2) for
 $\omega \to 0$ are streamwise vortices (as obtained from resolvent analysis), and these structures are independent of the mean flow chosen for the analysis, since the operators
 ${\boldsymbol {L}}_{01}$ and
 ${\boldsymbol {B}}_{01}$ do not depend on
 $U$. The effect of
 $U$ is seen directly in the equation of the streamwise velocity, via the
 $v ({\partial U}/{\partial y})$ term, which is related directly with the lift-up effect: due to the presence of shear, these vortices will lead to the growth of streamwise velocity, which will assume the shape of streaks. One should note that there are two forcing terms on the right-hand side of (4.3), which force directly the streaks; we would like to evaluate the influence of each one in the response. For that, we can rewrite the equation as a function of the expected value of
 $u$ as
 \begin{gather} {\boldsymbol{L}}_{01} \mathcal{E} (u u^H) {\boldsymbol{L}}_{01}^H = \mathcal{E}\left[ \left(f_x - v \frac{\partial U}{\partial y} \right) \left( f_x - v \frac{\partial U}{\partial y} \right)^H\right], \end{gather}
 \begin{gather}{\boldsymbol{S}}_{xx}={\boldsymbol{R}}_{01} \left[ {\boldsymbol{P}}_{xx} + \left(\frac{\partial U}{\partial y}\right) {\boldsymbol{S}}_{yy} \left(\frac{\partial U}{\partial y}\right)^H - \mathcal{E} (f_x v^H)\left(\frac{\partial U}{\partial y}\right)^H - \left(\frac{\partial U}{\partial y}\right) \mathcal{E} (v f_x^H) \right] {\boldsymbol{R}}_{01}^H, \end{gather}
where  ${\boldsymbol {R}}_{01}$ is the resolvent operator associated with
 ${\boldsymbol {L}}_{01}$. The equation above shows that the statistics of the streamwise velocity can be educed from the statistics of the wall-normal velocity (which in turn can be obtained from the statistics of
 $f_y$), from the statistics of the streamwise component of the forcing
 $f_x$ and from the cross-term statistics. Using the values obtained from the DNS, we can evaluate the influence of each term on the right-hand side of (4.5):
 ${\boldsymbol {P}}_{xx}$ is related to the statistics of the streamwise component of the forcing;
 $({\partial U}/{\partial y}) {\boldsymbol {S}}_{yy} ({\partial U}/{\partial y})^H$ is related to statistics obtained using only the lift-up mechanism; the other components are the covariances between streamwise forcing and wall-normal velocity.
Figure 6(a–e) shows the reconstruction of  ${\boldsymbol {S}}_{xx}$ using each term of (4.5) (just the real part is shown). As expected, the reconstruction using all terms reproduces the results from the DNS; on the other hand, if we take only the term related to the lift-up mechanism, the shapes of
 ${\boldsymbol {S}}_{xx}$ differ, especially considering the position of the peaks. The same happens when we use only the term related to the statistics of the forcing in the streamwise direction, or when we use only the cross-terms (which have a negative contribution of the sum). Still, the sum of all these quantities generates a combination of constructive–destructive influence on
 ${\boldsymbol {S}}_{xx}$, leading to the correct shape and amplitude, when all terms are considered. This can be better understood by looking at PSD (which is the main diagonal of
 ${\boldsymbol {S}}$) using each term, compared with DNS results. This is shown in figure 6(f), where we can see that, even though the amplitudes of each component are high, the final result considering all terms is rather small, and the contribution of the cross-term seems to be responsible for this overall reduction. The negative effect of the cross-term thus represents a destructive interference between the lift-up mechanism and the direct excitation of streaks by the streamwise forcing component. This effect cannot be appropriately modelled when the forcing is considered as white noise, as seen in § 3.2.
Real part of the streamwise component of  ${\boldsymbol {S}}$ from simulation (a) and the prediction using different forcing terms (b–e). Contribution of each term in the reconstruction (f). (a) Simulation; (b) all components of
 ${\boldsymbol {P}}_{DNS}$; (c) lift-up component; (d) streamwise forcing component; (e) cross-terms; and (f) sum of the contributions.

This analysis highlights that consideration of isolated mechanisms (such as lift-up only or streamwise forcing only) may lead to quantitative errors in the prediction of flow responses. Similar results were obtained by Freund (Reference Freund2003), Bodony & Lele (Reference Bodony and Lele2008) and Cabana, Fortuné & Jordan (Reference Cabana, Fortuné and Jordan2008) in studies of sound generation by a sheared flow, using Lighthill's acoustic analogy. The cited works showed that when source terms, analogous to the forcing CSD  ${\boldsymbol {P}}$ considered here, are decomposed into subterms, an analysis of the isolated contribution of each one may be problematic, as destructive interference between components may lead to a summed radiation which is lower than the individual contributions. In the context of wall-bounded flows, Rosenberg & McKeon (Reference Rosenberg and McKeon2019) also noticed a similar destructive interference phenomenon for the terms composing the
 $\langle uv \rangle$ Reynolds stress for an exact coherent state in channel flow. The authors pointed out that modes forced by different mechanisms may have a similar absolute value but opposite phase, leading to a smaller amplitude for the quantity, similar to the behaviour observed in figure 6(f). The present analysis shows that a similar effect occurs in the analysis of the streamwise velocity covariance in turbulent Couette flow.
4.1.2. Contribution of each component of the nonlinear terms
From the preceding analysis we can understand that all components (lift-up related and streamwise forcing) are important to obtain good predictions of  ${\boldsymbol {S}}$. Nevertheless, some simplification can still be performed on the forcing terms by rewriting them as the sum of the nonlinear terms of the Navier–Stokes equations. Overall, these terms can be written as
 \begin{equation} \tilde{f}_i-\overline{\tilde{u}_j\partial \tilde{u}_i/\partial x_j}=\tilde{f}_i-\bar{f}_i=-\tilde{u}_j \frac{\partial \tilde{u}_i}{\partial x_j}, \end{equation}
where 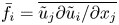 $\bar {f}_i=\overline {\tilde {u}_j\partial \tilde {u}_i/\partial x_j}$ are the mean Reynolds stresses. This relation can be written in vector form as
 \begin{equation} \boldsymbol{\tilde{f}} - \boldsymbol{\bar{f}}= \begin{pmatrix} \tilde{f}_x - \bar{f}_x \\ \tilde{f}_y - \bar{f}_y \\ \tilde{f}_z - \bar{f}_z \end{pmatrix} = -\tilde{u} \begin{pmatrix} \dfrac{\partial \tilde{u}}{\partial x} \\ \dfrac{\partial \tilde{v}}{\partial x} \\ \dfrac{\partial \tilde{w}}{\partial x} \end{pmatrix} - \tilde{v} \begin{pmatrix} \dfrac{\partial \tilde{u}}{\partial y} \\ \dfrac{\partial \tilde{v}}{\partial y} \\ \dfrac{\partial \tilde{w}}{\partial y} \end{pmatrix} - \tilde{w} \begin{pmatrix} \dfrac{\partial \tilde{u}}{\partial z} \\ \dfrac{\partial \tilde{v}}{\partial z} \\ \dfrac{\partial \tilde{w}}{\partial z} \end{pmatrix} =\boldsymbol{\tilde{f}\!}_u+\boldsymbol{\tilde{f}\!}_v+\boldsymbol{\tilde{f}\!}_w. \end{equation}
Individual terms are evaluated in physical space and transformed to frequency–wavenumber space afterwards. In the following analysis, force correction terms are always added after the simplifications, ensuring that the relation between forcing and response still holds exactly, if all components of the forcing are included. Considering the correction in the analysis will also isolate the effect of changing the characteristics of the nonlinear terms on the response. Writing the forcing this way allows us to decompose  ${\boldsymbol {P}}$ into nine components, related to each of the three forcing terms in (4.7) and extract the relevant parts of this term. Due to the low number of forcing components to evaluate, we chose to remove some of them by trial and error, in order to evaluate the influence of those in the statistics of the response. A first analysis shows that
 $\boldsymbol {\tilde {f}\!}_u$ does not play a significant role in this case, as predictions of the shapes of
 ${\boldsymbol {S}}$ disregarding this term did not lead to any considerable mismatch. The terms
 $\tilde {v}({\partial \tilde {v}}/{\partial y})$ and
 $\tilde {v}({\partial \tilde {w}}/{\partial y})$ are also less relevant for this case. This reduces the forcing to
 \begin{equation} \boldsymbol{\tilde{f}\!}_{red} - \boldsymbol{\bar{f}\!}_{red}= -\tilde{v} \begin{pmatrix} \dfrac{\partial \tilde{u}}{\partial y} \\ 0 \\ 0 \end{pmatrix} - \tilde{w} \begin{pmatrix} \dfrac{\partial \tilde{u}}{\partial z} \\ \dfrac{\partial \tilde{v}}{\partial z} \\ \dfrac{\partial \tilde{w}}{\partial z} \end{pmatrix} =\boldsymbol{\tilde{f}\!}_{v_x}+\boldsymbol{\tilde{f}\!}_w. \end{equation}
This is the maximum simplification that the covariance of the forcing can suffer in order to recover the covariance of the response without introduction of significant error in its shape. A final evaluation of the influence of the reduction is performed in § 4.1.3, showing that the most energetic structures of the flow for these reduced covariances are virtually unchanged.
The CSD  ${\boldsymbol {S}}$ recovered using the total forcing, the reduced forcing and the white-noise forcing can be seen in figure 7. From figure 7(a–c), it is clear that the reduction of the forcing to the expression (4.8) leads to the correct amplitude distribution of the streamwise velocity CSD, with better agreement than consideration of white-noise forcing; in particular, the coherence between the two peaks in amplitude, which can be seen by the nearly identical values for
 $(\kern-0.05em y,y)$ and
 $(\kern-0.05em y,-y)$, is recovered from
 ${\boldsymbol {P}}_{red}$. Still, by retaining only the terms in (4.8), a mismatch starts to appear in the amplitudes of the reconstruction, as shown in figure 7(d).
Streamwise component of  ${\boldsymbol {S}}$ from the reconstruction using the whole forcing (a), the reduced-order forcing (b), statistical white forcing (c) and the absolute value of the diagonal of each one compared with that from the simulation (d).

4.1.3. Low rank of forcing
We now consider the most energetic structures in the flow, extracted using SPOD for this combination of frequency–wavenumber. In particular, we evaluate if forcings and responses have low rank, which may simplify the modelling. Figure 8(a) shows the eigenvalues of the SPOD of the full covariance of the forcing, the reduced one (both considering the correction in (A 5)), and the covariance of the response. Spectral proper orthogonal decomposition here amounts simply to an eigendecomposition of the mentioned CSDs, which are Hermitian by construction. In figure 8(a) we can see that there is a clear separation between the first and the following modes for these matrices; therefore, the first SPOD mode would be sufficient to represent the forcing and response. Also, the energies of the covariance of the reduced forcing  ${\boldsymbol {P}}_{red}$ are close to those of the full
 ${\boldsymbol {P}}$, which highlights the similarities between the two matrices. The comparison between the leading SPOD mode of the response (denoted as follows as SPOD-q) and the reconstruction using
 $\boldsymbol {q}={\boldsymbol {R}}\boldsymbol {f\!}_{SPOD}$ (where
 $\boldsymbol {f}_{\!SPOD}$ is the first SPOD mode of the corrected forcing, both full and reduced) is shown in figure 8(b). These plots show clearly that the leading SPOD mode of both
 ${\boldsymbol {P}}$ and
 ${\boldsymbol {P}}_{red}$ lead to close agreement with the first SPOD mode of
 ${\boldsymbol {S}}$, which confirms that the terms in (4.8) are, indeed, the dominant ones in this problem. Figure 8(b) also shows that the first resolvent mode, computed under the hypothesis of white-noise forcing, does not match the SPOD mode from the simulation, showing that the statistics of the nonlinear terms are important to match exactly the shapes of the most energetic structures of the flow (Zare et al. Reference Zare, Jovanović and Georgiou2017; Towne et al. Reference Towne, Lozano-Durán and Yang2020). The main shapes are nonetheless retrieved in the leading response mode of resolvent analysis, with
 $v$ and
 $w$ forming a streamwise vortex, as seen, for instance, in the amplitude distribution of
 $w$, with two lobes in phase opposition, and an amplified streak in
 $u$. There is a mismatch in the relative amplitudes of the streamwise vortex and the streak, which is corrected when the forcing statistics are considered.
Spectral proper orthogonal decomposition eigenvalues for  ${\boldsymbol {S}}$ and the different
 ${\boldsymbol {P}}$ used here (a) and the shapes of the leading SPOD mode of the response (SPOD-q) compared with the reconstruction using the leading SPOD mode of the forcing and the first response mode from resolvent (b).

We can also evaluate the most energetic structure of the nonlinear terms; considering that we are interested in their physical shapes, we calculated the SPOD of  ${\boldsymbol {P}}$ without the correction term. The first SPOD mode of the forcings for the considered frequency is shown in figure 9. Even though the leading mode of the full forcing has an intricate structure (especially due to the presence of an extra oscillation in the centre of the domain in the wall-normal velocity), the first SPOD mode of the reduced forcing, from (4.8), is clear, at least considering the spanwise and wall-normal components, with the shape of a streamwise vortex (also shown in figure 9(b), where the mode was reconstructed using the wavenumbers for this case). This connects directly with the conclusions drawn previously: the streamwise vortices of the response are excited by streamwise solenoidal forcing from the nonlinear terms; these vortices, in turn, feed the lift-up effect such that streaks appear in the velocity field. Considering that we are dealing with the nonlinear term of the Navier–Stokes equations, this result may be seen as surprising. The nonlinear forcing term gathers the contribution of all triadic interactions that affect the considered frequency and wavenumber, being fed by a myriad of combinations of frequencies and wavenumbers. Still, the dominant part of these nonlinear combinations in the
 $y$ and
 $z$ directions (related to the
 $\tilde {w}\partial \tilde {v} / \partial z$ and
 $\tilde {w}\partial \tilde {w} / \partial z$ terms) will generate a streamwise vortex in the forcing. However, the streamwise vortical forcing alone is not sufficient in order to match the response; a distribution of streamwise forcing, related to
 $\tilde {v}\partial \tilde {u} / \partial y$ and
 $\tilde {w}\partial \tilde {u} / \partial z$, is essential to recover the correct response. Finally, the appearance of
 $w$ in all forcing directions (in (4.8)) also shows that the spanwise velocity fluctuations greatly affects the forcing term for the mode
 $(0,1)$. Therefore, any combination of triadically interacting Fourier modes dominated by
 $w$ is likely to have a contribution to this forcing term and to the dynamics of the
 $(0,1)$ wavenumber.
Absolute value of the first SPOD mode of the full and reduced forcings (a) and the shape of the reduced forcing in the physical space (b). Colours: streamwise forcing; arrows: wall-normal and spanwise forcings.

One can also think of the most energetic structure of the forcing in light of the lift-up effect. Figure 10 shows the comparison between velocity components from the first SPOD mode and the linear optimal response mode from resolvent analysis, now rescaled to have matching wall-normal components. From this plot, it is clear that the shapes of the vortices from resolvent analysis and SPOD are in close agreement. Still, by performing such scaling, the streak associated to the resolvent response has a much larger amplitude than that from SPOD. This can be connected to the phenomenon seen in figure 9(b): considering that there are large portions of negative streamwise forcing at positions where the vertical forcing would induce a positive streak via the lift-up effect, this component of the nonlinear terms acts as a destructive interference in its peak positions, substantially decreasing the amplitude of the streaks, and slightly changing its overall wall-normal shape. Therefore, the effect of the forcing in this case is mostly to cancel the streak generated by the linear mechanism, decreasing the streak-to-vortex amplitude ratio, thus leading to the structure found in the SPOD. This is shown schematically in figure 10.
Sketch of the action of the nonlinear terms on the optimal response of mode  $(0,1)$. All quantities are defined as in figures 8(b) and 9(a), and the arrows point to the regions of the flow where the destructive interference/cancellation effect is more pronounced. Log scale is used to provide a better visualisation of the agreement between resolvent and SPOD vortices, and to highlight the amplitude mismatch between the streaks.

For the present wavenumbers, the analysis was carried out for  $\omega \to 0$. A detailed analysis for all frequencies is outside the scope of this work, but a SPOD analysis of forcing and response for other frequencies is considered in appendix B, where it is shown that the low-rank behaviour of forcing and response is observed throughout the low-frequency part of the spectrum. Thus, the importance of forcing colour is not restricted to vanishing frequencies, and most scales in the flow have low-rank forcing and response.
4.2. Case $(n_\alpha ,n_\beta )=(1,0)$

4.2.1. Contribution of each component of the nonlinear terms
We now analyse the case  $(1,0)$, also taken at the limit
 $\omega \to 0$ (
 $\omega =0.0123$, as in the previous section). Analysis of the energy related to each velocity component for this case points to a dominance of
 $w$ fluctuations for the present mode. Since the dynamics of
 $w$ is uncoupled from the rest (by inspection of (2.4c)), it is sufficient to analyse the nonlinear terms related to
 $f_z$ to recover the correct statistics of the velocity, which will also be dominated by the spanwise component, as observed in the DNS data.
The  $z$ component nonlinear terms can be written as
 \begin{equation} \tilde{f}_z - \bar{f}_z=\underbrace{-\tilde{u} \frac{\partial \tilde{w}}{\partial x}}_{\tilde{f}_u} \underbrace{-\tilde{v}\frac{\partial \tilde{w}}{\partial y}}_{\tilde{f}_v} \underbrace{-\tilde{w}\frac{\partial \tilde{w}}{\partial z}}_{\tilde{f}_w}, \end{equation}
which is already simpler than the previous case, since the full forcing term only has the contribution of only three terms. We can perform the same analysis as in the previous case and try to remove some of the terms in order to check the impact of each one in the statistics of the response. The reductions that led to similar shapes for the statistics of the response are the combinations  $\tilde {f}_u+\tilde {f}_v$ (nearly perfect agreement) and
 $\tilde {f}_u$ (mismatch in amplitude). The reconstructions of
 ${\boldsymbol {S}}$ using each of these combination of terms is shown in figure 11.
Streamwise component of  ${\boldsymbol {S}}$ from the velocity field (a), from the reconstruction using the whole forcing (b), the reduced-order forcing with
 $\tilde {f}_u+\tilde {f}_v$ (c), the reduced-order forcing with
 $\tilde {f}_u$ (d), statistical white forcing (e) and the absolute value of the diagonal of each one compared with that from the simulation (f).

As expected, the reconstruction using all components of the forcing term recovers very accurately  ${\boldsymbol {S}}$ from the simulation, as well as by using just the terms
 $\tilde {f}_u$ and
 $\tilde {f}_v$. A further reduction (using just
 $\tilde {f}_u$) also gives overall correct shapes, but an amplitude mismatch appears for the computed
 ${\boldsymbol {S}}$, as shown in figure 11(f). No other simplification led to the accurate recovery of
 ${\boldsymbol {S}}$. These plots also highlight the need of using the statistics of the forcing for the prediction of the response for this mode: figure 11(e,f) shows that consideration of white-noise statistics for the forcing leads to inaccurate shapes for the statistics of the response, even though the peak is roughly captured.
4.2.2. Low rank of forcing and response
Taking SPOD modes of  ${\boldsymbol {S}}$ and of the corrected
 ${\boldsymbol {P}}$ (both full and reduced), we obtain the gains shown in figure 12(a). It is clear that, for the present frequency, these matrices are also low rank: the first SPOD mode is at least one order of magnitude higher than the other ones, pointing out that using only the first SPOD mode is sufficient to represent the forcing and the response. In appendix B we see that such rank-1 behaviour is observed for all frequencies for the (1,0) wavenumbers.
Energies from SPOD for  ${\boldsymbol {S}}$ and the different
 ${\boldsymbol {P}}$ used here (a) and the shapes of the SPOD mode of the response compared with the reconstruction using the first SPOD mode of the forcing (b).

For a reconstruction using the first SPOD mode of the forcings, we obtain modes very close to the first SPOD mode of the response for all cases; even the more drastic reduction, considering only  $\tilde {f}_u$, leads to a close agreement with the response statistics for most positions, with a slight mismatch above the centreline. As expected, given the differences between the prediction using the white-noise
 ${\boldsymbol {P}}$ and the covariance of the response from the simulation, the first resolvent mode does not capture the correct shape of the most energetic structure in the flow, especially close to the wall.
Finally, we can also look at the shapes of the leading SPOD mode of the uncorrected forcing for this case. Figure 13 shows that the reduction of the forcing to  $\tilde {f}_u$ only does not lead to any substantial changes in the optimal forcing from SPOD; the
 $\tilde {f}_v$ component adjusts the shape of forcing structure in some specific regions, without a major role in the bulk shape. In figure 13(b) we can see the reduced forcing in the physical space. The peaks, for this case, are concentrated in regions close to the wall, which explains why the difference between resolvent and SPOD modes is more evident in these regions; since
 $f_z$ is higher in that region, the first SPOD mode also has higher amplitudes closer to the wall.
Absolute value of the first SPOD mode of the full and reduced forcings (a) and the shape of the reduced forcing f u in the physical space (b). Colours: spanwise forcing.

From these results we can see that the case  $(1,0)$ is mostly dependent on the term
 $\tilde {f}_z$. Since the forcing is mainly dependent on
 $\tilde {u}\partial \tilde {w} / \partial x$, as shown in figure 13(a), it is expected that the triadic interactions composed by terms with wavenumbers pairs with high streamwise velocity amplitudes will affect the nonlinear term more substantially. This is confirmed in the next section.
5. Relation with the self-sustaining process
This work was based on the minimal flow unit for Couette flow, the minimal computational box in which turbulence can be sustained. This case was developed by Hamilton et al. (Reference Hamilton, Kim and Waleffe1995), who also proposed a self-sustaining process for the turbulence in this simple shear flow. Considering that the structures present in this flow are ubiquitous to all shear flows, the proposed mechanism has also been extended to several other cases (see, for example, Jiménez & Pinelli (Reference Jiménez and Pinelli1999) and Schoppa & Hussain (Reference Schoppa and Hussain2002)). This can be summarised as: (i) streaks are produced as a result of the lift-up effect (Ellingsen & Palm Reference Ellingsen and Palm1975); (ii) the growth of the streaks leads to an instability in the flow, which triggers the breakdown of these structures; (iii) streamwise vortices are regenerated via a nonlinear mechanism, thus leading to a regeneration of the streaks. With this process in mind, we can explore the possible reasons why only some of the terms from the nonlinear forcing are relevant for capturing the overall low-frequency dynamics of this flow, as shown in § 4. First, it should be expected that velocity fluctuations  $\tilde {v}$ would play a role in this case, considering that the lift-up effect is the dominant phenomenon in this sheared flow. It is thus relevant to examine in detail how vertical velocity fluctuations
 $\tilde {v}$, associated to streamwise vortices in the (0,1) wavenumber, are forced by nonlinear terms. Two possible candidates for a consistent triadic interaction would be wavenumbers
 $(\pm 1,0)$ and
 $(\mp 1,1)$. As shown by Hamilton et al. (Reference Hamilton, Kim and Waleffe1995), mode (1,0) is one of the most energetic ones in this flow, and the triadic interaction between this spanwise velocity-dominated mode, and mode (1,1) (which shows no dominant velocity component) would be expected to be one of the main mechanisms of energy transfer to mode (0,1) – thus,
 $\tilde {w}^{(\pm 1,0)}\partial \tilde {u}_i^{(\mp 1,1)} / \partial z$ should be a dominant part of the forcing associated to
 $\tilde {v}^{(0,1)}$, since this is the relevant forcing component in the
 $y$ direction, as examined in § 4.1. In their reduced-order models for sinusoidal shear flow, Waleffe (Reference Waleffe1997) and Moehlis, Faisst & Eckhardt (Reference Moehlis, Faisst and Eckhardt2004) also identify that one of the forcing terms regenerating rolls is due to the nonlinear interaction between
 $(\pm 1,0)$ spanwise oscillations and
 $(\mp 1,1)$ modes.
The above arguments suggests how an interaction between  $(\pm 1,0)$ and
 $(\mp 1,1)$ modes would force the (0,1) mode. A similar argument can be formulated to explore how triadic interactions give rise to the term
 $\tilde {u}\partial \tilde {w} / \partial x$ in mode (1,0), shown to be dominant in § 4.2: since the streamwise velocity component of mode
 $(0,\pm 1)$ has a high amplitude, the triadic interaction between
 $\tilde {u}$ from this mode and
 $\partial \tilde {w}/\partial z$ from mode
 $(1,\mp 1)$ should affect the temporal evolution of mode (1,0).
Figure 14 shows some of the relevant quantities for two cycles of the present simulation. The process of generation and breakdown of streaks can be tracked by looking at the streamwise component of the velocity for mode (0,1) in figure 14(a). Streak breakdown (intermittent decay of the amplitude of  $\tilde {u}^{(0,1)}$) is closely associated to an increase of the amplitudes of
 $\tilde {v}$. Considering that the evolution of the streamwise velocity does not affect the evolution of the wall-normal component except via nonlinear terms (as shown in (4.2)), this growth in
 $\tilde {v}$ should be related to the equivalent nonlinear forcing in the
 $y$ direction. Figure 14(a) shows that the most relevant component of this forcing,
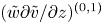 $(\tilde {w} \partial \tilde {v}/\partial z)^{(0,1)}$ (as shown in § 4.1), follows the evolution of the wall-normal velocity, with matching regions of growth/decay. Since this nonlinear forcing can be explicitly written as the sum of the triadic interaction between modes with summed wavenumbers resulting in mode (0,1), it is expected that the interaction between energetic modes should contribute greatly to this term. In fact, the nonlinear term computed from the interaction between modes
 $(\pm 1,0)$ and
 $(\mp 1,1)$ (also shown in figure 14a) seems to follow the same growth/decay trend with a similar absolute value for high-amplitude periods, pointing to a connection between the evolution of the spanwise velocity of mode (1,0) and the regeneration of vortices. Considering other triads in the analysis of a single forcing term (
 $\tilde {w} \partial \tilde {v}/\partial z$) may be misleading, since these interactions can only converge to the forcing at a given direction if all three terms are considered (as in (4.9)); there is no guarantee that interactions involving only the spanwise and wall-normal velocities will lead to
 $(\tilde {w} \partial \tilde {v}/\partial z)^{(0,1)}$; still, it is expected that adding more triads to the forcing term will lead to curves with amplitudes closer to the full forcing field from the simulation. This is exemplified in figure 14(a), where the term
 $\tilde {w}\partial \tilde {v}/\partial z$ was computed considering all triads involving modes
 $(\pm 1,0)/(\mp 1,1)$ and
 $(\pm 1,-1)/(\mp 1,2)$. It is shown that the addition of this new interaction leads to forcing amplitudes closer to that computed directly from the simulation, with regions of amplitude growth and decay already captured by the interaction between
 $(\pm 1,0)$ and
 $(\mp 1,1)$.
Integrated energy as a function of time of streamwise velocity of modes (0,1) and (0,1), and relevant nonlinear term for each combination of wavenumbers, as discussed in the text. Triadic interactions between the most energetic modes leading to the nonlinear terms for each case are also shown. Interaction between modes (1,0) and (1,1) considers the contribution of wavenumber combinations ( $-$1,0)/(1,1) and (1,0)/(
 $-$1,1), and equivalently for modes (0,1) and (1,1). Sum of all triads involving modes
 $(\pm 1,0)/(\mp 1,1)$ and
 $(\pm 1,-1)/(\mp 1,2)$ for the term
 $(\tilde {w} \partial \tilde {v}/\partial z) ^{(0,1)}$ is shown in (a). Temporal correlation coefficients between relevant components of forcing and response for each combination of wavenumbers are shown in (c). (a) Mode (0,1), (b) mode (1,0) and (c) correlation coefficient between velocity and forcing.

Similarly, the energy of mode  $(1,0)$ is basically due to
 $\tilde {w}$. It is shown in figure 14(b), where the dominant part of the forcing term for mode (1,0) and the dominant triadic interaction between modes
 $(0,\pm 1)$ and
 $(1,\mp 1)$ are also depicted. It is clear that the evolution of the spanwise velocity is closely related to the evolution of the forcing term – growth and decay regions of the velocity follow the same regions of the forcing with a time delay. For this mode, the forcing is dominated by the nonlinear term associated to the most amplified streak interacting with mode (1,1). Therefore, even though the linearised Navier–Stokes equation for
 $\tilde {w}^{(1,0)}$ does not depend on the other velocity components with the same wavenumber (as mentioned in section § 4.2), its evolution is still determined by the evolution of the streaks via nonlinear interactions. Considering that no clear forcing reduction was found for mode (1,1), the role of this mode is highlighted here as an ‘inter-wavenumber energy transferring’ mode in this dynamics, connecting streaks to the spanwise velocity mode. We show that this is a crucial element in the vortex regeneration process.
In order to quantify the time delay between the energy of forcing and response shown in figure 14(a,b), correlation coefficients between these two quantities were computed with the respective mean value subtracted. Correlations were computed for the entire time series using the main component of forcing depicted in figure 14(a,b), and the normalised results are shown in figure 14(c). Two features stand out from this plot: first, forcing and response are correlated for large time periods for both combinations of wavenumbers, highlighting the low-dimensional dynamics of this low-Reynolds-number Couette flow. The oscillatory correlations may be related to the nearly cyclic behaviour of the minimal flow unit. Second, the correlations peak at low values of time lag:  $\tau =5.5$ for (1,0), and
 $\tau =7$ for (0,1), thus confirming the expected time delay between forcing and response in this flow, with forcing that precedes the response.
In summary, energy flows from the streak (in  $\tilde {u}^{(0,1)}$) to the spanwise velocity mode via triadic interactions with mode (1,1), which leads to an increase of
 $\tilde {w}^{(1,0)}$. This growth, in turn, leads to an increase of the nonlinear forcing related to the vortices of mode (0,1), regenerating these structures. Finally, these will regenerate the streaks in the flow via the lift-up effect. This vortex regeneration mechanism is summarised in figure 15, as an addendum to the diagram proposed by Hamilton et al. (Reference Hamilton, Kim and Waleffe1995). As a consequence of that, the dynamics of the spanwise velocity for mode
 $(1,0)$ (followed closely by its main forcing component) opposes the trend of the streamwise velocity of mode
 $(0,1)$, which agrees with the analysis of streak breakdown for Couette flow performed by Schoppa & Hussain (Reference Schoppa and Hussain1999). The authors show that the streak instability is triggered by streamwise varying, low-amplitude spanwise velocity disturbances; therefore, it is expected that an increase in the
 $w$ component of the velocity will lead to the breakdown of the streaks. Hamilton et al. (Reference Hamilton, Kim and Waleffe1995) observed that the amplitudes of this component can reach the same order of magnitude of the streamwise component during streak breakdown, highlighting the importance of the underlying dynamics followed by
 $\tilde {w}^{(1,0)}$ in this flow. The relevance of this mode was further detailed in the present analysis, where its role in the nonlinear dynamics of the flow is also explored. The analysis in § 4.1 has shown that this component is essential for the recovery of the velocity statistics of streaks; the simplified forcing of (4.8) has its streamwise vortical component,
 $f_w$, strongly related to fluctuations in
 $w$. Therefore, in order to recover the energy of mode
 $(0,1)$ (thus leading to streak regeneration), higher amplitudes of spanwise velocity should be present in the flow.
Self-sustaining process in turbulence as proposed by Hamilton et al. (Reference Hamilton, Kim and Waleffe1995). The vortex regeneration mechanism obtained from nonlinear interactions analysed in the present study is shown in red. The nonlinear interaction from ‘streaks’ and ‘ $x$-dependent flow’ is associated to the saturation of streaks.

6. Conclusions
Using a DNS of a minimal flow unit, taken for turbulent Couette flow at  $Re=400$, we carried out an analysis of the nonlinear terms of the Navier–Stokes equations expanded around the mean turbulent field, built as the product of velocity fluctuations in the physical domain. It is shown that, even though resolvent response modes coming from linear analysis correspond to SPOD modes if the nonlinear terms are uncorrelated, the statistics of these terms actually play a substantial role in some cases, changing the shape of the resulting energetic modes. Therefore, a proper consideration of these statistics is necessary for high-fidelity response prediction, leading to considerable improvements over the white-noise assumption often used. By detailing the process of recovering the frequency-domain statistics of the velocity from the statistics of the nonlinear terms (treated as a forcing term, in a resolvent formulation), we managed to understand the influence of the windowing in the equations, which gives rise to new terms that must be included in the formulation, as proposed by Martini et al. (Reference Martini, Cavalieri, Jordan and Lesshafft2019); in the present work we further show the validity of this result by applying the methodology for the analysis of a turbulent flow. Most of the comparisons between SPOD and resolvent modes in the literature do not consider, to the best of our knowledge, the error due to windowing. For lower frequencies, this may lead to unexpected errors that may deteriorate the comparisons. In order to correctly evaluate the validity of the models using linear analysis, a correction term should be considered as an additional forcing (as done in the present work), or as a correction of the statistics of the velocity. For the present analysis, this error mainly affects low frequencies/wavenumbers. When the appropriate correction is included, relative errors of about
 $10^{-5}$ are obtained, which ensures the accuracy of the obtained CSDs of forcing and response for this flow.
Considering that the CSDs of forcing ( ${\boldsymbol {P}}$) and response (
 ${\boldsymbol {S}}$) are accurately related to each other by the resolvent operator, we further analysed the linearised Navier–Stokes equations in order to evaluate which parts of the forcing were relevant for the prediction of the statistics of the velocity. This was done for the two most energetic cases at low frequencies: the case
 $(n_\alpha ,n_\beta )=(0,1)$ (streaks), and
 $(n_\alpha ,n_\beta )=(1,0)$ (spanwise velocity modes). These analyses were performed for
 $\omega \to 0$, as spectra for the two wavenumbers have highest levels for the lowest frequencies, a consequence of the zero phase speed of dominant modes in Couette flow with walls moving in opposite directions. The first mode,
 $(0,1)$, is characterised by the appearance of streaks and streamwise vortices. We have shown that using spatial white noise as statistics of the forcing leads to a partial agreement between the prediciton of the covariance of the response using the resolvent operator and that obtained from the simulation; even though streamwise vortices and streaks are obtained from white-noise forcing, there is a mismatch in their relative amplitudes. The forcing is shown to act with a destructive interference between direct forcing of streaks by streamwise forcing and the lift-up mechanism, where the streamwise vortical part of the forcing leads to streamwise vortices and streaks. This behaviour is similar to that observed by Rosenberg & McKeon (Reference Rosenberg and McKeon2019) for the
 $\langle u,v \rangle$ statistics in the case of an exact coherent state in channel flows. Simplification of nonlinear terms is also possible, with four of them (among nine possible ones) leading to the bulk of the response statistics; of particular relevance is the contribution of spanwise velocity in forcing, as it appears in three of the four dominant terms.
The same process was performed for the wavenumber  $(1,0)$. The equations for this case decouple for the spanwise velocity. As this component is the most energetic one for this case, only the spanwise forcing would be needed to recover most of the covariance matrix of the response. By applying the same process as the previous case, we manage to reduce the forcing to only one term,
 $\tilde {u}\partial \tilde {w}/\partial x$. Simplification of the forcing as white noise again led to a mismatch in the predicted flow responses; here, the amplitude distribution of the forcing, which is stronger closer to the walls, is a salient feature, leading to the observed flow response. Even though no significant forcing reduction was found for mode (1,1), a connection with this oblique wave mode was also made in the self-sustaining process framework, showing that the interaction between the streaks and the (1,1) wavenumber mode dominates the excitation of mode (1,0). By analysing the nonlinear terms from the DNS, we managed to isolate dominant terms and interactions in the excitation of each mode, clarifying some of the relevant steps of the vortex regeneration process. In summary, energy is transferred from mode (0,1) (streaks) into (1,0) (spanwise velocity) through the oblique wave mode (1,1). This is followed by a second interaction, where energy is transferred from the (1,0) mode (and the oblique (1,1)) back into the (0,1) mode through the breakup of the
 $x$-dependent motions.
Even though only two wavenumbers were analysed in this work, the conclusions presented herein lead to a better understanding of the turbulence dynamics in wall-bounded flows. Instead of modelling the effects of the nonlinearities, we show the structure of the nonlinear terms explicitly, pointing out that these can be simpler than the general understanding. Moreover, the cases studied are connected to the self-sustained process in turbulence, which is considered to be one of the building blocks of the turbulent flows; knowing more about the action of the nonlinearities in such case affects the understanding about the whole dynamics. This can also support the design of new control strategies aiming to reduce turbulence levels close to walls (as in Canton et al. Reference Canton, Örlü, Chin, Hutchins, Monty and Schlatter2016), thus leading to drag reduction.
The results presented herein aim to clear the usual complexity related to dealing with the nonlinear terms. Even though these may be considered as an external forcing of the system for a simplified analysis, leading, for instance, to interesting conclusions about linear optimal responses of the system, we must keep in mind that these ‘forcing’ terms come from the dynamics of the flow. Turbulence thus leads to a particular structure, or colour, to these forcing terms, and such structure has been shown to be relevant if one wishes to obtain accurately the flow responses via resolvent analysis, as shown by several previous works (Zare et al. Reference Zare, Jovanović and Georgiou2017; Martini et al. Reference Martini, Cavalieri, Jordan, Towne and Lesshafft2020; Towne et al. Reference Towne, Lozano-Durán and Yang2020); the present work confirms these conclusions, and deepen the analysis by analysing the shapes of the most energetic structures of the forcing. It is notable that for the two considered wavenumbers, at low frequencies, the forcing CSD is of low rank, dominated by its first eigenfunction. Even though nonlinear forcings are not expected to be low rank over all frequencies and wavenumbers, especially in higher-Reynolds-number flows, the present analysis suggests that orderly structures in the forcing terms may still be found, and these can be particularly important in the dynamics of turbulent flows, such as in the self-sustained process in wall-bounded flows. A recent example is found in Morra et al. (Reference Morra, Nogueira, Cavalieri and Henningson2020), where the nonlinear forcing was shown to be rank-2 for the most energetic frequencies of channel flows at moderate Reynolds numbers ( $Re_{\tau }=180, 550$), suggesting that, even though the forcing may not be low rank over all frequencies, it has low rank for the most dynamically important frequencies of the flow. In the present Couette flow, despite the apparent complexity of the bulk of nonlinear terms, order can still be found. Such organisation contributes to the aforementioned constructive or destructive interferences in leading to flow responses. In light of the present results, it is thus relevant to understand and model how coherent structures in turbulent flows give rise to such organised nonlinear terms.
Acknowledgements
P.N. was funded by a CNPq scholarship. A.C. acknowledges financial support by CNPq (grant number 310523/2017-6). Direct numerical simulations were performed on resources provided by the Instituto Tecnológico de Aeronáutica and the Swedish National Infrastructure for Computing (SNIC) at NSC, HPC2N and PDC. P.M. acknowledge financial support by the European Research Council (ERC) under grant agreement 694452-TRANSEP-ERC-2015-AdG.
Declaration of interests
The authors report no conflict of interest.
Appendix A. Correction due to windowing
The equations shown in § 2.2 are exact when no windowing function is applied to the turbulent signals; CSDs can be obtained as Fourier transforms of the correlation function. Still, considering most applications, windowing and segment averaging are applied to time series in order to apply Welch's method for a faster determination of CSDs. As windowing is unavoidable when dealing with large datasets, one can choose the window in order to minimise spectral leakage and/or aliasing. The inclusion of a window in the signal processing, in turn, leads to the appearance of new terms in the equations. Following the formulation of Martini et al. (Reference Martini, Cavalieri, Jordan and Lesshafft2019), the linearised, time-invariant, Navier–Stokes equations,
 \begin{equation} {\boldsymbol{H}} \frac{\partial \boldsymbol{\tilde{q}}(t)}{\partial t} = {\boldsymbol{L}} \boldsymbol{\tilde{q}}(t) + \boldsymbol{\tilde{f}}(t), \end{equation}
when multiplied by a window function  $h(t)$, can be rewritten as
 \begin{equation} {\boldsymbol{H}} \frac{\partial (h(t) \boldsymbol{\tilde{q}}(t))}{\partial t} = {\boldsymbol{L}}(h(t) \boldsymbol{\tilde{q}}(t)) + (h(t) \boldsymbol{\tilde{f}}(t)) + {\boldsymbol{H}} \left(\frac{\partial h}{\partial t} \boldsymbol{\tilde{q}}\right)(t), \end{equation}
where 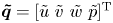 $\boldsymbol {\tilde {q}}=[\tilde {u} \ \tilde {v} \ \tilde {w} \ \tilde {p}]^{\textrm {T}}$,
 $\boldsymbol {\tilde {f}}=[\,\tilde {f}_x \ \tilde {f}_y \ \tilde {f}_z \ 0]^{\textrm {T}}$ are the response and forcing in time domain, and
 ${\boldsymbol {H}}$ is defined to disregard the derivative of the pressure in the equations. The Fourier transform of the windowed signal in each segment is given by
 \begin{equation} \boldsymbol{\hat{q}}(\omega)=\frac{1}{T}\int_{t_0}^{t_0+T} h(t) \boldsymbol{\tilde{q}}(t)\,\textrm{e}^{\textrm{i}\omega t}\,\textrm{d} t, \end{equation}
and equivalently for  $\boldsymbol {f\!}$, where
 $t_0$ denotes the initial time for each segment and
 $T$ the duration of time segments. Defining
 \begin{equation} \overline{{\boldsymbol{q}}}(\omega)=\frac{1}{T}\int_0^{\textrm{T}} \frac{\textrm{d} h(t)}{\textrm{d} t} \boldsymbol{\tilde{q}}(t)\,\textrm{e}^{\textrm{i}\omega t}\,\textrm{d} t, \end{equation}
(A 2) can be written as
 \begin{equation} (-\textrm{i} \omega {\boldsymbol{H}} - {\boldsymbol{L}}) \boldsymbol{\hat{q}} = \left(\hat{\boldsymbol{f}} + {\boldsymbol{H}}\bar{\boldsymbol{q}} \right) = \boldsymbol{\hat{f}\!}_{corr}, \end{equation}
where the right-hand side becomes the effective force of the windowed signal, which is the sum of the external driving force and the external extra term due to windowing. Equation (A 5) indicates that, even if we manage to obtain converged statistics for the forcing and the response, the fact that we multiply the signal by a window leads to a mismatch between the statistics of the response computed from the velocity fields, and the recovered statistics from the nonlinear terms (by using  ${\boldsymbol {R}}{\boldsymbol {P}}{\boldsymbol {R}}^H$). This error is well defined and is a function of the window used in the Welch method, of the operator used in the analysis and of the chosen frequency. Fundamentally the error comes from the difference between
 $\boldsymbol {q}$, the true Fourier transform of the signal and
 $\hat {\boldsymbol {q}}$, its estimate obtained with using the window
 $h(t)$, the difference also being present for
 $\boldsymbol {f\!}$. Such error is reduced when long segments are taken, which decreases the magnitude of the time derivative of the windowing function in (A 4); however, the use of sufficiently long segments for negligible correction terms is potentially prohibitive.
Appendix B. Rank of nonlinear forcing for higher frequencies
The paper focused on the analysis of the forcing statistics in the minimal Couette flow. From the full forcing statistics, reduced-order forcings based on the identification of the relevant parts of the nonlinear terms were proposed in order to simplify the analysis. One of the main outcomes of this survey was that coherent structures in the nonlinear terms could be clearly distinguished, revealing some of the dynamics behind the streak generation. In the present analysis nonlinear terms from the Navier–Stokes equations were shown to have low rank for the chosen combination of wavenumbers and frequency. Still, one should be careful when generalizing these results to flows with higher Reynolds number or to higher frequencies, since forcings can acquire further complexity as the dynamics gets more intricate. One possible limitation lies in the fact that nonlinear forcing may not be considered of low rank throughout the frequency spectrum.
Figure 16 shows the three first SPOD energies compared with the total energy from both forcing and response CSD, for wavenumbers (0,1) and (1,0), as function of frequency. The analysis in the paper considered  $\omega \to 0$, the first data point of these plots, detailed in figures 8 and 12; forcing and response are clearly of low rank for this frequency. For the case (0,1), figure 16(a,c) shows that this forcing may be considered reasonably low rank over a range of low frequencies, where elements of the present analysis are expected to hold (such as the ‘colour’ of the forcing affecting directly the streak-to-roll ratio), but the simplifications performed in § 4.1.3 may not be as straightforward. As the frequency increases, suboptimals start to become more important in the SPOD spectrum, showing that the forcing cannot be characterised by a single mode. Changes are expected to be less drastic for the case (1,0); figure 16(b,d) shows that both forcing and response have low rank for a broader range of frequencies, and modes related to suboptimal SPOD modes are less important than for the (0,1) case. Considering that this mode has a simpler dynamics, basically involving a single velocity component, the conclusions drawn in the present work can shed light on the overall influence of such mode in the flow dynamics beyond the region of vanishing frequency.
Energies from SPOD modes of  ${\boldsymbol {P}}$ and
 ${\boldsymbol {S}}$ for the different combination of wavenumbers chosen in the present analysis: (a) forcing (0,1); (b) forcing (1,0); (c) response (0,1); and (d) response (1,0).



