I. INTRODUCTION
Cyclic olefin copolymers (COCs) based on cyclic olefin monomers and ethane exhibit a wide range of desirable properties, such as a high glass-transition temperature, optical clarity, low birefringence, and low shrinkage during processing.Reference Rivers, Bolden and Grah1,Reference Khanarian and Celanese2 Based on those properties, COCs have been used as plastic lensesReference Khanarian and Celanese2 and polymer films,Reference Rivers, Bolden and Grah1 as well as in the packaging of pharmaceuticals. There is an existing research base on the thermal properties, chemical structure, and physical properties and microstructure of COCs,Reference Shin, Park, Liu, He and Kim3,Reference Liu, Yu, Sun, Zhang and He4 with fewer localized mechanical properties measurements reported on COCs.Reference Roy, Das, Yue and Hu5 Because of their ability to be formed into complex shapes using injection molding, it is possible that final parts will have nonuniform residual stresses and strains based on local variations in cooling rate.
Nanoindentation can be used to measure the local mechanical properties of both thin film and bulk materials.Reference Lawrence, Adams, Bahr and Moody6,Reference Schoeppner, Bahr, Jin, Goeke, Moody and Prasad7 Conventional analysis techniquesReference Nemecek8 can be adapted for compliant or soft materials, such as biomaterials and polymers.Reference Constantinides, Ulm and Van Vliet9–Reference Oliver and Pharr11 When indenting polymeric materials determining modulus and hardness may not fully describe the mechanical responseReference Cohen and Kalfon-Cohen12 due to the time-dependent or viscoelastic behavior of these copolymer materials.Reference Ferry13 The time-dependent behavior of materials is often assessed using indentation techniques to estimate the indentation relaxation and creep,Reference Bernard, Keryvin, Sangleboeuf and Rouxel14–Reference Stan and Fetecau16 however, dynamic nanoindentation can provide more complete information on the constitutive properties of viscoelastic materials.Reference Oyen17,Reference Yuya and Patel18 Quasi-static (QS) nanoindentation of polymers to assess viscoelasticity includes load relaxation testsReference Cheng and Cheng19 and creep tests.Reference Oyen and Cook20 Dynamic nanoindentation can be performed over a range of frequencies (on the order of 1–100's of Hz) and many materials do exhibit frequency dependent properties.Reference Herbert, Oliver and Pharr21 Recent examples in the literature have used dynamic nanoindentation to correlate the viscoelasticity and molecular weight in semiconducting polymeric filmsReference Bruner and Dauskardt22 and to accurately access the mechanical properties of materials with complicated morphology and heterogeneous microstructures.Reference Kralik and Nemecek23
Localized residual stresses can be estimated using nanoindentation techniques.Reference Suresh and Giannakopoulos24–Reference Xu and Li28 The determination of residual stress in materials impacts a wide range of engineering applications, for example the thin films on substrates,Reference Pharr and Oliver25 reinforced structural composites,Reference Xia, Riester, Curtin, Li, Sheldon, Liang, Chang and Xu26 commercial metals and alloysReference Tsui, Oliver and Pharr27 and joined components.Reference Xu and Li28 Tsui et al.Reference Tsui, Oliver and Pharr27 evaluated the effects of elastic stresses (uniaxial and biaxial) on the experimental measurement of aluminum hardness, and showed that residual stress affected the hardness determined from analysis of a load-depth curve due to the changes in pile up and sink in that lead to inaccurate relationships between the contact depth and the calibrated contact area. The actual contact area, determined via postindentation microscopy, decreases from that of a stress free surface with the application of tensile stress and increases when compressive stresses are imposed. However, they found that indentation hardness was independent of residual stress when the real contact areas, measured by optical methods, were used instead of those implied from nanoindentation analysis where the tip area function was calibrated in a material which did not pile up. Suresh and GiannakopoulosReference Suresh and Giannakopoulos24 proposed a method to measure the residual stress using conventional sharp indentation in conjunction with finite element analysis simulations to deduce the residual stresses based on the contact area implied by load-depth curves. Lee and KwonReference Lee and Kwon29 expanded on this method to address both mean stresses and deviatoric stresses, and determined a geometric factor under the assumption of that the stresses in horizontal direction are related to plastic deformation. Xu and LiReference Xu and Li30 also demonstrated the influence of residual stress on hardness.
The majority of these previous studies linking indentation behavior and residual stress have focused on metal or ceramic materials rather than “soft” materials. Moreover, the pile up around the indenter contributes a significant overestimation of the experimental data from nanoindentation due to the elastic–plastic properties of the copolymer materials.Reference Beegan, Chowdhury and Laugier31–Reference Kese, Li and Bergman34 In this regard, Oliver and PharrReference Oliver and Pharr11 specifically mentioned the importance of accounting for pile up when it comes to analyze the experimental data from nanoindentation system. Scanning probe microscopy (SPM) can be used to quantify the extent of pile up and thus to investigate the relationship of pile up behavior, applied stresses and strains, and the experimental value of reduced modulus and hardness. Of course, measuring residual impressions after the indenter is removed may also have variations if the material exhibits a viscoelastic response. This current study aims to examine the mechanical properties of commercial COCs using QS and dynamic nanoindentation tests and to estimate the correlation between applied strains and perceived mechanical properties. This work assumes that the actual modulus or hardness of these COCs is unchanged due to the moderate strains applied (≈1%), and that any differences between an applied strain condition and the measured value are due to indentation morphology changes.
II. EXPERIMENTAL
COCs can be produced by different types of cyclic monomers and polymerization methods, such as 5, 8-dimethanonaphthalene (tetracyclododecene) with ethane or ring-opening metathesis polymerization followed by hydrogenation.Reference Shin, Park, Liu, He and Kim3,Reference Liu, Yu, Sun, Zhang and He4 The materials used in this study are commercially referred to as ZEONEX 690R and ZEONOR 1020R (Zeon Chemical, Louisville, KY), and were received as polymer pellets.
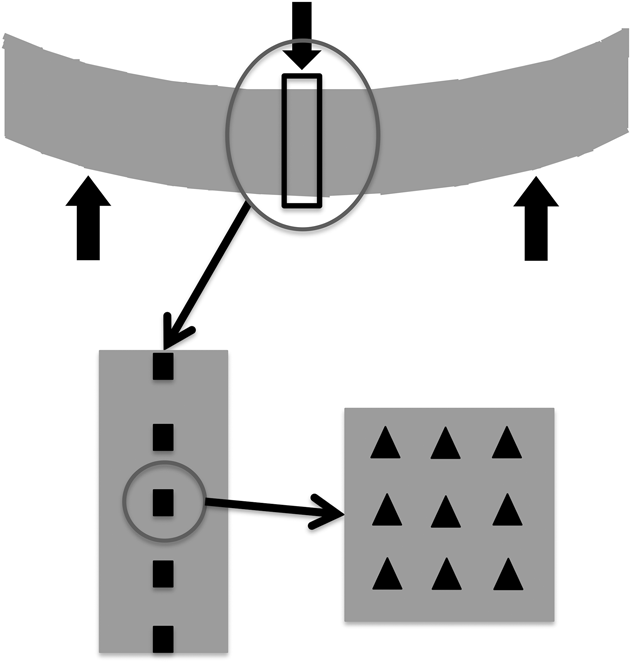
The melting temperatures of two materials were measured by differential scanning calorimetery (DSC Q2000, TA Instruments, New Castle, DE). The test specimens were fabricated by compression molding (Carver Model 3725, CARVER, Inc.) polymer pellets into plates with 6.9 MPa pressure at 100 °C for ZEONOR 1020R and 115 °C for ZEONEX 690R,35 and then cut into simple rectangular bend bar specimens (5 cm × 1 cm × 0.2 cm) after removing the plate from the molder. One sample was produced in each copolymer for three point bending testing. The specimen, shown schematically in Fig. 1, was a bend bar using simple three point bending with a strain gauge attached on the side across from the single loading pin to record the applied strain, and indentations were made on the face orthogonal to the loading direction. When loaded, the strain within the sample varies linearly from tension to compression across the midpoint of the sample. Applied strains were measured using a strain gauge (Omega, SGD-3S/120-LY13) and associated reader (Vishay, P3). An array of indents along the top horizontal surface of the sample was done to obtain the load depth curve under tensile and compressive stresses. Five regions were chosen for the indentation tests, and the strain at each position was calculated based on the average center position value of the indentation group. All the tests were performed at 25 °C and 45% relative humidity. Upon unloading from the bend fixture there was no residual strain recorded with the strain gauge.
Schematic image of the tests setup; each location marked with a square was subjected to two 8 × 8 grids of QS indentation and another grid of dynamic indentations.

QS nanoindentation experiments used a partial load/unload sequence to determine the unloading stiffness at various depths at a given point on the specimen. For each unloading segment, the peak load of a given segment (P max), the contact depth at that peak load at that segment (h c), and the slope of the partial unloading curve (S = dP max/dh c) at the point of maximum depth, were obtained. The hardness, H, of the samples at a given h c can be determined by.Reference Oliver and Pharr33
 $$H = {{{P_{\max }}} \over A}\quad ,$$
where A is the projected contact area, which can be calculated from the indenter geometry based on calibration in reference materials (typically one chooses a material which has similar pile up properties as the material of interest). The reduced indentation modulus (E r) can be calculated from
 $${E_{\rm{r}}} = {{{\rm{d}}{P_{\max }}} \over {{\rm{d}}{h_{\rm{c}}}}} \cdot {1 \over 2} \cdot {{\sqrt \pi } \over {\sqrt A }}\quad ,$$
where dP max/dh c is the slope of the partial unloading curve in the load–displacement curve after accounting for the machine compliance. The sample modulus (E s) is then determined by
 $${E_{\rm{s}}} = \left( {1 - \nu _{\rm{s}}^2} \right)\left( {{1 \over {{E_{\rm{r}}}}} - {{1 - \nu _{\rm{i}}^2} \over {{E_{\rm{i}}}}}} \right)\quad ,$$
where the subindexes “s” and “i” represent the sample and indenter, separately, and ν is the Poisson's ratio. For diamond the elastic modulus is 1249 GPa, and the Poisson's ratio is 0.07.
Nanoindentation tests were performed with a Hysitron Triboindenter 950 system (Hysitron Inc., Eden Prairie, MN). A three-sided pyramidal cube corner diamond indenter tip, having a curvature radius of ≈40 nm, was chosen to determine the pile up ratio of each indent and mechanical properties of COCs, as pile up is accentuated by the use of indenter geometries with small included angles. The cube corner tip also improves the resolution of postindentation imaging using scanning probe methods. The tip was first calibrated using a Poly(methyl methacrylate) PMMA standard sample (Young's modulus of 3.2 GPa)Reference Oliver and Pharr33,36 to meet the requirement of deeper contact depth analysis and similar materials properties instead of the commonly used fused quartz standard (tests at similar depths in quartz have been done to ensure that the calibration technique is reproducible). The pile up behavior of the PMMA standard sample is similar to that which occurs in the strain free COC samples, thereby accounting for some pile up during the calibration with PMMA standard sample. A 10 × 10 pattern of indents was performed on PMMA with loads between 200 and 10000 μN.
An array of indents was made along the surface of the sample parallel to the plane of loading, as shown in Fig. 1. Five relatively equidistant positions were chosen across the width of the sample. At each position, 2 sets of 8 × 8 grid patterns of indents were applied by using load-control load function and depth-control load function. Each COC material was also separately tested without any applied strain.
A multiload function was applied to load 10 partial loading segments from 200 to 1000 μN in load-controlled mode and from 250 to 1200 nm in depth-controlled mode. Each loading segment for load controlled (depth controlled) consisted of a constant indentation rate of 20 μN/s (240 nm/s), a 5 s hold segment with no load change to allow the materials to relax before unloading, and a constant unloading rate of 20 μN/s (240 nm/s); each partial unload was to 25% of the previous maximum segment load.
Dynamic nanoindentation was also used in this study to estimate the local mechanical properties of COC materials under applied load. A 2 μN oscillating force with a 100 Hz frequency was superimposed to the indenter. The same samples and indentation probe used for QS nanoindentation were used for the dynamic nanoindentation test. The application of strain followed the procedures used for QS nanoindentation. All nanoindentation tests were performed 10 μm away from any other indents to minimize the effect between each indent.
III. RESULTS AND DISCUSSION
A. Pile up morphology
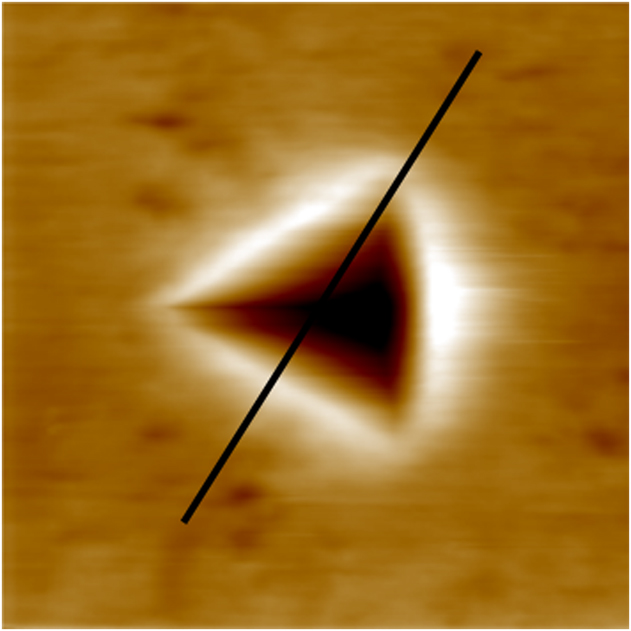
The pile up morphology around the indent impression leads to an underestimation of the contact area, which results in differences between the perceived modulus and hardness from that of the stress free material.Reference Oliver and Pharr11,Reference Tranchida, Piccarolo, Loos and Alexeev37 The formation of pile up within soft polymer materials can be induced by the appearance of load discontinuities around the indent impression,Reference Kassavetis, Mitsakakis and Logothetidis38 or strong adhesion between COCs sample and nanoindentation tipReference Grunlan, Xia, Rowenhorst and Gerberich39 in addition to the general mechanism of materials constraint around the indenter that governs pile up in metals. In the current work the pile up behavior around the indent when calibrating in the PMMA standard sample was similar to that within COCs in the as-cast (stress-free) condition. Once the COCs are placed under compressive or tensile strains, changes in the pile up imply that the contact area calculated from the tip area function will deviate from the contact area under stress free condition, and as a consequence, the experimental perceived value of indentation hardness and modulus may be either overestimated or underestimated. A typical SPM image of a residual impression is presented in Fig. 2. A 2 Hz scan rate collecting 256 lines was used for all 10 μm × 10 μm SPM images. Each residual indent was imaged within 2 min after the indentation in an effort to minimize the effect of recovery that may occur after unloading. Pile up ratios for each COC have been calculated by using an effective contact distance parameter and the pile up height obtained from the SPM images of indents.
 $${\rm{Pile}}\;{\rm{up}}\;{\rm{ratio}} = {z \over a}\quad ,$$
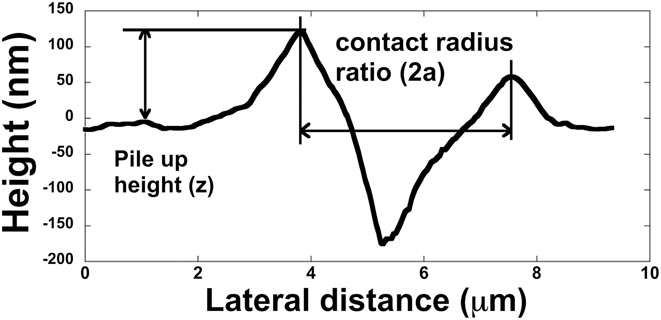
where z is the pile up height, the out of plane height from the edge of the indent and the original flat surface, and a is the half of the lateral contact impression dimension. Figure 3 shows an example of a typical indent SPM image section analysis used to determine z and a. The contact distance was measured as the lateral distance from the apex of the triangle impression to the corresponding flat edge of the impression; this is a different procedure than one might find using a sphero-conical approximation, wherein an area is converted to an equivalent radius of a circular impression; however, the corner-to-edge geometry provides a reproducible mechanism of lateral impression distance, and as the ratio is being used only as an indicator of the strain and not used to calculate a strain hardening coefficient, this method ensures a reliable process in postindent analysis.
Topography SPM 2D image of typical indentation impression; 10 μm square image.

Typical indent section analysis used to determine z/a.

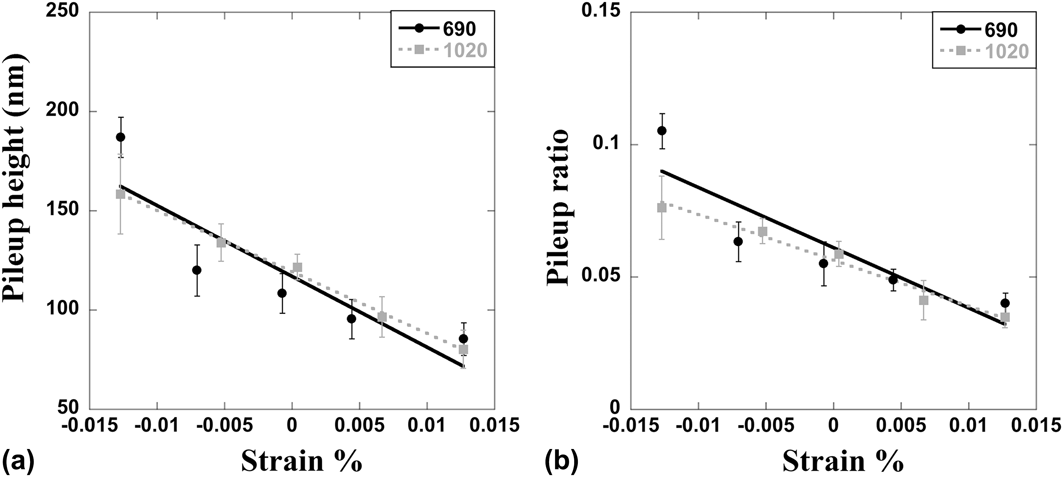
The pile up ratios and indentation modulus of two COCs in the as-cast state (which will be assumed, to first order, to correspond to a stress-free state ignoring any minimal residual stresses from the slow cooling of the uniform compression molded plate) are shown in Table I. The ZEONOR 1020R COC sample has a slightly larger pile up height and similar pile up ratio when subjected to the same load function of nanoindentation, and the ZEONOR 1020R and ZEONEX 690R have relatively similar indentation modulus values. The two COCs were then subjected to an applied stress and the portion of the material under a compressive stress exhibited higher pile up heights and ratios for both COCs. The measured pile up height and ratio as a function of locally applied strain is shown in Figs. 4(a) and 4(b).
The properties of two COCs samples in their stress free state measured using QS nanoindentation.

Pile up morphology of ZEONEX 690R and ZEONOR 1020R; (a) pileup height and (b) pileup ratio.

Since the COC's are viscoelastic, it may be necessary to consider the change in residual impression shape as a function of time after the indentation is performed. Repeated scanning of an indentation in a stress free sample of ZEONOR 1020R was performed over a period of 60 min. The change in pile up ratio from the initial scan (0.041) to the ratio at 10 min (0.040) to the ratio 60 min later (0.038) is ≈7%. The smallest increment of change in pile up height ratio in Fig. 4 is larger than the maximum change with an hour's relaxation, and therefore for the purposes of this study the residual impression height can be viewed as invariant with time for the purposes of the period of time needed for the measurements described in this study.
B. Perceived indentation hardness and modulus
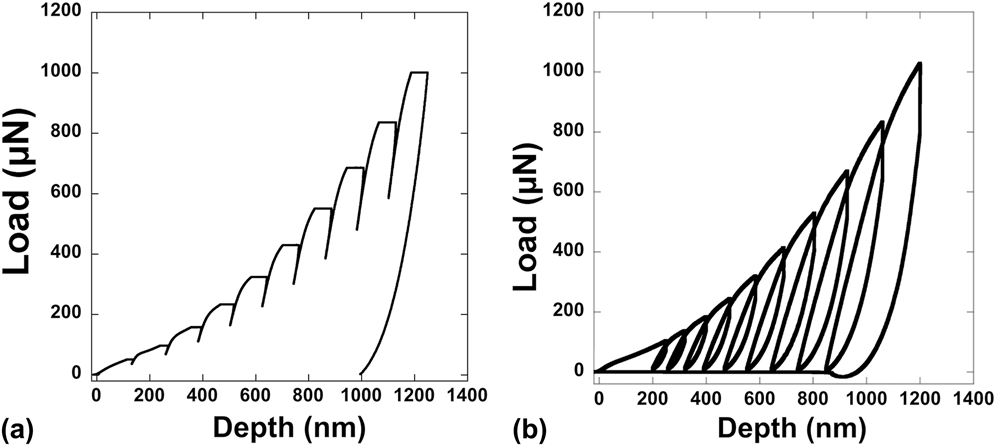
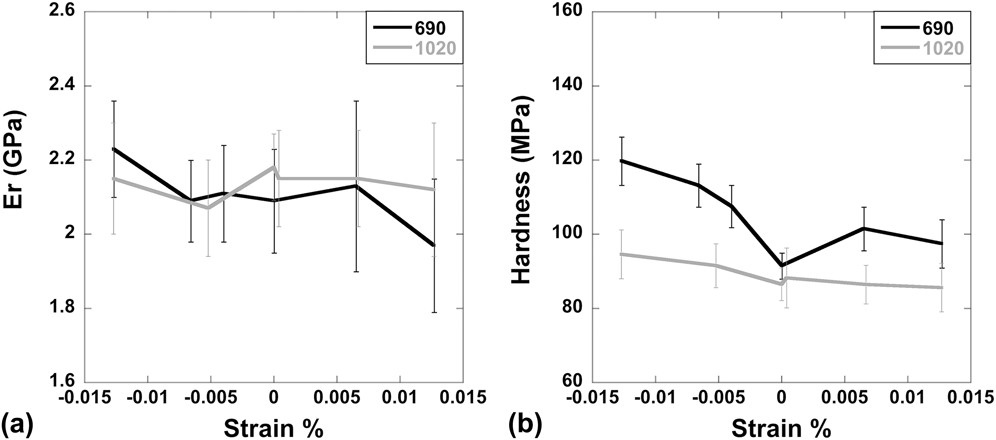
Typical partial unloading curves used to calculate the QS indentation modulus and hardness are shown Figs. 5(a) and 5(b). The loops that appear in the depth-controlled load-depth curve demonstrate there is viscoelastic behavior of these materials. For this purposes of this study, we will continue using only the load-controlled data as a representative of QS indentation properties as the fitting to unloading using a QS model is more amicable to data that does not exhibit this amount of creep. As noted in the following section, the COCs are moderately viscoelastic, and the QS method is being used as a convenient benchmark for comparison purposes. The average indentation modulus and hardness for tests in load control, using all the unloading segments over the entire depth range of testing are shown in Fig. 6.
Load depth curves for (a) load-controlled mode and (b) depth-controlled mode used to calculate indentation modulus and hardness.

(a) Indentation modulus and (b) hardness calculated from QS indentations of ZEONEX 690R and of ZEONOR 1020R as a function of strain change.

As shown in Table I, the perceived experimental values of indentation modulus for ZEONEX 690R and ZEONOR 1020R with 0% strain change are rather similar; 2.09 and 2.19 GPa, respectively. For both COCs, the perceived indentation modulus and hardness values increase with an increasing applied compressive strain and decrease with applied tensile strain, as expected from the data presented in Fig. 4. The indentation hardness values should be influenced more by the inaccurate contact area than the indentation modulus values. The phenomenon is also shown in Fig. 6, for example the perceived indentation hardness values of ZEONEX 690R decrease relatively linearly from 119.8 to 97.5 MPa, a 23% decrease when the sample is subjected to strains on the order of 1%. However, the indentation modulus value is less sensitive over that strain range, from 2.23 to 1.97 GPa, about a 13% decrease.
C. Result from dynamic indentation
Due to the viscoelasticity within copolymer materials, it is necessary to evaluate the degree of the influence of testing frequency on material properties. To evaluate this behavior, dynamic nanoindentation was performed on COCs with a constant static load of 5 mN with an oscillation of 2 μN over frequencies ranging from 0.1 to 100 Hz. The change in indentation storage modulus over this range was less than 4.5%, while the measured values of tan-delta vary between 0.07 and 0.13. These data suggest that the effects of applied strain on measured indentation storage modulus within these particular COCs are greater than the frequency dependence; other classes of materials that are more viscoelastic may require a more complex analysis than that presented in this study.
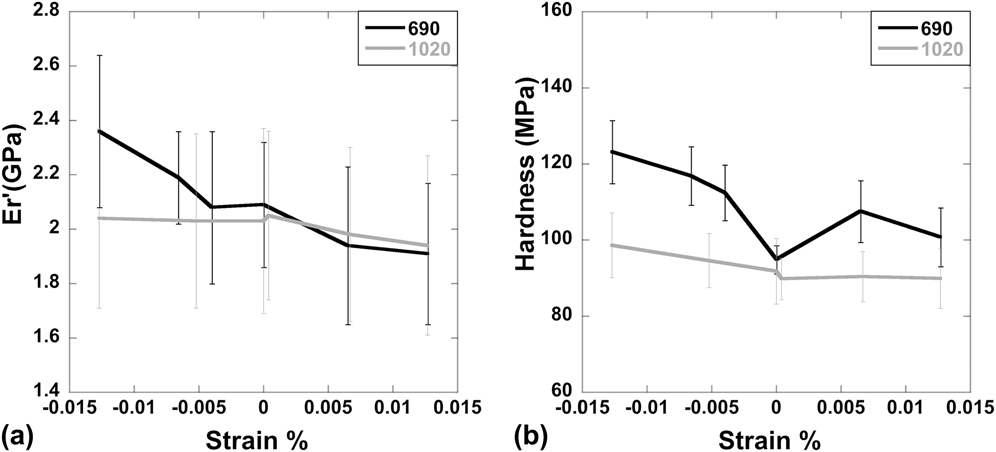
Dynamic properties were measured on both COCs using a 100 Hz frequency at loads between 200 and 1500 μN. The frequency and load amplitude of the dynamic oscillation were held constant while the static load was increased, which allows the testing of the materials' response at different displacements. Figures 7(a) and 7(b) show the indentation storage modulus and hardness of the COCs as a function of applied strain. The dynamic data have a smaller standard deviation at any given strain and also exhibit larger deviations in the results as a function of strain than the QS data, which we attribute to possible issues arising from creep altering the unloading curves.Reference Lucas, Oliver and Ramamurthy40,Reference Adhihetty, Hay, Chen and Padmanabhan41 For the ZEONEX 690R sample, the perceived indentation storage modulus increases when subjected to compressive stress, and decreases when subjected to tensile stress. However, the perceived storage modulus of ZEONOR 1020R is relatively insensitive to stress, with the hardness also exhibiting a smaller sensitivity to applied stresses.
(a) Indentation storage modulus and (b) hardness calculated from dynamic nanoindentation of ZEONEX 690R, ZEONOR 1020R as a function of strain change.

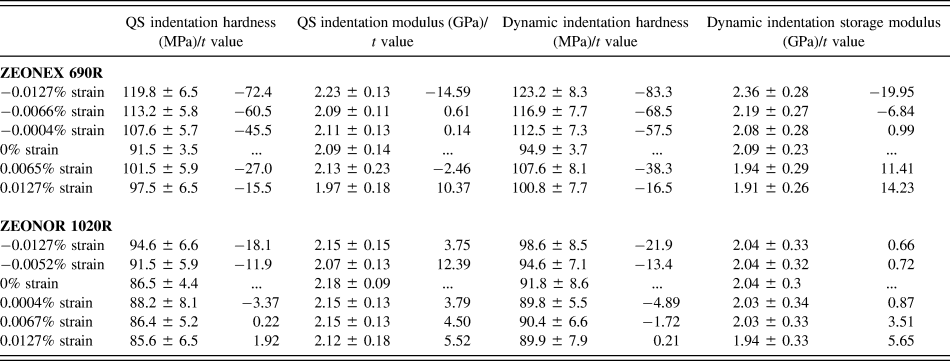
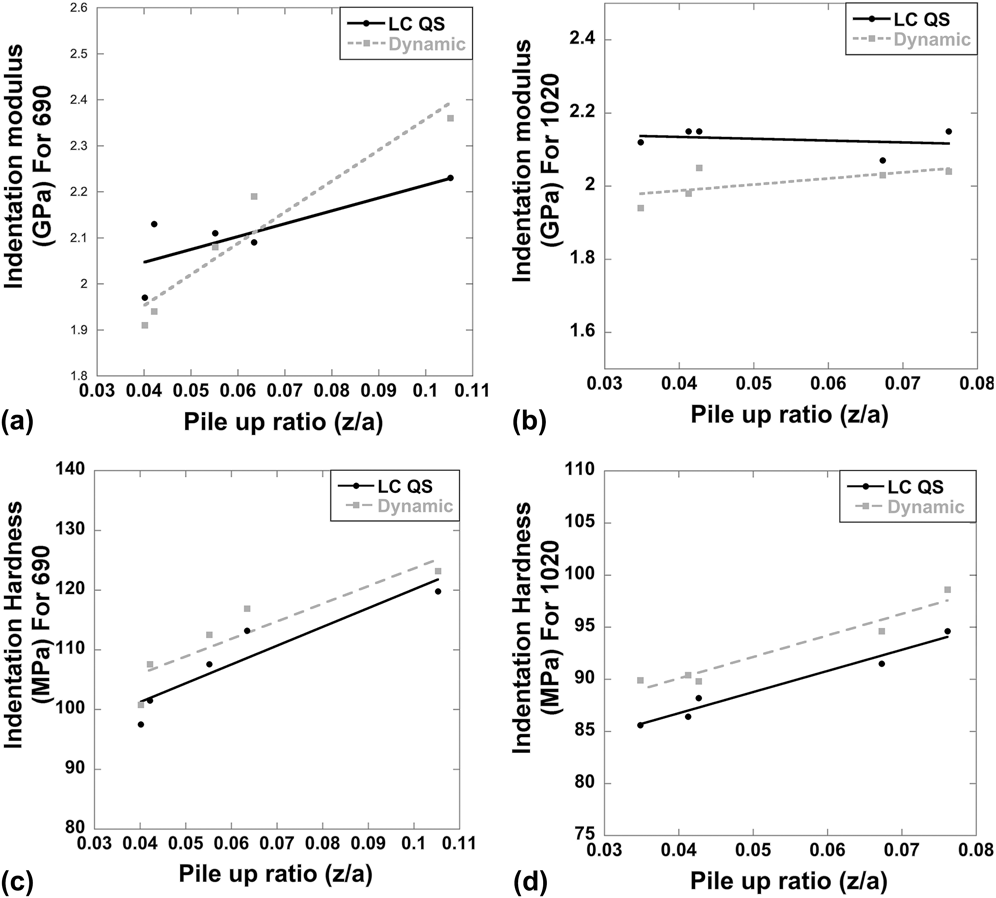
The error bars in Figs. 6 and 7 show the relatively large deviations within one location of the experiments. Relatively large variations in measured indentation data for other polymers have been reported by Kamran and Larsson,Reference Kamran and Larsson42 who showed the effects on indentation data of an elastic polymer by using finite element method based on the experimental Vickers and cone hardness tests. Table II presents the comparisons of perceived indentation modulus and hardness values obtained from QS and dynamic nanoindentation tests, subjected to an applied strain. The indentation storage modulus values of the COCs are similar to the indentation modulus obtained from QS nanoindentation, as one might expect based on the work of Hochstetter et al.,Reference Hochstetter, Jimenez and Loubet43 who presented an analysis method that demonstrated the limitations of using QS nanoindentation for glassy polymers. Here, we extend this type of analysis to the correlation between residual stress/strain and experimental indentation modulus using dynamic nanoindentation. In Fig. 7, the results of indentation storage modulus and hardness show more dependent behavior on the strain percent change than that from QS nanoindentation. Similar results are found when perceived properties values are related to postindentation impression morphology as shown in Fig. 8. For both ZEONOR 1020R and ZEONEX 690R, the results of perceived indentation storage modulus appear to be at least or more sensitive as a function of pile up ratio than those from QS nanoindentation. Table II shows that under compressive stress, the perceived indentation storage modulus values reach a plateau for ZEONOR 1020R, at the same time, the perceived values of indentation storage modulus of ZEONEX 1020R slightly decrease under tensile stress.
Properties inferred from various indentation methods of COCs samples as a function of applied strain and the resulting statistical significance relative to the stress-free condition.

(a) Load controlled indentation modulus and (b) indentation storage modulus and (c) indentation hardness from QS and (d) dynamic nanoindentation as a function of pile up ratio (h/a) for ZEONEX 690R and ZEONOR 1020R.

To determine if the properties inferred from a localized indentation test would correlate with spatially varying residual stresses in a sample one would need to have some statistical reliability measure of the likelihood that the measurement was influenced by the stress more than point-to-point variations in bulk material properties. To address this, a student-T test analysis was performed with the results from each indentation. Since the numbers of each set of data are the same within one load function and generally follow a normal distribution, we chose to report t-values in Table II; other statistical analyses should follow similar trends. Differences between the indentation data under applied stress and without applied stress (0% applied strain) are significant if the t values are less than 0 or larger than 1; if the t value is between 0 and 1 there is no statistically significant difference between two sets of indentation data.
From the results from Table II and Figs. 6 and 7, the residual stresses within COC materials can be estimated based on the correlation with indentation modulus and indentation storage modulus. Rettler et al.Reference Rettler, Kranenburg, Hoeppener, Hoogenboom and Schubert44 discussed the effect of three general assumptions of nanoindentation data analysis for COC materials. Using a relatively high unloading rate may improve the accuracy of the analysis results due to the time-dependent behavior of viscoelastic materials, which could confirm that the unloading is elastic when the samples were tested at room temperature (lower than T g). Another main assumption within the general indentation methodology is the assumption of no cracking around the indent impression. In our study, cracking was not observed (Fig. 2), and the specimens have been tested at room temperature (below the glass transition temperature), unloading rate of testing was maintained below 20 μN/s. Due to the moderate time-dependent deformation of COC materials,Reference Rettler, Kranenburg, Hoeppener, Hoogenboom and Schubert44 the dynamic nanoindentation analysis in this study increases the possibility of obtaining the accurate mechanical response from the materials.
IV. CONCLUSIONS
This study presents QS and dynamic nanoindentation characterization of polymeric COC materials under an applied strain. The residual impression of an indentation in these copolymer materials is influenced by applied strains. Inferring the residual stress or strain magnitude using both postindent impression pile up heights or differences in the perceived modulus and hardness is viable, however dynamic nanoindentation and analysis of the storage modulus show a more sensitive and linear correlation of indentation modulus as a function of applied strain than using data extracted from QS tests. Therefore, nanoindentation on molded polymeric parts can be used to generate spatially sensitive indentation storage modulus maps that correspond to residual stress/strain maps on commercially fabricated parts.
ACKNOWLEDGMENTS
We wish to thank Eli Lilly and Co. for providing financial support and the materials used for this study.