


INTRODUCTION
Pigeonpea cultivars vary greatly in their crop duration, depending both on genotype and photo-thermal environment. Cultivars ranging from extra-early (<60 days to flower) through to late (>200 days to flower) are available (ICRISAT 1991). Long days and/or warm (>24°C) or cool (<18°C) temperatures also delay flowering and increase crop duration greatly (Omanga et al. Reference Omanga, Summerfield and Qi1996). These variations in crop duration affect phenological potential and hence the optimum plant population density (D) for radiation interception, biomass (BY) accumulation and partitioning to seed yield (SY) (Lawn & Williams Reference Lawn, Williams, Wallis and Byth1987; Lawn & Troedson Reference Lawn, Troedson, Nene, Hall and Sheila1990). Thus, genotypes that flower early generally require much higher D to ensure full radiation interception and BY accumulation than later flowering ones because of their limited vegetative growth and size (Chauhan Reference Chauhan, Nene, Hall and Sheila1990). Pigeonpea is grown throughout Tanzania, from 3–11° S and from 0–1500 m asl, resulting in a wide range of photo-thermal environments. It is clearly important, therefore, to determine the optimum D for the different maturity groups in the different environments of Tanzania.
In Australia, a plant density of 400 000–500 000 plants/ha is required to obtain the best SY from early maturing, photoperiod-insensitive cultivars (Wallis et al. Reference Wallis, Byth, Whiteman and Virmani1981). In peninsula India, the optimum D for short duration cultivars is about 300 000 plants/ha, though significant genotype×plant density interactions have been reported (Chauhan et al. Reference Chauhan, Venkataratnam and Sheldrake1987). Traditional, late flowering genotypes require about 50 000 plants/ha in these environments. In contrast, in northern India where crop durations are longer and growth rates higher, optimum D is lower, between 44 000 and 160 000 plants/ha. Studies in Nigeria showed that the optimum D varied with relative maturity (Akinola & Oyejola Reference Akinola and Oyejola1994); to obtain maximum SY, late maturing genotypes required a D of 28 000 plants/ha, medium maturing ones 56 000 plants/ha, and early maturing genotypes >400 000 plants/ha.
Relationships between yield and D can be examined by regressing the reciprocal of BY or SY per plant on D (Willey & Heath Reference Willey and Heath1969; Counce Reference Counce1987; Squire Reference Squire1990; Craufurd Reference Craufurd1996), where:

where a and b are constants. The value 1/b gives the asymptotic or theoretical maximum yield per unit area (Y) at infinite D (Willey & Heath Reference Willey and Heath1969), whereas the value 1/a gives the theoretical yield per plant in a competition-free environment. As Y is the product of yield per plant×D, then Eqn (1) can be reorganized to give:

which describes an asymptotic relation between Y and D (Counce Reference Counce1987; Khah et al. Reference Khah, Roberts and Ellis1989). Hence if values of a and b are known from Eqn (1), then the optimum D can be determined. However, given the asymptotic relation between Y and D such that the maximum yield can never be obtained, several authors have defined the optimum D (D opt) as that population which gives 0·9 (Counce Reference Counce1987) or 0·5 (Gardner & Gardner Reference Gardner and Gardner1983) of the predicted yield at the maximum density investigated. In the present study, 0·75 of the predicted yield was used, giving:

The objective of the present study was to determine the optimum plant density in four pigeonpea genotypes representing early, medium and late maturing types grown in five contrasting pigeonpea cropping environments in Tanzania.
MATERIALS AND METHODS
Sites
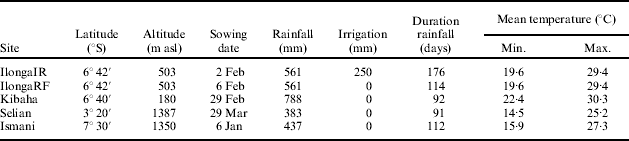
Experiments were conducted at five locations in Tanzania in 1996 (Table 1). Two experiments were conducted at Ilonga, a warm, lowland site in south-central Tanzania with mean temperatures of 25°C and potential evaporation rates of 4–5 mm/d. The optimum flowering time at Ilonga in 1994/95 was about 100 days (Mligo & Craufurd Reference Mligo and Craufurd2005). One experiment was rainfed (IlongaRF), with 561 mm of rain and a rainy season duration of 114 days. The other experiment (IlongaIR), sown at a similar time, was given supplementary irrigation with 25 mm of water every time plants showed symptoms of stress at noon (vertical leaves; Chauhan Reference Chauhan, Nene, Hall and Sheila1990) and every 7 days after the last rain fell. In total ten extra irrigations were given and the season extended to 176 days. Kibaha is on the coast and experiences warmer night temperatures and higher rainfall, but a shorter rainy season, then Ilonga. Soils at Kibaha are shallow with a low water-holding capacity, and are prone to drought. Selian and Ismani are both mid-altitude sites in the north and south of the country, respectively, with lower rainfall totals, lower potential evaporation rates (2–4 mm/d) and cooler day and night temperatures than Ilonga or Kibaha. In 1994/95 the optimum flowering time at Ismani was 90 days and at Selian 140 days (Mligo & Craufurd Reference Mligo and Craufurd2005).
Sowing date, total rainfall and irrigation, duration of rainfall period, and minimum and maximum temperature between sowing and maturity for plant density experiments in Tanzania in 1996
Design and treatments
The experiments at each site comprised a factorial combination of four genotypes and four plant densities arranged in an RBD with four replications. The four genotypes, ICPL 86005, Kat 50/3, QP 37 and Local, represented early (100 days to mature at Ilonga), medium (150 and 170 days) and late (201 days) maturity types, respectively (Mligo Reference Mligo1998). The four plant densities (40 000, 80 000, 160 000 and 320 000 plants/ha) were chosen to cover the range of optimum D for different maturity groups previously cited (Wallis et al. Reference Wallis, Byth, Whiteman and Virmani1981; Chauhan et al. Reference Chauhan, Venkataratnam and Sheldrake1987; Akinola & Oyejola Reference Akinola and Oyejola1994).
Cultural details
Each plot comprised six rows, 4 m long and 0·5 m apart. Density treatments were created by varying the intra-row spacing from 0·125 to 1·0 m, thinned to two plants per hill. Seeds were sown by hand following tractor ploughing and harrowing. No fertilizer was applied and plants nodulated naturally. Thinning was done around 30 days after sowing to allow for termite damage to seedlings. Plots were hand-weeded. Termites during seedling establishment were controlled by aldrin and deltamethrin at manufacturers' recommended rates. Flower thrips (Megalurothrips usitatus), pod borers (Helicoverpa armigera) and pod sucking bugs (Clavigralla spp.) were controlled by spraying at flower bud appearance, flowering and at 10 day intervals thereafter with deltamethrin and cypermethrin. There were no fungal or bacterial disease outbreaks.
Observations and data analysis
In pigeonpea, leaf abscission during pod-filling is common and as much as 0·2 of the above-ground BY can be abscised leaves. Abscised leaves were collected from the central four rows in each plot every 3–4 days at all sites except Selian. Each experiment was bordered by two rows of cowpea and two rows of maize as a windbreak to aid the collection of abscised leaves. Leaves were air-dried and added to the above-ground BY total at maturity. Across all sites and treatments, 0·19 of BY was leaf. Dates of 50% flowering and maturity were recorded in each plot. At maturity SY and total above-ground BY (including abscised leaves) was measured on the central four rows in each plot and harvest index (HI) calculated as the ratio SY to BY.
ANOVA was performed on the raw data for D, crop duration, BY, SY and HI at each location using Genstat (Genstat V Committee 1987). A combined ANOVA including sites as an unreplicated main effect was also carried out. Mean (of four replications) BY and SY per plant were calculated from yields and observed values of D and Eqn (1) fitted to quantify the response to D at each site. The slopes and intercepts of the linear regressions for each genotype were compared to test for genotypic differences in response to D. Values of the constants a and b in Eqn (1) from the above comparison were then used to calculate D opt.
RESULTS
A combined ANOVA of genotypes, densities and sites showed highly significant effects (P<0·001) of genotype (G) and density (D), as well as significant interactions (P<0·01–0·001) between site, G and D for BY, SY and HI. ANOVAS at each site showed significant effects of G and D for BY, SY and HI at all sites, and G×D interact
Site, plant density and genotype effects
Mean site crop duration varied by 37 days, with the shortest duration at IlongaRF (141 days) and the longest at Kibaha (178 days). The highest mean BY (17·4 t/ha) and SY (4·5 t/ha) was achieved at IlongaIR. BY and SY at IlongaIR was about 50% greater than at IlongaRF, and 150% more than at Ismani (Fig. 1). Mean site BY was proportional to rainfall+irrigation (Fig. 1). SY at all sites except Kibaha was also proportional to rainfall+irrigation. Severe drought stress at Kibaha, evidenced by the mean HI of only 0·07 cf. 0·24 at the other sites, accounted for the low SY at this site.
Relations between (a) mean total above-ground biomass yield and (b) mean seed yield and rainfall including irrigation of four genotypes of pigeonpea grown at five sites in Tanzania in 1996. Sites are: Ilonga IR ●; Ilonga RF ○; Kibaha ■; Ismani □; Selian ▲. Fitted lines are: (a) Y=−1363+20·6X, R 2=0·78; P<0·05, and (b) excluding Kibaha Y=−872+606X, R 2=0·98; P<0·05.

Target plant densities were achieved at all densities other than at 320 000 plants/ha, where mean site D was 270 000 and 286 000 plants/ha at Kibaha and Ismani, respectively. Mean site BY (8·8–12·5 t/ha) and SY (1·9–2·6 t/ha) increased with D (P<0·001) while HI decreased (P<0·001), but only from 0·25 to 0·22. Plant density had no effect on crop duration. Crop duration varied from a mean of 119 days in ICPL 86005 to 176 days in Local. BY and SY were lowest (P<0·001) in the earliest maturing genotype ICPL 86005. However, ICPL 86005 had the highest HI, 0·31, compared with 0·20 to 0·23 for the remaining genotypes.
IlongaIR
There were significant G, D and G×D interactions for BY, SY and HI at IlongaIR. In the early maturing ICPL 86005 there was a positive linear relation between BY, SY and D; HI, however, decreased with increasing D (Fig. 2). The remaining medium and late maturing genotypes exhibited an asymptotic response to D, with a maximum BY and SY between 100 000 and 160 000 plants/ha. Plant density had little effect on HI. BY and SY in the medium and late maturing genotypes, which all responded to D in the same way, were more than double those of ICPL 86005. These medium/late genotypes produced 24 t/ha BY and 5·6 t/ha SY.
Relations between (a) total above-ground biomass, (b) seed yield and (c) Harvest Index, and plant density of four pigeonpea genotypes grown at Ilonga IR in 1996. Genotypes: ICPL 86005 ●; Kat 50/3 ○; QP 37 ▾; Local ▿. Fitted lines: (a) ● y=−70418+174852(1·00×), R 2 =0·99; ○ y=22870−26028(0·971×), R 2 =0·98; ▾ y=23537−12091(0·988×), R 2 =0·69; ▿ y=23855−117009(0·949×), R 2=0·99; (b) ● y=3824−1677(0·996×), R 2=0·99; ○ y=5526−14358(0·960×), R 2=0·98; ▾ y=5476−5673(0·968×), R 2=0·69; ▿ y=5213−2649(0·909×), R 2=0·99; (c) ● y=167+341(0·997×), R 2=0·99; ○ y=0·244−0·082(0·965×), R 2=0·18; ▾ y=0·205+0·077(0·997×), R 2=0·00; ▿ y=0·22+2576(0·811×), R 2=0·90.

IlongaRF
There were significant differences between genotypes for BY, SY and HI, and significant effects of D on BY and SY. There was a significant interaction between G and D for SY, but not BY or HI. As at IlongaIR, ICPL 86005 produced less BY than the other genotypes (9·4 v. 13·0 t/ha) but had a higher HI (0·31 v. 0·18–0·24).
SY was similar in ICPL 86005, Kat 50/3 and QP 37, about 3·0 t/ha. The latest maturing genotype, Local, had the lowest SY (Fig. 3). Although effects of D on BY were significant, BY only ranged from 11·3 to 12·6 t/ha. HI was 0·25. SY in Local and QP 37 increased with increasing D whereas in ICPL 86005 and Kat 50/3 SY was greatest at 80 000–160 000 plants/ha.
Kibaha
There were significant effects of G and D on BY, SY and HI at Kibaha, as well as significant G×D interactions for SY and HI. ICPL 86005 again had the lowest BY (10·6 t/ha) and highest HI (0·12), though genotypic differences were much smaller than at Ilonga. SY were poor at Kibaha and overall ICPL 86005 had the highest SY (Fig. 3). BY increased with D, from 11·0 to 13·4 t/ha, while SY and HI were affected only a little by D. Plant density had little effect on SY or HI in ICPL 86005 or Local. In Kat 50/3 and QP 37, SY and HI were higher at lower D, and responses were therefore not asymptotic.
Relations between seed yield and plant density in four genotypes of pigeonpea grown at four locations in Tanzania in 1996. Genotypes: ICPL 86005 ●; Kat 50/3 ○; QP 37 ▾; Local ▿. Fitted lines: (a) ● y=3327–1929(0·984×), R 2=0·94; ○ y=3329−3778(0·971×), R 2=0·68; ▾ y=3187+3·6E−15(1·120×), R 2=0·00; ▿ y=3062−1095(0·998×), R 2=0·99; (b) ● y=1200−493(0·981×), R 2=0·00; ○ y=890+828(0·982×), R 2=0·40; ▾ y=467+2612(0·976×), R 2=0·99; ▿ y=574−189(0·982×), R 2=0·50; (c) ● y=2507−2738(0·989×), R 2=0·75; ○ y=2927−2106(0·986×), R 2=0·82; ▾ y=3449−1959(0·993×), R 2=0·00; ▿ y=2795−13297(0·958×), R 2=0·95; (d) ● y=6000−5744(0·998×), R 2=0·92; ○ y=1965−960(0·977×), R 2=0·54; ▾ y=2310−3·8E−14(1·127×), R 2=0·00; ▿ y=1155+1·1E–14(1·120×), R 2=0·0.

Selian
There were significant effects of G and D on BY and SY, but not HI, and no significant G×D interactions at Selian. BY (4·2 t/ha) and SY (1·7 t/ha) were lower in ICPL 86005 than the other later maturing genotypes (mean 7·2 and 2·5 t/ha, respectively). BY and SY both increased with increasing D, from 4·3 to 8·3 and 1·4 to 2·9 t/ha, respectively. HI (excluding fallen leaves) was 0·36 at all densities.
Ismani
At Ismani there were significant effects of G, D and G×D interactions for BY, SY and HI. Genotype differences were similar to other sites with lower BY (3·9 t/ha) and SY (1·3 t/ha), but higher HI (0·33), in ICPL 86005 than other genotypes, which were similar (7·4, 1·5 and 0·21 t/ha, respectively). Mean BY increased with D, from 4·0 to 8·1 t/ha, while HI decreased from 0·26 to 0·21. In ICPL 86005, both BY and SY increased linearly with increasing D, by a factor of four. BY yield and SY in the remaining genotypes exhibited a more parabolic response to D, particularly SY in QP 37.
Theoretical maximum yield and optimum plant density
There were strong linear relationships at all sites between reciprocals of BY and SY per plant and D (R 2>0·95 in all cases except ICPL 86005 at Ismani, where R 2=0·66). These relations are illustrated by IlongaIR (Fig. 4). At this site, there was a clear difference in the response of BY and SY to D between ICPL 86005 and the other genotypes, with significant (P<0·001) differences in the slope and intercept of the regression among genotypes. A subsequent comparison of regressions confirmed that Kat 50/3, QP 37 and Local were not significantly different for BY (P>0·65) or SY (P>0·30) and a common regression could be fitted to these three genotypes to describe their response to D.
Relations between reciprocal of (a) total above-ground biomass per plant and (b) seed yield per plant and plant density in four genotypes of pigeonpea grown at Ilonga IR. Genotypes: ICPL 86005 ●; Kat 50/3 ○; QP 37 ▾; Local ▿. Fitted lines: (a) ● Y=7·39×10−3+7·26×10−8X, R 2=0·98; P<0·001; ○▾▿ Y=9·34×10−4+4·00×10−7X, R 2=0·99; P<0·001; (b) ● Y=8·72×10−3+2·73×10−8X, R 2=0·99; P<0·001; ○▾▿ Y=1·73×10−3+1·80×10−7X, R 2=0·99; P<0·001.

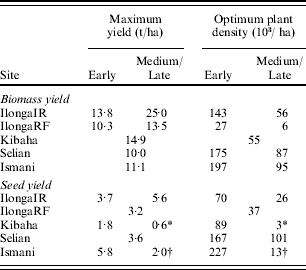
The early maturing genotype ICPL 86005 had a larger slope and intercept than the medium/late maturity group of genotypes, indicating that this genotype was more responsive to D and had a smaller theoretical yield per plant (reciprocal of the intercept) than the other genotypes. The theoretical maximum BY (BYmx) and SY (SYmx) per unit area in these two maturity groups, given by 1/slope, therefore varied from 13·8 to 25·0 t/ha and 3·7 to 5·6 t/ha, respectively (Table 2). The optimum plant density (D opt), estimated from Eqn (3), for BY was greater than for SY by a factor of 2. Values of D opt, were also considerably higher in ICPL 86005 than in the medium/late genotypes. The response to D of the four genotypes at the other sites was analysed in the same way, and the maximum theoretical yields and D opt presented in Table 2.
Theoretical maximum total above-ground biomass and seed yield, and the plant density required (ha) to achieve 0·75 of the predicted SY at 320 000 plants/ha, in early (ICPL 86005) and medium/late (Kat 50/3, QP 37 and Local) genotypes of pigeonpea grown at five sites in Tanzania in 1996
* Local only.
† Kat50/3 only.
In the rainfed experiment at Ilonga, the response of BY to D was similar in the three medium/late maturity genotypes and these responded significantly differently to ICPL 86005. The BYmx was greater in the medium/late genotypes than in ICPL 86005, though only by 3·0 t/ha compared with 12·0 t/ha in the irrigated treatment. Values of D opt for BY were still much higher in ICPL 86005 than in the other genotypes. The response of SY to D, however, was not significantly different among the four genotypes and all had a common SYmx in this environment of 3·2 t/ha. Intercepts were also not significantly different between genotypes and so the value of D opt was 37 000 plants/ha in all genotypes.
At Kibaha, BY in all genotypes showed the same response to D, and accordingly BYmx and D opt was the same, 14·9 t/ha and 55 000 plants/ha, respectively. For SY, two genotypes, Kat 50/3 and QP 37, did not have linear or asymptotic responses to D and hence the reciprocal analysis is not appropriate. The SY response of ICPL 86005 was significantly different from Local, and D opt therefore varied from 89 000 to 3000 plants/ha, respectively. Maximum SY at Kibaha was lower than at Ilonga in both genotypes.
At Selian there were no G×D interactions and BYmx and SYmx were therefore the same in all genotypes, 10·0 and 3·6 t/ha, respectively. There were, though, significant differences in the intercept, but not the slope, for the response of BY and to D between ICPL 86005 and the other genotypes. Accordingly, D opt for BY and SY varied from 167 000 and 175 000 plants/ha for ICPL 86005 to 87 000 and 102 000 plants/ha in the medium/late genotypes.
The response of BY to D at Ismani was very similar to that at Selian, with no genotypic differences in the maximum BY and differences in D opt between ICPL 86005 and the other genotypes. In contrast to Selian, there were differences in the response of SY to D. QP 37 and Local both exhibited parabolic responses to D and were excluded from the reciprocal analysis. The SY response of ICPL 86005 was significantly different from Kat 50/3, and the SYmx of 5·8 t/ha was the highest recorded of all genotypes at any site. The D opt, required to produce this SY, 227 000 plants/ha, was also the highest recorded. Kat 50/3 had a SYmx of 2·0 t/ha and a D opt of 13 000 plants/ha, well below that for BY.
DISCUSSION
Multi-locational yield trials conducted by plant breeders and agronomists are more often than not grown at fixed D, despite the fact that there are significant crop duration×plant density interactions in annual grain legumes, including pigeonpea (Wallis et al. Reference Wallis, Byth, Whiteman and Virmani1981; Lawn & Williams Reference Lawn, Williams, Wallis and Byth1987; Chauhan Reference Chauhan, Nene, Hall and Sheila1990; Akinoloa & Oyejola Reference Akinola and Oyejola1994). These interactions may arise both from inherent differences in plant stature associated with crop duration (i.e. earlier maturing plants are usually smaller) and the response to D, as well as from differences in adaptation, i.e. an appropriate crop duration and D in relation to available soil moisture (Mligo & Craufurd Reference Mligo and Craufurd2005). It is also worth noting that for small-scale farmers total yield is important and not just SY, as pigeonpea is also used for fodder and firewood.
The sites used in the present experiment varied in total seasonal rainfall+irrigation (383–811 mm), duration of the rainy season (91–176 days) and mean temperature (20–25°C), giving rise to considerable variation in BY, SY and HI. Unsurprisingly, the highest mean BY and SY was achieved in the irrigated, and hence near optimum conditions, experiment at Ilonga (IlongaIR). At this site, BY and SY were 25·0 and 5·6 t/ha, respectively, in the medium/late maturity genotypes. This SY is close to the maximum reported experimental SY of 4·2 to 6·2 t/ha for medium and late genotypes, respectively (Lawn & Troedson Reference Lawn, Troedson, Nene, Hall and Sheila1990). Akinola & Oyejola (Reference Akinola and Oyejola1994) reported maximum BY and SY of genotypes flowering between 95 and 125 days at several sites in Nigeria to be upto 28 and 2·2 t/ha, respectively. Typically, SY for early maturity genotypes in East Africa are between 1 and 2 t/ha on research stations (see Silim et al. Reference Silim, King and Tuwafe1995). Under optimum conditions ICPL 86005 was, as expected, lower yielding than other genotypes. This was due solely to its shorter duration, as SY accumulation rates were similar in all genotypes, about 35 kg/ha/day.
Plant density had little effect on HI, other than at Kibaha and in ICPL 86005 at IlongaIR where HI decreased with increasing D. At Kibaha, this decline in HI in all the genotypes at higher D was associated with the severe drought. At IlongaIR, HI (including fallen leaves) in ICPL 86005 was 0·47 at the lowest D, falling to 0·31 at the highest D. This is a very high HI for pigeonpea and other legumes in general (Lawn & Williams Reference Lawn, Williams, Wallis and Byth1987; Lawn & Troedson Reference Lawn, Troedson, Nene, Hall and Sheila1990). Presumably at this warm, irrigated site the optimum ratio of individual plant to population size occurred at the lowest D. In other studies, Akinola & Whiteman (Reference Akinola and Whiteman1975) reported HI to decline when D>215 000 plants/ha in a medium/late genotype in Australia. Likewise, Akinola & Oyejola (Reference Akinola and Oyejola1994) found HI to decline with D between 18 500 and 444 000 plants/ha in a medium/late genotype at Mokwa, Nigeria.
Generally, the warmer sites of Ilonga and Kibaha produced more BY than the cooler sites Selian or Ismani. Nevertheless, mean site BY and SY (excluding Kibaha) were proportional to rainfall+irrigation and at IlongaIR a longer growing season as well. Mligo & Craufurd (Reference Mligo and Craufurd2005) observed similar relations at the same sites in 1995. The low SY at Kibaha was associated with a very poor HI rather than low BY, which is indicative that the crop experienced severe stress during the reproductive phase. Although Kibaha received 788 mm of rain, this all fell in 90 days. Soils at Kibaha were also shallow, run-off was high and drought occurred during the season and particularly once the rains ended. Even in the early maturing ICPL 86005, which matured in 104 days under optimum conditions at Ilonga and might therefore have been expected to escape the stress at Kibaha, flowering and maturity were delayed by 20 and 60 days, respectively, a further indication of the severity of the stress at this site.
All genotype×site responses to D were linear or asymptotic, except Kat 50/3 and QP 37 at Kibaha and QP 37 and Local at Ismani; they could therefore be quantified and compared using reciprocals of yield per plant (Eqn 1; Willey & Heath Reference Willey and Heath1969). Akinola & Whiteman (Reference Akinola and Whiteman1975) reported an asymptotic response for BY, but a parabolic response for SY in a 165 days to flower genotype in Australia. However, analysis of other pigeonpea density experiments, such as Akinola & Oyejola (Reference Akinola and Oyejola1994), Keatinge & Hughes (Reference Keatinge, Hughes and Virmani1981) and Obuo & Okurut-Akol (Reference Obuo, Okurut-Akol, Silim, King and Tuwafe1995), also shows the reciprocal analysis to be appropriate. The reciprocal analysis allows the effect of plant density on BY and SY to be compared, and for the response to be described in fairly simple terms using two parameters – the theoretical maximum yield per unit area (1/b, from Eqn 1) and optimum plant density (Eqn 3).
Although IlongaIR gave the highest yields, the highest optimum densities were at Ismani for ICPL 86005 (227 000 plants/ha) and Selian for the medium/late genotypes (102 000 plants/ha). These two sites have cooler mean temperatures than Ilonga or Kibaha, close to the optimum of about 24°C for pigeonpea (Omanga et al. Reference Omanga, Summerfield and Qi1996; Robertson et al. Reference Robertson, Carberry, Chauhan, Ranganathan and O'Leary2001). Ismani has a shorter growing season that Selian due to shallower soils and lower minimum temperatures at the end of the season. In the 1994/95 season, the optimum flowering time was about 90 days at Ismani and 160 days at Selian (Mligo & Craufurd Reference Mligo and Craufurd2005) and so only early maturing genotypes such as ICPL 86005 are adapted to Ismani.
At all sites except Kibaha for BY and IlongaRF for SY, there were clear differences in the response to D of the early maturing genotype ICPL 86005 and the three medium/late maturing genotypes and theoretical maximum yields and/or optimum plant densities varied. Optimum plant densities were as expected much higher in ICPL 86005 than in the later maturing genotypes, due to the smaller plant size of the early genotype (Squire Reference Squire1990). The optimum density for ICPL 87091, an early maturity genotype, grown in Uganda was 135 000 plants/ha (Obuo & Okurut-Akol Reference Obuo, Okurut-Akol, Silim, King and Tuwafe1995). In India and Australia (Wallis et al. Reference Wallis, Byth, Whiteman and Virmani1981; Chauhan Reference Chauhan, Nene, Hall and Sheila1990) optimum densities for short duration pigeonpea are reported to be greater than the maximum values found here of 227 000 plants/ha. The optimum density for UQ1, a medium/late maturity genotype, grown in Australia was 18 000 plants/ha (Akinola & Whiteman Reference Akinola and Whiteman1975).
Under drought or other stressful conditions, optimum densities are usually lower as there is insufficient water or nutrient to support high plant densities (Keatinge & Hughes Reference Keatinge, Hughes and Virmani1981; Squire Reference Squire1990; Azam-Ali et al. Reference Azam-Ali, Rao, Craigon, Wadia and Williams1993). For example, in the experiment of Keatinge & Hughes (Reference Keatinge, Hughes and Virmani1981), where pigeonpea was grown with and without irrigation, optimum densities were 181 000 plants/ha in the irrigated and 60 000 plants/ha in the drought stress treatments. The early genotype ICPL 86005 experienced a mild stress at IlongaRF (in comparison with IlongaIR) and a more severe stress at the other comparable (in terms of temperature) site, Kibaha. At IlongaRF optimum density for BY and SY was reduced as expected. However, at Kibaha, optimum densities were higher than those at IlongaRF, and for SY slightly higher than at IlongaIR. Where stress is severe from an early stage of crop growth, plant size is greatly reduced and this leads to the need for high densities to achieve what are still poorer yields under stress. Again, from Keatinge & Hughes (Reference Keatinge, Hughes and Virmani1981), plant size was 69·4 and 20·4 g/plant, respectively, in the irrigated and drought stress treatments. Optimum densities for the medium/late genotypes were also affected by drought in a similar or more severe manner, reflecting their later maturity and hence greater exposure to terminal drought. At both sites SY was affected slightly less than BY, suggesting some capacity to acclimate or remobilize leaf and stem reserves.
In conclusion, the current experiments at five sites in Tanzania have shown very clearly that the optimum plant density varies greatly between sites and genotypes (maturity groups). In general, higher plant densities are required at cool than warm sites and lower densities at drought-prone sites. Early maturing genotypes require much greater plant densities than medium and late maturing cvs at all sites. Plant breeders and agronomists should design multi-locational yield and adaptation trials accordingly.
JKM thanks the African Development Bank for financial support and ICRISAT for logistical support. The Leche Trust and the University of Reading Hardship Fund are also thanked for their support to JKM while in the UK.



