INTRODUCTION
Plasmodium falciparum is the pathogen associated with the most severe form of malaria. Chloroquine, mefloquine and a variety of other drugs have been used for therapeutics and prophylaxis against P. falciparum but strains resistant to all of these anti-malarials appeared in most regions where the disease is endemic. The clinical symptoms and pathogenesis of P. falciparum-induced malaria are associated exclusively with the asexual multiplication of this parasite during the erythrocytic cycle. We are interested in the intraerythrocytic proliferation of this parasite and in factors essential for growth.
Human serum-derived fatty acids are believed to be essential for the intraerythrocytic proliferation of P. falciparum (Holz, Reference Holz1977; Vial and Ancelin, Reference Vial, Ancelin and Sherman1998). These fatty acids are metabolized to various lipid species, such as phosphatidylcholine, phosphatidylethanolamine, diacylglycerol and triacylglycerol, all of which are major constituents of membranes and lipid bodies in this parasite (Vial et al. Reference Vial, Thuet and Philippot1982; Palacpac et al. Reference Palacpac, Hiramine, Mi-Ichi, Torii, Kita, Hiramatsu, Horii and Mitamura2004; Mi-Ichi et al. Reference Mi-Ichi, Kita and Mitamura2006). Although P. falciparum possesses the capacity for de novo fatty acid synthesis, most likely occurring in the apicoplast (Surolia and Surolia, Reference Surolia and Surolia2001), the amount and kind of fatty acids produced by this pathway appear to be limited, and the major source of fatty acids is human serum (Mitamura et al. Reference Mitamura, Hanada, Ko-Mitamura, Nishijima and Horii2000; Mi-Ichi et al. Reference Mi-Ichi, Kita and Mitamura2006).
We recently reported that only limited combinations of human serum-derived fatty acids can support long-term parasite culture, and palmitic acid (C16:0)/oleic acid (C18:1, n-9), palmitic acid (C16:0)/vaccenic acid (C18:1, n-7), or stearic acid (C18:0) are required in these combinations, implying that these fatty acids are key molecules for parasite growth (Mi-Ichi et al. Reference Mi-Ichi, Kita and Mitamura2006). These results led us to speculate that parasites show selectivity for the uptake and metabolism of serum-derived fatty acids. However, parasites are able to metabolize a broad range of fatty acids that are available in the environment (Mi-Ichi et al. Reference Mi-Ichi, Kita and Mitamura2006). This implies that P. falciparum may rely on fatty acid elongation and/or desaturation pathways for the synthesis of fatty acids that are essential for growth but are not available in the environment. Nevertheless, P. falciparum has been shown to utilize available fatty acids with limited modification (Mi-Ichi et al. Reference Mi-Ichi, Kita and Mitamura2006). These observations emphasize not only the uniqueness of fatty acid metabolism in P. falciparum but also the importance of key fatty acids for its intraerythrocytic proliferation. In this study, we analysed the roles of these fatty acids in the intraerythrocytic development of P. falciparum by assessing their effects on morphology and parasite number.
MATERIALS AND METHODS
Materials
Fatty acids (>99%) and fatty acid-free bovine serum albumin (BSA) (catalogue no.A7511), used as lipid-free BSA (Mitamura et al. Reference Mitamura, Hanada, Ko-Mitamura, Nishijima and Horii2000), were purchased from Sigma-Aldrich (St Louis, MO). Concentrations of 600 μm reconstituted lipid-rich BSA containing 300 μm each of various fatty acids was prepared essentially as described previously (Mitamura et al. Reference Mitamura, Hanada, Ko-Mitamura, Nishijima and Horii2000). Basal medium, standard medium and serum-free medium supplemented with 60 μm lipid-rich BSA were as described previously (Palacpac et al. Reference Palacpac, Hiramine, Mi-Ichi, Torii, Kita, Hiramatsu, Horii and Mitamura2004).
Parasite culture
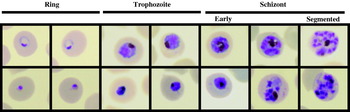
Cultures of the P. falciparum Honduras-1 isolate (Bhasin and Trager, Reference Bhasin and Trager1984) were maintained routinely and synchronized occasionally as described previously (Hanada et al. Reference Hanada, Mitamura, Fukasawa, Magistrado, Horii and Nishijima2000; Mitamura et al. Reference Mitamura, Hanada, Ko-Mitamura, Nishijima and Horii2000; Mi-Ichi et al. Reference Mi-Ichi, Kita and Mitamura2006). Aliquots of tightly synchronized parasite culture in serum-free medium supplemented with reconstituted lipid-rich BSA containing different fatty acids (5 ml culture with 3% haematocrit) were acquired at the indicated times and used for Giemsa-stained thin smears. Parasites of normal or abnormal appearance located within erythrocytes were counted separately. Normal or abnormal appearance was defined by parasite shape. Parasites with normal appearance clearly showed nuclei, brownish-yellow colored areas with black dots (assumed to be haemozoin within food vacuoles) and white dots (assumed to be lipid droplets), whereas parasites with abnormal appearance showed shrunken and dense, irregularly stained structures and did not show white dots (Fig. 1). Parasitaemia was determined by calculating the percentage of parasitized erythrocytes among at least 5000 erythrocytes and was an average of duplicate slides per sample. Counting of parasitized erythrocytes was performed by an investigator who was not notified of the experiment design. All experiments were performed twice. To monitor morphological changes, cells were imaged with an Olympus (Tokyo, Japan) BX50 microscope equipped with a Keyence (Osaka, Japan) high-sensitivity cooled CCD colour camera.
Morphologies for normal appearance and abnormal appearance. The morphologies seen in the major populations at each stage are shown. The upper and lower rows indicate normal and abnormal appearances, respectively.

Statistics
Mantel-Haenszel Chi-Square statistics was used to assess the difference in stage distributions at the indicated time between medium containing C16:0/C18:1, n-9 and in that containing C16:0/C18:2, n-6 (Stokes et al. Reference Stokes, Davis and Koch1995). Kendall's τ-b statistics was used to evaluate the strength of association between the time and the distribution of stages during the course of intraerythrocytic development in each medium containing C16:0/C18:1, n-9 or C16:0/C18:2, n-6 (Stokes et al. Reference Stokes, Davis and Koch1995).
RESULTS AND DISCUSSION
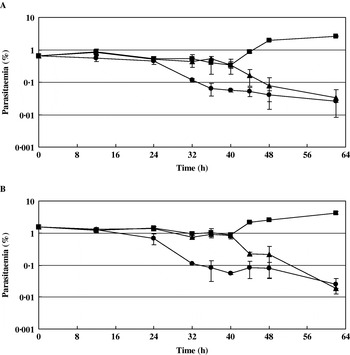
As in standard medium (basal medium supplemented with 10% human serum), parasites grew well in serum-free medium supplemented with reconstituted lipid-rich BSA containing C16:0/C18:1, n-9; a 3-fold increase in parasitaemia was observed at 48 h (Fig. 2). However, in serum-free medium containing only either C16:0 or C18:1, n-9, parasitaemia of tightly synchronized cultures initiated with ring-stage parasites decreased dramatically during the course of the erythrocytic cycle. Parasitaemia was ⩽0·2% at 48 h and nearly reached the low detection limit of microscopical quantification at 62 h in both media, regardless of the initial parasitaemias (0·65% or 1·57%) (Fig. 2).
Growth profiles of parasites in serum-free medium supplemented with reconstituted lipid-associated BSA containing a combination of fatty acids: C16:0 (●); C18:1, n-9 (▲); C16:0/C18:1, n-9 (■). Final concentrations of fatty acids used were C16:0, 30 μm; C18:1, n-9, 30 μm; C16:0/C18:1, n-9, 30 μm/30 μm. The tightly synchronized culture was set at ring with starting parasitaemia at 0·65% (A) and 1·57% (B). Error bar indicates the difference from the average.

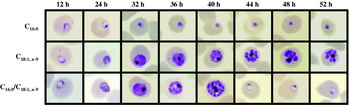
Growth profiles in different media reflected changes in the number of erythrocytes infected by parasites with normal morphology (Fig. 1). However, parasites with abnormal appearance were also observed in all samples. Major morphologies observed in each sample at the indicated times are shown in Fig. 3. In serum-free medium containing only C16:0, rings did not develop into trophozoites but rather became pycnotic. In medium containing only C18:1, n-9, rings developed into trophozoites and schizonts. Merozoites of shape similar to those in medium containing C16:0/C18:1, n-9 were observed at 40 h. However, apparently healthy rings (see Fig. 1) were not identified, even in cultures at 60 h (data not shown), implying that these merozoites were no longer released from the erythrocyte and gradually became pycnotic (48 and 52 h; data not shown). These results reflect the profiles of parasite growth in different media. Thus, it is likely that membranes necessary for development of healthy parasites are generated from saturated and unsaturated fatty acids. Alternatively, it may be that each fatty acid species exerts a distinct role on the intraerythrocytic development of P. falciparum because the time to arrest of intraerythrocytic development by C16:0 differed from that by C18:1, n-9. Detailed characterization of apparently normal trophozoites and schizonts and abnormal segmented schizonts in medium containing C18:1, n-9 remains to be performed.
Morphological changes over time of parasites grown in serum-free medium supplemented with reconstituted lipid-associated BSA containing a combination of fatty acids. Parasite morphology was observed under microscopy on Giemsa-stained slides. The fatty acids used are indicated at the left of each row. Final concentrations of fatty acids used were C16:0, 30 μm; C18:1, n-9, 30 μm; C16:0/C18:1, n-9, 30 μm/30 μm. Starting parasitaemia was set at 1·57%.

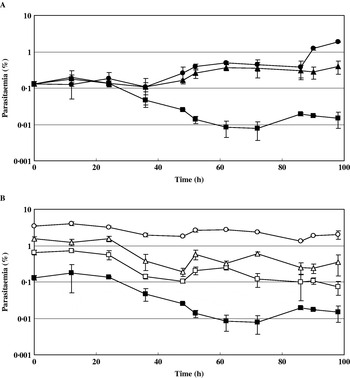
To examine the specificity of C18:1, n-9 on the effect on intraerythrocytic development of P. falciparum, we compared C18:1, n-9 with other unsaturated fatty acids of the same chain length but with different positions of the double bond or different degree of unsaturation (C18:1, n-7 and C18:2, n-6). We monitored parasitaemia for parasites of normal appearance in tightly synchronized cultures grown in serum-free medium supplemented with the lipid-rich BSA containing either C18:1, n-7 or C18:2, n-6 combined with C16:0 (Fig. 4) because parasite growth does not occur in the presence of a single fatty acid (Mitamura et al. Reference Mitamura, Hanada, Ko-Mitamura, Nishijima and Horii2000; Fig. 2). In medium containing C16:0/C18:1, n-9, parasitaemia increased exponentially until 96 h (Fig. 4A). Cultures grown in medium containing C16:0/C18:1, n-7 showed a similar profile with exponential growth until 86 h. Beyond this time, however, parasitaemia plateaued and even decreased in long-term cultures at 138 h. In medium containing C16:0/C18:2, n-6, parasitaemia was decreased at 20 h. In addition, similar profiles were obtained regardless of the starting parasitaemia (0·13%, 0·65%, 1·6% or 3·5%) (Fig. 4B).
Growth profiles of parasites in serum-free medium supplemented with reconstituted lipid-associated BSA containing a combination of fatty acids. (A) C16:0/C18:1, n-9 (●); C16:0/C18:1, n-7 (▲); C16:0/C18:2, n-6 (■). Starting parasitaemia was set at 0·13%. (B) Growth profiles in serum-free medium containing C16:0/C18:2, n-6. Starting parasitaemia: 3·49% (○); 1·57% (Δ); 0·65% (□); 0·13% (■). Final concentrations of fatty acids used were C16:0/C18:1, n-9, 30 μm/30 μm; C16:0/C18:1, n-7, 30 μm/30 μm; C16:0/C18:2, n-6, 30 μm/30 μm. Error bar indicates the difference from the average.

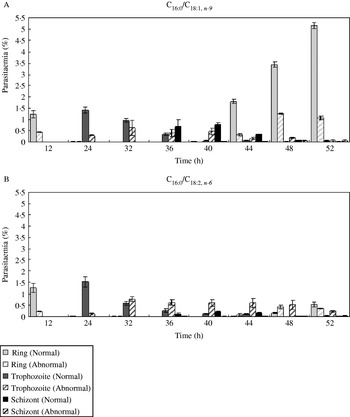
We next assessed populations of each stage in tightly synchronized cultures grown in serum-free medium containing C16:0/C18:1, n-9 or C16:0/C18:2, n-6 during the course of intraerythrocytic development, noting whether parasites were of normal or abnormal morphology (Fig. 5). In medium containing C16:0/C18:1, n-9, parasites of normal appearance proceeded through stage progression and entered the next erythrocytic cycle by 40 h. Newly formed rings increased in number from 40 h to 52 h (Fig. 5A). In medium containing C16:0/C18:2, n-6, as in parasites grown in medium containing C16:0/C18:1, n-9, parasites of normal appearance proceeded to trophozoite and schizont stages, and newly formed rings appeared from 44 h (Fig. 5B). In addition, the numbers of newly formed rings were much lower than in cultures grown in medium containing C16:0/C18:1, n-9. These results imply that, despite supporting the intraerythrocytic development of P. falciparum, the population of parasites that entered the next erythrocytic cycle differed between C18:1, n-9 combined with C16:0 and C18:2, n-6 combined with C16:0.
Distribution of each stage during the course of intraerythrocytic development. Parasitaemia was determined at different stages in cultures grown in serum-free medium supplemented with reconstituted lipid-associated BSA containing a combination of fatty acids. (A) C16:0/C18:1, n-9. (B) C16:0/C18:2, n-6. Parasites of normal appearance and those of abnormal appearance were counted separately. Starting parasitaemia was set at 1·57%. Final concentrations of fatty acids used were C16:0/C18:1, n-9, 30 μm/30 μm; C16:0/C18:2, n-6, 30 μm/30 μm. Error bar indicates the difference from the average.

With respect to parasites of abnormal appearance, in medium containing C16:0/C18:1, n-9, only a minor population of parasitized erythrocytes (in <40% of total parasitized erythrocytes) were abnormal. However, in medium containing C16:0/C18:2, n-6, from 32 h on, large numbers of abnormal trophozoites were observed (in >50% of total parasitized erythrocytes), and these were predominant at 44 h.
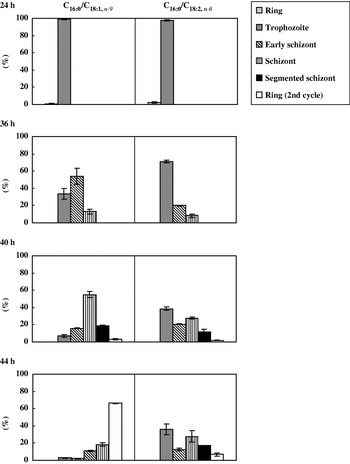
Differences in the effects of unsaturated fatty acid species on stage progression became more evident when we compared stage distribution by percentage (Fig. 6). We focused only on parasites of normal appearance. From 36 h onwards, the distribution of stages in medium containing C16:0/C18:1, n-9 is statistically different from that in medium containing C16:0/C18:2, n-6 (Cochran-Mantel-Haenszel P-values: 0·56 at 24 h; 0·0001 at 36 h; <0·0001 at 40 h; <0·0001 at 44 h). In fact, synchronicity was well maintained until 24 h, at the trophozoite stage, in media containing C16:0/C18:1, n-9 or C16:0/C18:2, n-6. At 36 h, a slight delay in development was observed in medium containing C16:0/C18:2, n-6. At 40 h, decreased synchronicity became remarkable: all stages, with the exception of ring forms, could be seen. At 44 h, the percentage of newly formed rings was much lower than that of trophozoite and schizont, and the parasites at these mature stages subsequently showed abnormalities in shape, finally becoming pycnotic within the erythrocyte (data not shown). In medium containing C16:0/C18:1, n-9, synchronicity was maintained until at least 44 h. At 36 and 40 h, schizont and segmented schizont stages were predominant, and at 44 h, the percentage of newly formed ring stage forms increased as the percentages of the schizont and segmented schizont stages decreased, indicating the onset of the next intraerythrocytic cycle. This interpretation was supported by statistics evaluating the strength of the association of the time and the distribution of stages in each medium containing C16:0/C18:1, n-9 or C16:0/C18:2, n-6 (Kendall's τ-b: 0·81 in C16:0/C18:1, n-9; 0·46 in C16:0/C18:2, n-6).
Distribution of each stage during the course of intraerythrocytic development. Percentages of total parasites at each stage at 24 h, 36 h, 40 h and 44 h are shown. Only the data for parasites of normal appearance from Fig. 5 were used. Results are expressed as a percentage of the parasitaemia at each stage to total parasitaemia at the indicated time. Error bar indicates the difference from the average.

A similar assessment of the effects of C18:1, n-7 was performed except that analysis was conducted from 48 h to 100 h, corresponding to the second and transition to the third erythrocytic cycles, during which the growth rate decreased significantly as was seen in medium containing C16:0/C18:2, n-6 at 1–52 h. Results obtained in medium containing C16:0/C18:1, n-7 were similar to those obtained in medium containing C16:0/C18:2, n-6 (data not shown).
We analysed the morphological changes of parasites grown in different serum-free media at the indicated times (Fig. 7). Again we focused only on parasites of normal appearance, and the major morphologies in each sample are shown. In medium containing C16:0/C18:1, n-7 or C16:0/C18:2, n-6, development proceeded from ring through trophozoite and schizont to segmented schizont, similar to that in medium containing C16:0/C18:1, n-9. However, a delay of approximately 4 h was observed. At 36 h, parasites developed into trophozoites, whereas parasites grown in medium containing C16:0/C18:1, n-9 reached this stage at 32 h. From 40 to 44 h, parasites grown in medium containing C16:0/C18:1, n-7 or C16:0/C18:2, n-6 progressed from schizont to segmented schizont, whereas this stage was reached by 36–40 h in medium containing C16:0/C18:1, n-9. At 44 h, newly formed rings appeared and were predominant at 52 h in medium containing C16:0/C18:1, n-7 or C16:0/C18:2, n-6, whereas this stage was reached at 40 h and was predominant at 48 h in medium containing C16:0/C18:1, n-9. Thus, we inferred that it takes 44 h and 48 h to complete 1 erythrocytic cycle in medium containing C16:0/C18:1, n-9 and C16:0/C18:1, n-7 or C16:0/C18:2, n-6, respectively.
Morphological changes over time of parasites grown in serum-free medium supplemented with reconstituted lipid-associated BSA containing a combination of fatty acids. Parasite morphology was observed under microscopy on Giemsa-stained slides. Starting parasitaemia was set at 0·13%. The combinations of fatty acids used are indicated at the left side of each row. Final concentrations of fatty acids used were C16:0/C18:1, n-9, 30 μm/30 μm; C16:0/C18:1, n-7, 30 μm/30 μm; C16:0/C18:2, n-6, 30 μm/30 μm.

The results of the present study showed that despite morphological similarities in stage progression, C18:1, n-7 or C18:2, n-6, when paired with C16:0 in serum-free medium, support the growth of only limited populations, resulting in decreased parasitaemias. Given that C18:1, n-9, C18:1, n-7 and C18:2, n-6 differ with respect to the position of the double bond or the degree of unsaturation, it is intriguing that P. falciparum differentiates not only the structure of C18 unsaturated fatty acids but also the position of the double bond in C18 monoenoic acids. Taken together, we inferred that C18:1, n-9 is indispensable for the intraerythrocytic proliferation of P. falciparum.
We thank Ms Hisako Araki for technical assistance and Dr Tetsuya Mizoue for helping statistical analyses. This work was supported by grants from the PRESTO program of the Japan Science and Technology Agency and from the Pharmaceutical and Medical Devices Agency.