Introduction
In primates, visual information transmitted through the retino-geniculo-cortical route is carried along parallel visual pathways, through distinct parvocellular (P), magnocellular (M), and koniocellular (K) layers of the lateral geniculate nucleus (LGN). Previous electrophysiological studies in macaque (Lennie et al., Reference Lennie, Krauskopf and Sclar1990; Johnson et al., Reference Johnson, Hawken and Shapley2004; Solomon & Lennie, Reference Solomon and Lennie2005; Horwitz et al., Reference Horwitz, Chichilnisky and Albright2007) and marmoset (Hashemi-Nezhad et al., Reference Hashemi-Nezhad, Blessing, Dreher and Martin2008) suggest that short wavelength (S) cone inputs to the majority of V1 cells are weak, on average accounting for <10% of the total cone input (but see Cottaris & De Valois, Reference Cottaris and De Valois1998; Chatterjee & Callaway, Reference Chatterjee and Callaway2003). Cells with strong responses to S-cone isolating stimuli are found in the LGN of macaque (Malpeli & Schiller, Reference Malpeli and Schiller1978; Schiller & Malpeli, Reference Schiller and Malpeli1978; Valberg et al., Reference Valberg, Lee and Tigwell1986; Roy et al., Reference Roy, Jayakumar, Martin, Dreher, Saalmann, Hu and Vidyasagar2009) and marmoset (Martin et al., Reference Martin, White, Goodchild, Wilder and Sefton1997; White et al., Reference White, Wilder, Goodchild, Sefton and Martin1998; Szmajda et al., Reference Szmajda, Buzas, Fitzgibbon and Martin2006; Tailby et al., 2008a; Tailby et al., 2008b), and in the retinae of macaque (Malpeli & Schiller, Reference Malpeli and Schiller1978; Dacey & Lee, Reference Dacey and Lee1994; Dacey & Packer, Reference Dacey and Packer2003) and capuchin (Silveira et al., Reference Silveira, Lee, Yamada, Kremers, Hunt, Martin and Gomes1999). Cells with S-cone input have not been reported in studies of owl monkey and bush baby consistent with the lack of S-cones in these species (Wikler & Rakic, Reference Wikler and Rakic1990). The V1 cells that resemble either +S (Blue-ON) or –S (Blue-OFF) LGN cells are rare (De Valois et al., Reference De Valois, Cottaris, Elfar, Mahon and Wilson2000). Furthermore, most V1 cells are tuned to a wide range of chromaticities, not just along the long (L) and medium (M) wavelength cone opponent (“Red-Green”) axes or S vs. ML cone opponent (“Blue-Yellow”) axes of LGN cells (Lennie et al., Reference Lennie, Krauskopf and Sclar1990; Gegenfurtner, Reference Gegenfurtner2003). This raises the possibility that S-cone signals in V1 do not arrive directly from LGN Blue-ON cells, but via known projections of koniocellular pathways to prestriate cortical areas (Fries, Reference Fries1981; Yoshida & Benevento, Reference Yoshida and Benevento1981; Yukie & Iwai, Reference Yukie and Iwai1981; Bullier & Kennedy, Reference Bullier and Kennedy1983; Kennedy & Bullier, Reference Kennedy and Bullier1985; Beck & Kaas, Reference Beck and Kaas1998; Stepniewska et al., Reference Stepniewska, Qi and Kaas1999; Sincich et al., Reference Sincich, Park, Wohlgemuth and Horton2004; Warner et al., Reference Warner, Goldshmit and Bourne2010; Jayakumar et al., Reference Jayakumar, Roy, Dreher, Martin and Vidyasagar2013). Our primary aim in the present study is to test if LGN cells with strong S-cone responses (koniocellular Blue-ON or K-BON cells) project directly to V1. We studied the common marmoset (Callithrix jacchus), a species with a well-characterized K-BON pathway (Martin et al., Reference Martin, White, Goodchild, Wilder and Sefton1997; Tailby et al., 2008a; Tailby et al., 2008b).
Tract tracing studies show that axons originating in P, M, and K layers project to V1 (Wiesel & Hubel, Reference Wiesel and Hubel1966; Hubel & Wiesel, Reference Hubel and Wiesel1972; Lund, Reference Lund1973; Henderickson et al., Reference Henderickson, Wilson and Ogren1978; Spatz, Reference Spatz1979; Fitzpatrick et al., Reference Fitzpatrick, Itoh and Diamond1983; Livingstone & Hubel, Reference Livingstone and Hubel1988; Casagrande, Reference Casagrande1994; Hendry & Yoshioka, Reference Hendry and Yoshioka1994; Solomon, Reference Solomon2002). For the P and M pathways, these connections have also been electrophysiologically confirmed using antidromic stimulation (Sherman et al., Reference Sherman, Wilson, Kaas and Webb1976; Schiller & Malpeli, Reference Schiller and Malpeli1978; Norton & Casagrande, Reference Norton and Casagrande1982; Irvin et al., Reference Irvin, Norton, Sesma and Casagrande1986; Norton et al., Reference Norton, Casagrande, Irvin, Sesma and Petry1988). Antidromic activation of K cells in the Galago showed there are direct projections from K cells to V1 (Norton & Casagrande, Reference Norton and Casagrande1982; Irvin et al., Reference Irvin, Norton, Sesma and Casagrande1986). However, as the Galago does not have S-cones, it is unknown whether the K-BON cell type projects directly to V1.
Anatomical evidence shows that K cells project to the cytochrome oxidase blobs in the superficial layers of V1 (Livingstone & Hubel, Reference Livingstone and Hubel1982; Fitzpatrick et al., Reference Fitzpatrick, Itoh and Diamond1983; Diamond et al., Reference Diamond, Conley, Itoh and Fitzpatrick1985; Lachica & Casagrande, Reference Lachica and Casagrande1988; Hendry & Yoshioka, Reference Hendry and Yoshioka1994; Solomon, Reference Solomon2002). In the superficial cortical layers of muscimol-inactivated macaque V1 strong ON-type S-cone responses have been recorded (Chatterjee & Callaway, Reference Chatterjee and Callaway2003). Here, we show using antidromic stimulation that these signals likely arrive by direct projection from K-BON cells in the LGN.
Animal and human studies show that S-cone signals are processed more slowly within the brain by approximately 20 ms (Krauskopf, Reference Krauskopf1973; Rabin et al., Reference Rabin, Switkes, Crognale, Schneck and Adams1994; McKeefry et al., Reference McKeefry, Parry and Murray2003; Smithson & Mollon, Reference Smithson and Mollon2004; Lee et al., Reference Lee, Mollon, Zaidi and Smithson2009). In macaque, signals from the P pathway reach V1 10–20 ms later than signals from the M pathway (Marrocco, Reference Marrocco1976; Maunsell & Gibson, Reference Maunsell and Gibson1992; Nowak et al., Reference Nowak, Munk, Girard and Bullier1995). Latency differences between the three parallel pathways makes integration of visual information more challenging. Our secondary aim is therefore to compare the antidromic latencies of K-BON cells to antidromic latencies of P and M cells and to understand how antidromic latencies contribute to overall latency differences between the visual pathways. We establish that the antidromic latencies of K-BON cells are similar to those of P cells, which carry L and M cone signals. We also find that LGN cells that have the shortest response latency to visual stimulation also have the shortest antidromic latencies.
Materials and methods
Experimental procedures conformed to the Australian National Health and Medical Research Council (NHMRC) codes of practice for the use and care of animals and were approved by institutional animal care and ethics committees at the University of Sydney. The recordings described here were made from 7 adult common marmosets (Callithrix jacchus, 5 male dichromats, 1 female dichromat and 1 female trichromat).
Animal preparation
Marmosets were initially anesthetized through intramuscular injection of alfaxalone (12 mg kg−1; Alfaxan, Lyppard, VIC, Australia). Subsequent surgery was performed under supplemental local anesthesia (Lignocaine 2%; AstraZeneca, NSW, Australia) and supplementary doses of anesthetic were given as required. A tail vein was cannulated to allow the administration of fluids and drugs. A tracheotomy was performed for artificial respiration of the animal with a mixture of 70% NO2 and 30% carbogen (5% CO2: 95% O2). The head was placed in a stereotaxic frame and craniotomies were made over the LGN and V1.
Post-surgical anesthesia was maintained by intravenous sufentanil citrate (6–12 μg kg−1 hr−1; Sufenta Forte, Janssen-Cilag, NSW, Australia) in physiological solution (sodium lactate, Baxter International, NSM, Australia) with added dexamethasone (0.4 kg h−1; Mayne Pharma, VIC, Australia) and Synthamin 17 (225 mg kg−1 h−1; Baxter International, NSW, AUS). Electroencephalogram (EEG) and electrocardiogram signals were monitored to ensure adequate depth of anesthesia. The EEG signal was subjected to Fourier analysis. Dominance of low frequencies (1–5 Hz) in the EEG recording and absence of EEG or heart rate changes under a noxious stimulus (tail-pinch) were taken as the chief sign of an adequate level of anesthesia. We found that low dose rates of sufentanil in the range cited above were always effective during the first 24 h of recordings. Drifts toward higher frequencies (5–10 Hz) in the EEG record were counteracted by increased rate or higher concentration of sufentanil administered. The typical duration of a recording session was 72–96 h.
Muscular paralysis was induced and maintained by adding pancuronium bromide (0.24 mg kg−1 hr−1, AstraZeneca, NSW, Australia) to the infusion solution. Body temperature was kept near 38°C using a homeostatic blanket controlled via a rectal probe. End tidal CO2 was maintained near 37 mmHg by adjusting the rate and volume of ventilation. Additional antibiotics and anti-inflammatory drugs were given daily by intramuscular injection of 25 mg penicillin (Norocillin, Norbrook, Corby, Northamptonshire, UK), and 0.1 mg dexamethasone. The pupils were dilated with minims (phenylephrine hydrochloride 10%, Chauvin Pharmaceuticals, Kingston-upon-Thames, Surrey, UK) and the corneas were protected with gas permeable contact lenses that remained in place for the duration of the experiment. Supplementary lenses (with power determined by maximizing the spatial resolution of the first receptive fields encountered for each eye) were used to focus the eyes at a distance of 114 cm.
Recording procedures
Recordings were made with single electrodes (stainless steel, 9–11 MΩ, FHC, Bowdoinham, ME, USA) in the LGN of the right hemisphere. Neuronal signals were amplified and band-pass filtered (0.3–10 kHz). A Power Mac G5 running data acquisition software (EXPO/OpenGL; P. Lennie, University of Rochester, Rochester, NY) was used to capture the spike events for functional classification of cells. Spike events were recorded with a resolution of 0.1 ms. Analog signals from the electrodes were amplified, filtered, and sampled at 48 kHz by the same computer that generated the visual stimulus. Putative spikes were displayed on a monitor and templates for discriminating spikes were constructed by analyzing multiple traces. The timing of waveforms that cohered to the template was recorded with an accuracy of 0.1 ms.
Raw waveforms of LGN extracellular potentials used to record antidromic activation were stored using a digital storage oscilloscope (Tektronix DPO2014, Beaverton, OR, USA). Conduction latency was measured from the beginning of the stimulus artifact to the start of the electrically evoked spike, that is, the initial deflection from the stimulus artifact potential. Latencies were measured for multiple trials and averaged (mean number of trials = 8). All off-line analysis was performed using Matlab (2008a, MathWorks, Natick, MA, USA).
Antidromic stimulation
The ipsilateral primary visual cortex (V1) was stimulated using bipolar electrodes. Four to six small holes (approximately 1 mm diameter) were drilled in the skull over V1 in a grid array. The dura was perforated using a 26-gauge needle. Custom-made bipolar electrodes were constructed from insulated 0.05 mm diameter nickel-chromium wire, formed into twisted pairs, with tips exposed by removing the insulation coating with a scalpel blade. The electrodes were inserted though the dura and fixed using dental cement. Each electrode had a vertical tip separation of approximately 0.5 mm. The electrode tip was positioned approximately 0.5–1.0 mm below the surface of the dura. The appropriate depth of insertion was functionally determined. The local field potential (LFP, 0.3–300 Hz) signal was amplified and displayed on an oscilloscope while presenting a large flashing uniform achromatic stimulus with a temporal frequency close to 4 Hz. The appropriate depth of insertion was established when a clear, stimulus-locked modulation in the LFP could be seen. The receptive field of the modulated component of the LFP was mapped onto a tangent screen.
For each isolated LGN cell, we tested for antidromic activation from V1 using 50 µs biphasic electrical pulses with a maximum stimulation frequency of 2 Hz, at varying amplitudes below 4 mA. Cells were selected for further analysis when V1 stimulation produced a putative antidromic action potential on more than 80% of stimulation trials.
Antidromic action potentials were distinguished by performing the collision test (Bishop et al., Reference Bishop, Burke and Davis1962). The extracellular action potentials were fed into a threshold discriminator. A TTL pulse output from the discriminator was fed into an electrical stimulus generator to trigger electrical stimulation of V1. The delay between spontaneous action potential and electrical stimulus was adjusted manually and varying delays (0–3 ms) were tested. Multiple (>5) trials were recorded for each delay.
Visual stimuli
Receptive field position and stimulus selectivity were initially mapped using small patches of drifting grating on a tangent screen. A front-silvered mirror was used to bring the receptive field onto the center of a calibrated cathode ray tube monitor (Sony G520, refresh rate 100 Hz). The monitor was calibrated by first determining the relationship between the output of the video card and the photopic luminance for each phosphor. The inverse of this relationship was applied to the signals that were sent to the video card. Visual stimuli were drawn with 8-bits per channel resolution using commands to OpenGL. Visual stimuli were presented monocularly to the dominant eye. Cone-isolating stimuli were generated using methods previously described (Tailby et al., Reference Tailby, Cheong, Pietersen, Solomon and Martin2012). The background had mean luminance of 45 cd m−2 and chromaticity close to CIE coordinates: x = 0.361, y = 0.363.
Visual stimuli comprised drifting sinusoidal gratings or uniform fields modulated in time; all stimuli modulated around the mean luminance and were presented within a circular window with hard edges, outside which the screen (20 × 15 deg) was held at the mean luminance. For each cell, the optimal spatial frequency, temporal frequency, and contrast were determined using achromatic drifting gratings. For cells that received robust S-cone input, optimal parameters were determined using S-cone isolating stimuli.
Cells were categorized according to their receptive field properties (Cheong et al., Reference Cheong, Tailby, Martin, Levitt and Solomon2011; Cheong et al., Reference Cheong, Tailby, Solomon and Martin2013). For all cells, their sign (ON-center or OFF-center) and contrast response function were determined. Cells in the koniocellular layer receiving Blue-ON input (K-BON cells) were distinguished by their vigorous excitatory response to S-cone isolating stimuli (Dacey & Lee, Reference Dacey and Lee1994; Yeh et al., 1995a; Martin et al., Reference Martin, White, Goodchild, Wilder and Sefton1997; Tailby et al., 2008a; Tailby et al., 2008b). The P cells showed sustained responses to maintained contrast and linear responses to increasing contrast (Schiller & Malpeli, Reference Schiller and Malpeli1978; Derrington & Lennie, Reference Derrington and Lennie1984; Yeh et al., 1995b). The M cells showed transient responses to maintained contrast, saturating responses to increasing contrast, and response phase advance from intermediate to high contrast levels (Schiller & Malpeli, Reference Schiller and Malpeli1978; Derrington & Lennie, Reference Derrington and Lennie1984; Yeh et al., 1995b; Solomon & Lennie, Reference Solomon and Lennie2005).
Visual latency
Visual response latency was measured using a spatially uniform field presented within a circular window between 1 and 4° in diameter, centered on the cell’s receptive field. The P and M cells were presented with their preferred (ON or OFF) achromatic contrast sign. An S-cone isolating stimulus was used for K-BON cells. The stimulus was presented for 200 ms at 70% cone contrast. One hundred trials were collected.
To calculate visual onset latency action potentials were folded into a peri-stimulus time histogram (PSTH) using a 2 ms bin width. The first two consecutive bins in the PSTH where response rate was three or more standard deviations above the mean spontaneous discharge rate were determined. A linear fit was calculated from the first of these bins to the initial response peak. This line was then back-extrapolated to the spontaneous discharge rate and the time of the intersection was taken as response latency. To correct for the time delay caused by the OpenGL frame buffer interface and CRT beam fly-time to the center of the screen, 25 ms was subtracted from the computer-recorded spike time-stamps. This delay was measured by recording the “response” latency of a photodiode placed in the center of the screen.
Statistics
Data are presented as mean ± standard deviation unless stated otherwise. The Wilcoxon rank sum test was used to compare group values unless stated otherwise.
Results
We present data from 5 K-BON cells and one “non-Blue” K cell that were antidromically activated from V1. Data were also obtained from 14 M and 7 P cells. First, we show functional evidence for direct feed-forward connections between LGN K-BON cells and V1. Second, we compare the antidromic latencies among LGN cells across the parallel pathways. Finally, for a subset of cells recorded (1 K-BON, 8 M and 3 P) we compare the response latency to visual stimulation with the antidromic latencies to V1 stimulation.
Functional cell categorization
Fig. 1 shows visual response properties of example M-OFF (Fig. 1A–1C), P-OFF (Fig. 1D–1F) and K-BON (Fig. 1G–1I) cells in marmoset LGN. The M cell shows a transient response to an achromatic stimulus, no response to an S-cone isolating stimulus, and saturating contrast response to drifting achromatic gratings. The P cell shows a sustained response to an achromatic stimulus, no response to an S-cone isolating stimulus, and linear contrast tuning to achromatic gratings. The K-BON cell shows no response to an achromatic stimulus, sustained response to an S-cone isolating stimulus, and linear contrast tuning to S-cone isolating gratings.
Functional properties of LGN cells. Functional properties of an M cell (A–C), P cell (D–F), and Blue-ON K cell (G–I) in the LGN. (A, D, G) Response to a brief (200 ms) presentation of an achromatic, 70% contrast, uniform field stimulus of the cells preferred polarity (ON or OFF). PSTH averaged over 100 trials shown. The black bar below each trace indicates the time of stimulus presentation. (B, E, H) Response to the presentation of an S-cone isolating, 70% contrast, uniform field stimulus of the cells preferred polarity. The yellowish-green bars in B and E indicate an S-OFF stimulus (S-cone contrast decrement), blue bar in H indicates S-ON stimulus (S-cone contrast increment). (C, F, I) Contrast tuning curves showing the modulated (F1) response to drifting achromatic gratings in C and F, and S-cone isolating grating in I. Spatial frequency was 1.6 cycle deg−1 in each case. Error bars show SEM.

Antidromic activation of LGN cells from V1 stimulation
In the antidromic method, action potentials are evoked on the terminals of LGN cells within V1, travel antidromically to the LGN, and are recorded by the extracellular electrode. Antidromic activation of an M cell is shown in Fig. 2A–2D (same cell as in Fig. 1A–1C). Fig. 2A shows the waveform of a “spontaneous” action potential from the M cell. Fig. 2B shows recorded waveforms during V1 stimulation trials at increasing levels of current (0.1, 0.3, 1, and 3 mA). The stimulus artifact, marked with a thunderbolt symbol, indicates the time of V1 stimulation. For V1 stimulus amplitudes greater than 1 mA, the LGN electrode detected changes in extracellular potentials (indicated by the red arrow). In this example, the potential included small monophasic and large diphasic potentials, which are thought to arise due to the activation of different regions of the same cell (Fuortes et al., Reference Fuortes, Frank and Becker1957; Bishop et al., Reference Bishop, Burke and Davis1962). Fuortes, Bishop and colleagues referred to the small and large potentials as A and B potentials, respectively. Using stimulus strength of 3 mA, LGN action potentials were evoked with a reliability of 92% (11/12 trials) for this cell. Fig. 2C shows an overlay of five consecutive stimulations at 3 mA. In one trial, only the monophasic potential was recorded.
Antidromic activation of an M cell and Blue-ON K cell. Extracellular recordings from an M cell (A–D). (A) Waveform of a spontaneous action potential. (B) Recorded waveforms of the M cell during V1 stimulation at increasing amplitudes. Note that the stimulus artifact (thunderbolt) increases in amplitude with greater stimulus strength. The stimulus threshold of this cell to evoke an action potential was 1 mA. Red arrow indicates an electrically evoked action potential. (C) Overlay of five stimulations at 3 mA. In one trial, no action potential was triggered. (D) Results of the collision test. Green asterisk indicates the spontaneous action potential. Delay of stimulation is indicated below each trace. Antidromic action potentials were recorded after a delay greater or equal to 1.19 ms. (E–G) Extracellular recordings from a Blue-ON K cell, details as above. (E) Waveform of a spontaneous action potential. (F) Repeats of stimulation at 1 mA showing reliable (7/7) activation of the electrically evoked action potential. (G) Collision test. Antidromic action potentials were recorded after a delay greater or equal 1.50 ms.
To determine whether the evoked action potential was antidromic or orthodromic, the collision test (Bishop et al., Reference Bishop, Burke and Davis1962) was employed. Area V1 was stimulated with varying delay after a spontaneous action potential (Fig. 2D). For this M cell, cortical stimulation evoked an antidromic potential with delays of 1.19 ms or greater. Using shorter delays, the antidromic potential was never detected. Thus, the evoked action potential was antidromic and this M cell projects directly to V1, as expected (Sherman et al., Reference Sherman, Wilson, Kaas and Webb1976; Schiller & Malpeli, Reference Schiller and Malpeli1978; Norton & Casagrande, Reference Norton and Casagrande1982; Irvin et al., Reference Irvin, Norton, Sesma and Casagrande1986).
Direct functional connectivity of K-BON cells to V1
Here, we show that koniocellular LGN cells with Blue-ON receptive fields project to V1 directly. Five of the six K cells in our sample were K-BON cells. Fig. 2E–2G shows an example of a K-BON antidromically activated from V1 (same cell as in Fig. 1G–1I). Fig. 2E shows a spontaneous action potential. Fig. 2F shows seven consecutive stimulation trials at 1 mA overlaid. An evoked action potential was observed in 100% (7/7) of stimulation trials. The collision test shows that for latencies below 1.5 ms the evoked action potential disappeared (Fig. 2G). Thus, this K-BON cell had a direct functional projection to V1.
Fig. 3 shows recordings from 59 consecutive trials of a collision test for another K-BON cell. The recordings are shown in a color map representation (Fig. 3C); each trial is aligned to the stimulus artifact. Across the 59 trials, the pre-stimulation delay (delay between spontaneous action potential in LGN and V1 electrical stimulation) started at 2 ms, decreased to 1.1 ms, and then increased again to 2 ms. Each row in the color map represents one trial. Nominal waveform amplitude is indicated by color. Two trials are shown as traces above the color map to aid the interpretation of the color map. The top trace (Fig. 3A) shows a trial with delay of 1.1 ms without an evoked action potential, and the bottom trace (Fig. 3B) shows a trial with delay of 1.8 ms with an evoked action potential (red arrow) present. Note that the evoked spike on the color map appears as a discontinuous vertical blue line. The evoked spike was never recorded for delays of 1.3 ms or less, occasionally for delays of 1.5 ms, and nearly always for delays 1.6 ms or greater. We conclude that K-BON cells, which carry S-cone (“Blue” color) signals, make direct functional projections to V1.
Collision test of a Blue-ON K cell. Consecutive recordings (n = 59) of a collision test for a Blue-ON K cell represented as a color map. Each row shows one stimulation trial aligned to the stimulus artifact. Two trials are plotted above in two-dimensional representation for reference. Stimulation delay began at 2 ms, decreased to 1.1 ms and increased back to 2 ms. Green asterisks indicate spontaneous spikes; thunderbolts, stimulus artifacts; and red arrows, antidromic spikes. The antidromic spikes in the color map appear as an interrupted blue line. The antidromic spike was not detected when the delay fell below 1.6 ms but reappeared when the delay increased above 1.5 ms.
Summary of antidromic latencies of LGN cells
A total of 27 LGN cells were antidromically activated from V1. A summary of antidromic latencies is shown in Fig. 4A–4C.
Antidromic latencies and visual latencies of LGN cells. All antidromically activated LGN cells (n = 27, solid bars) from V1. (A) M cells had mean antidromic latency of 1.17 ± 0.21 ms (n = 14). One M cell was activated indirectly (open bar) with latency 3.81 ms. (B) The P cells had mean antidromic latency of 1.93 ± 0.20 ms (n = 7). (C) The mean antidromic latency of K cells was 2.00 ± 0.37 ms (n = 6). Blue bars indicate K-BON cells. Dark gray bar indicates a non-Blue K cell. (D) Visual response latencies were measured for 12 of the 27 LGN cells and correlate with antidromic latency; r2 = 0.69, P < 0.01.
The M cells (Fig. 4A, solid bars) had the shortest latency, 1.17 ± 0.21 ms (n = 14). In addition, one M cell showed indirect connectivity with V1, with an electrically evoked potential latency of 3.81 ms (Fig. 4A, open bar). The evoked action potential did not disappear with short delays (<1ms) and along with the long latency, consistent with a synaptic delay from the V1 afferent onto the LGN cell, suggests that this cell was activated orthodromically.
The P cells had an antidromic latency of 1.93 ± 0.20 ms (n = 7, Fig. 4B). These latencies were significantly longer than those of M cells (P < 0.01). The K-BON cells (Fig. 4C, blue bars) had a latency of 1.80 ± 0.27 ms (n = 5). These latencies were significantly longer than those of M cells (P < 0.01) but not those of P cells (P = 0.73). One K cell that responded to achromatic modulation but not to S-cone modulation (Fig. 4C, dark gray bar) had an antidromically latency of 2.39 ms.
Twenty-three out of 27 cells had eccentricities within seven degrees. Eccentricities of each group were: M cells 4.45 ± 2.09°, P cells 4.74 ± 4.18°, and K-BON cells 7.79 ± 6.58°; groups were not statistically different from each other (P > 0.05).
In summary, K-BON cells have comparable antidromic latencies to P cells, whereas M cells have significantly faster latencies than both P and K cells.
Contribution of conduction latency of LGN cells to signal latency of the visual pathways
Several studies show that S-cone signals are processed more slowly in the brain and arrive later in V1 (Rabin et al., Reference Rabin, Switkes, Crognale, Schneck and Adams1994; McKeefry et al., Reference McKeefry, Parry and Murray2003; Smithson & Mollon, Reference Smithson and Mollon2004; Lee et al., Reference Lee, Mollon, Zaidi and Smithson2009). Visual response latencies in superficial cortex, the targets of koniocellular cells, are 15 ms longer than responses in layer 4C (Maunsell & Gibson, Reference Maunsell and Gibson1992). Here, we investigate the contribution of conduction latencies of LGN cells to the overall signal latency of visual signals traveling along the retino-geniculate-cortical pathway.
For 12 antidromically activated LGN cells (8 M, 3 P, 1 K-BON), we measured onset latency of response to visual stimulation using small uniform fields (1–4 deg diameter) of high contrast (see Materials and methods). Visual latency was not recorded for all LGN cells because recordings were not always held long enough to allow this measurement in addition to response characterization and antidromic stimulation.
Visual latency and antidromic latency in all types of LGN cells are strongly correlated (r2 = 0.69, P < 0.001, Fig. 4D). The overall signal latency of the feed-forward visual pathway, from the time of visual presentation to signals arriving in V1, can be estimated by summing the visual and conduction latencies of the LGN cells. Thus, the LGN to V1 conduction latencies contribute about 6.8 ± 1% to the overall signal latency of the visual pathway.
Discussion
Our main findings are that LGN K cells carrying S-cone signals make direct functional projections to V1 and that these projections have comparable antidromic latencies to P cells. Our results support the conclusions of previous anatomical studies indicating that K cells project to V1 directly (Livingstone & Hubel, Reference Livingstone and Hubel1982; Fitzpatrick et al., Reference Fitzpatrick, Itoh and Diamond1983; Diamond et al., Reference Diamond, Conley, Itoh and Fitzpatrick1985; Lachica & Casagrande, Reference Lachica and Casagrande1992; Hendry & Yoshioka, Reference Hendry and Yoshioka1994; Solomon, Reference Solomon2002; Casagrande et al., Reference Casagrande, Yazar, Jones and Ding2007). Our results are also consistent with Chaterjee and Callaway’s (Reference Chatterjee and Callaway2003) demonstration that S-cone mediated visual responses persist under blockade of intrinsic V1 activity by the GABAa receptor agonist muscimol.
We used bipolar electrodes (pole separation approximately 0.5 mm) for antidromic stimulation to reduce the possibility that we might electrically stimulate axons that invade other cortical areas (e.g. V2). The bipolar configuration means that only a small volume of cortical tissue was excited, and we found that the alignment between the LGN and V1 receptive fields was critical in order to elicit an antidromic action potential. Antidromic action potentials were never generated from more than one bipolar electrode. From a total of 124 LGN cells recorded during V1 stimulation, we successfully recorded antidromic activation in 27 cells (20%).
Factors that contributed to the low yield of antidromically activated units are outlined below. Our bipolar electrodes could only access the first ten degrees of the visual field because the V1 representation of central field is exposed on the outer surface of the brain. Peripheral representations of the visual field in V1 are found on the medial cortical surface between the two hemispheres of the brain (Fritsches & Rosa, Reference Fritsches and Rosa1996). In our initial experiments, we tried antidromic stimulation with each encountered cell in the LGN with the expectation that the electrical stimulus in V1 spread widely. However, we soon realized that this is not the case and that successful antidromic activation was only successful if the receptive fields of LGN cells and V1 bipolar electrodes were overlapping.
When we recorded from the bipolar electrodes, we observed robust LPE modulation by both achromatic and S-cone isolating stimuli (data not shown). This suggested that the stimulation electrodes spanned layer 4, the principal P and M cell recipient layers, and the superficial layers, which receive S-cone input (Chatterjee & Callaway, Reference Chatterjee and Callaway2003). We did not however attempt to anatomically reconstruct the exact depth of stimulation.
Contribution of S-cone signals to V1 cells
Extracellular recordings from macaque (Lennie et al., Reference Lennie, Krauskopf and Sclar1990; Johnson et al., Reference Johnson, Hawken and Shapley2004; Solomon & Lennie, Reference Solomon and Lennie2005; Horwitz et al., Reference Horwitz, Chichilnisky and Albright2007) and marmoset (Hashemi-Nezhad et al., Reference Hashemi-Nezhad, Blessing, Dreher and Martin2008) suggest that the weight of S-cone inputs to the majority of V1 cells account for <10% of the total cone input (but see Cottaris & De Valois, Reference Cottaris and De Valois1998). However, these studies did report rarely encountered cells with strong S-cone input. V1 cells that resemble either +S (Blue-ON) or –S (Blue-OFF) LGN cells are rare (De Valois et al., Reference De Valois, Cottaris, Elfar, Mahon and Wilson2000). V1 cells are tuned to a wider range of chromaticities, not just along the “Red-Green” or “Blue-Yellow” chromatic axes of LGN cells (Lennie et al., Reference Lennie, Krauskopf and Sclar1990; Gegenfurtner, Reference Gegenfurtner2003). This taken together with few V1 cells showing strong S/ML opponency likely indicates that the S-cone signal provided by the K-BON cells is mixed with other chromatic signals and distributed to many cells in V1 (Engel et al., Reference Engel, Zhang and Wandell1997; Mullen et al., Reference Mullen, Thompson and Hess2010).
Visual pathways that bypass the LGN have been anatomically identified (Harting et al., Reference Harting, Glendenning, Diamond and Hall1973; Kaske et al., Reference Kaske, Dick and Creutzfeldt1991). Visual pathways that bypass V1 also exist: from the LGN to extra-striate cortex area MT (Stepniewska et al., Reference Stepniewska, Qi and Kaas1999; Sincich et al., Reference Sincich, Park, Wohlgemuth and Horton2004; Warner et al., Reference Warner, Goldshmit and Bourne2010; Jayakumar et al., Reference Jayakumar, Roy, Dreher, Martin and Vidyasagar2013); LGN to cortical area V2 (Bullier & Kennedy, Reference Bullier and Kennedy1983; Kennedy & Bullier, Reference Kennedy and Bullier1985); LGN to the dorsal medial visual area or V3 (Beck & Kaas, Reference Beck and Kaas1998); and LGN to prestriate cortices V2, V3, V4, and V5 (Fries, Reference Fries1981; Yoshida & Benevento, Reference Yoshida and Benevento1981; Yukie & Iwai, Reference Yukie and Iwai1981). Little is known about the contribution of S-cone signals to these pathways, although recent data suggest that some S-cone inputs to area MT bypass V1 (Jayakumar et al., Reference Jayakumar, Roy, Dreher, Martin and Vidyasagar2013). It is likely that the major route for S-cone signals reaching visual cortex is via the retino-geniculo-cortical pathway.
Comparisons of antidromic latencies across studies
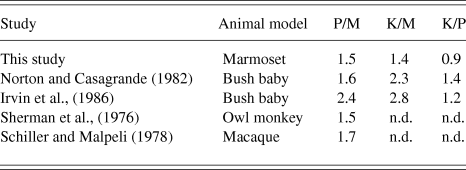
Antidromic latencies of LGN cells from this study and previous studies in other primates are summarized in Table 1. As different primate species have brains of varying sizes, the ratios of antidromic latencies between the LGN classes were calculated for comparison in Table 2. With the exception of the K cell latencies, the antidromic latencies of LGN cells in the marmoset are comparable to the results found in other primate species. The antidromic latencies of K-cells in the bush baby (Galago) are reported to be significantly longer than those of P cells and show greater variability (Norton & Casagrande, Reference Norton and Casagrande1982; Irvin et al., Reference Irvin, Norton, Sesma and Casagrande1986). The bush baby does not have functional S-cones, which means K cells studied in the bush baby are not directly comparable to K-BON cells in the marmoset. Further research is needed to determine whether or not other types K cells in the marmoset have more comparable antidromic latencies to those of K cells in the prosimian bush baby.
Antidromic latencies of LGN cells from V1 stimulation
Latencies (in ms) are shown as mean ± SD (n). n.d., not determined.
1 Values were calculated from Fig. 3 of Schiller and Malpeli (Reference Schiller and Malpeli1978).
Ratios of antidromic latencies of LGN cells
Ratios are calculated from mean latencies in Table 1. n.d., not determined.
Cells in the M pathway are consistently fastest across all studies. The M pathway of the LGN is the fastest signaling pathway with the shortest conduction latencies (Sherman et al., Reference Sherman, Wilson, Kaas and Webb1976; Norton & Casagrande, Reference Norton and Casagrande1982; Irvin et al., Reference Irvin, Norton, Sesma and Casagrande1986; Maunsell et al., Reference Maunsell, Ghose, Assad, McAdams, Boudreau and Noerager1999). This is consistent with M cells having the largest diameter axons (Gasser & Erlanger, Reference Gasser and Erlanger1927; Feig & Harting, Reference Feig and Harting1994).
As conduction velocity is proportional to axon diameter (Gasser & Erlanger, Reference Gasser and Erlanger1927) as well as soma size (Sakai & Woody, Reference Sakai and Woody1988), our antidromic latency data suggest that axon diameters and soma sizes of K-BON cells in the LGN may be similar (not smaller) than those of P cells. In the retina, soma size and axon diameter (and therefore latency) of ganglion cells increases as a function of eccentricity (Boycott & Wassle, Reference Boycott and Wassle1974). The same property may apply to the LGN. Because 23 out of 27 antidromically activated cells were within 7° eccentricity and there were no significant differences between eccentricities of each group, we can rule out any substantial influence of eccentricity on antidromic latency in this study. The distribution soma sizes of K cells in the marmoset LGN has been shown to overlap with that of P cells (Solomon, Reference Solomon2002). Antidromic latency of Blue-ON cells in the macaque retina from optic chiasm stimulation was also found to be faster than other colour-opponent cells, indicating that Blue-ON cells in the retina have relatively large axons (Malpeli & Schiller, Reference Malpeli and Schiller1978). The K-BON cells may be anatomically distinct from other K cell types, which as their name implies, generally have smaller somata relative to those of M and P cells.
Contribution of LGN antidromic latency to latency differences in the visual pathway
The visual latency of cells in the visual pathway decreases with increasing stimulus luminance and higher background luminance (Adrian & Matthews, Reference Adrian and Matthews1927; Arden & Weale, Reference Arden and Weale1954; Levick & Zacks, Reference Levick and Zacks1970; Lennie, Reference Lennie1981; Maunsell et al., Reference Maunsell, Ghose, Assad, McAdams, Boudreau and Noerager1999). As antidromic latency does not depend on stimulus parameters, the relative contribution of the antidromic latency to the visual latency of signals arriving at the visual cortex will depend on stimulus luminosity. Our measurements were made with high (70%) contrast, uniform field flashed stimuli that produced relatively short visual latencies. We held the background illuminance close to 45 cd m−2 and background chromaticity close to CIE coordinates: x = 0.361, y = 0.363. Under these conditions, the adaptation state (quantal absorbance rate) of S-cones is ∼ 10% that of the M- and L-cones. Thus, the longer visual latency of Blue-ON cells may be partly attributable to different cone adaptation states (Schnapf et al., Reference Schnapf, Nunn, Meister and Baylor1990; Stockman et al., Reference Stockman, Langendorfer, Smithson and Sharpe2006). We calculated that the antidromic latencies of LGN cells contribute on average 6.8% to the visual latency of signals arriving at V1 using high-contrast stimuli in the light-adapted retina. Using dimmer stimuli or stimulating the dark-adapted retina would presumably result in decreased contribution of antidromic latency, as visual latency would increase.
Recordings of visual-evoked potentials (Rabin et al., Reference Rabin, Switkes, Crognale, Schneck and Adams1994) and extracellular potentials from V1 cells (Cottaris & De Valois, Reference Cottaris and De Valois1998) show that S-cone cone signals are detected later than L- and M-cone signals by approximately 20–30 ms. The delay of S-cone signals has also been observed in psychophysical studies (McKeefry et al., Reference McKeefry, Parry and Murray2003; Smithson & Mollon, Reference Smithson and Mollon2004; Lee et al., Reference Lee, Mollon, Zaidi and Smithson2009). From our recordings, the conduction latencies of K-BON cells from the LGN to V1 contribute little to this delay in S-cone signals reaching V1.
Acknowledgments
We are most grateful to Paul R. Martin and Samuel G. Solomon for their guidance, support, and comments on manuscript drafts. We also thank Bogdan Dreher for advice on the experimental methods; Spencer C. Chen, Arzu Demir, Phillip A. Romo, Selina S. Solomon, and Natalie Zeater for assistance with experiments; and William J. Dobbie for computer programming. This work was supported by the National Health and Medical Research Council grant #1027913 and the Australian Research Council Centre of Excellence in Vision Science #CE0561903.