



Non-technical Summary
Macroalgae (‘seaweeds’) are a critically important group of life on Earth today and have been for the past one billion years. In this paper, an overview is provided of recent advances in our understanding of early macroalgae in the fossil record, and areas within this field of study that show promise for future work are highlighted. In addition, best practices are examined for investigating problematic fossil material that might represent the remains of macroalgae.
Introduction
Marine members of the Chlorophyta (green algae), Rhodophyta (red algae), and Phaeophyceae (brown algae) with thalli that exceed a few millimeters in size are known collectively and in a non-phylogenetic sense as macroalgae or seaweeds. From an ecological standpoint, they comprise a critically important component of the modern biosphere. Of particular note, they generate net primary production on par with the Amazon rainforest and double that of seagrasses (Duarte et al., Reference Duarte, Losada, Hendriks, Mazarrasa and Marbà2013, Reference Duarte, Gattuso, Hancke, Gundersen and Filbee-Dexter2022; Raven, Reference Raven2017), provide essential habitat for marine animals, produce appreciable amounts of atmospheric oxygen and, albeit modestly and mainly for select groups of green macroalgae, contribute to dimethylsulfoniopropionate (DMSP) production, which affects cloud formation and, by extension, climate (Van Alstyne and Puglisi, Reference Van Alstyne and Puglisi2007). In addition, it appears that macroalgae contribute significantly to carbon capture and storage by coastal marine and ocean ecosystems (i.e., blue carbon), with some estimates indicating that the amount of macroalgal carbon exported to, and potentially sequestered in, deep-sea settings is comparable to the carbon sequestered by all other blue carbon settings combined (Krause-Jensen and Duarte, Reference Krause-Jensen and Duarte2016; Krause-Jensen et al., Reference Krause-Jensen, Lavery, Serrano, Marbà, Masque and Duarte2018; Raven, Reference Raven2018; Gould et al., Reference Gould, Bell and Stubbins2025).
Many of the ecosystem-engineering effects of macroalgae were potentially substantially greater during, and leading up to, the early Paleozoic, owing to the common presence of vast expanses of suitable shallow marine habitat in the form of epeiric seas and the lack of other marine macrophytes, such as sea grasses (LoDuca et al., Reference LoDuca, Bykova, Wu, Xiao and Zhao2017). When the ecological importance of macroalgae, most of which are benthic, is coupled with the fact that both molecular clock estimates and fossil evidence indicate that they were present at least as far back as 1 Ga (Tang et al., Reference Tang, Pang, Yuan and Xiao2020; D. Li et al., Reference Li, Luo, Tang, She and Xiao2023), it becomes clear that to fully understand the early biosphere, including key animal radiations during the Ediacaran, Cambrian, and Ordovician, it is essential to document the Proterozoic and lower Paleozoic macroalgal fossil record in as much detail as possible.
For the past 30 years, the output of papers focusing on early macroalgae has been strong and fairly steady, which stands in stark contrast to output during the preceding two decades (Fig. 1). Much of this uptick reflects the description of newly discovered macroalga-bearing Lagerstätten, particularly in China but in other places as well. In this paper, advances in this field of study during this ongoing ‘golden age’ are reviewed in the areas of identification methods, modes of preservation, depositional/stratigraphic context, and broad-scale ecological and evolutionary history, and topics within each area that show particular promise for future work are highlighted. Ever-present pitfalls are also illuminated, together with suggested pathways around them. Undoubtedly, this is a small and specialized area of paleontological research, but the need for further study is great because much fundamental work remains to be done and because advances, as noted above, can potentially increase understanding of many broad-scale and interrelated aspects of the early Earth system.
Number of publications per year from 1976 to 2025 pertaining to Ediacaran and Cambrian macroalgae, respectively, as extracted from GeoRef using the query “macroalga or seaweed” together with period name: (1) Ediacaran, (2) Cambrian.

Figure 1. Long description
The figure consists of two vertically stacked bar charts with identical X-axes representing years from 1976 to 2025.
Top Panel 1 Ediacaran: The Y-axis ranges from 0 to 9. From 1976 to 1987, there are zero publications. The first entry appears in 1988 with 1 publication. Sporadic activity of 1 publication occurs in 1992, 1995, and 1998. A small cluster appears in 1999 and 2000 with 2 publications each. A sustained increase begins in 2005 with 4 publications. The data fluctuates between 1 and 4 until a major peak in 2017 reaching 8 publications. The final years 2020 to 2025 show consistent activity between 4 and 7 publications.
Bottom Panel 2 Cambrian: The Y-axis ranges from 0 to 6. There are zero publications from 1976 until 1995, which shows 2 publications. Activity remains zero or very low until 2000 with 3 publications. After a period of low activity, a steady rise begins in 2011. Publications peak at 4 between 2016 and 2018. Following a dip in 2019 and 2021, the count rises again to 4 in 2023 and 2024, reaching a maximum of 5 in 2025.
Materials utilized in this study
All specimens discussed and figured herein are housed within museum collections and have received formal taxonomic treatments. Details pertaining to collections, including institutional abbreviations, are provided below and literature citations pertaining to the latter are provided throughout the text.
Repositories and institutional abbreviations
Specimens figured in this study are deposited in the following institutions: Smithsonian Institution National Museum of Natural History (USNM), Washington, D.C., USA; Invertebrate Paleontology, Museum of Comparative Zoology (MCZ.IP), Harvard University, Cambridge, MA, USA; Field Museum of Natural History (FMNH), Chicago, Illinois, USA; Faculté des Sciences et Techniques of the Cadi Ayyad University of Marrakesh (AA), Morocco; Natural History Museum of the University of Tartu (TUG), Estonia; Royal Ontario Museum (ROM, ROMIP), Toronto, Canada; Virginia Polytechnic Institute Geoscience Museum (VPIGM), Blacksburg, USA; University of Michigan Paleontology Collection (UMMP), Ann Arbor, USA; University of Kansas, Biodiversity Institute, Division of Invertebrate Paleontology collections (KUMIP), Lawrence, USA; University of Wisconsin Geology Museum (UWGM), Madison, USA.
Identification of noncalcified macroalgae in the Proterozoic and lower Paleozoic fossil record
Since the inception of paleontology as a science, the identification of macroalgae in the fossil record has proven to be a challenging task. Indeed, nearly everything that was formally described as a fossil seaweed (fucoid) prior to 1900 turned out to be something else, with most of this material emerging as trace fossils made by an array of burrowing animals. These early missteps endure in a plethora of ichnogenus names with the suffix -phycus (e.g., Arthrophycus, Palaeophycus, Rusophycus) or otherwise conveying a seaweed affinity (e.g., Fucoides, Chondrites, Thalassinoides, Phycodes). Regrettably, the Silurian “empreintes de fucus” observed enroute to the center of the Earth (Verne, Reference Verne1864, p. 99) were nothing of the sort. To further complicate matters, body fossils of various animal groups and of terrestrial plants can also resemble seaweeds, at least outwardly. Thus, confidently identifying material from the fossil record as the remains of macroalgae often requires, as much as anything else, eliminating a wide range of other possibilities.
A critical review by Babcock (Reference Babcock, Hoffman and Nitecki1986) highlighted the issue of the “algal wastebasket” and presented a flowchart for the recognition of fossil macroalgae. That report, including the case studies presented therein, however, focused on calcareous macroalgae, unequivocal examples of which are not known from strata older than Ordovician, whereas the present report is exclusively concerned with the fossil record of early noncalcified (‘fleshy’) macroalgae. In recent years, various approaches used to guide the identification of fossil noncalcified macroalgae have been mentioned in broad-scale treatments of early macroalgal ecological and evolutionary history (e.g., Xiao and Dong, Reference Xiao, Dong, Xiao and Kaufman2006; LoDuca et al., Reference LoDuca, Bykova, Wu, Xiao and Zhao2017; Bykova et al., Reference Bykova, LoDuca, Ye, Marusin, Grazhdankin and Xiao2020) and in reports describing macroalgal taxa (e.g., LoDuca, Reference LoDuca1990, Reference LoDuca1997, Reference LoDuca2024; Xiao et al., Reference Xiao, Yuan, Steiner and Knoll2002; F. Tang et al., Reference Tang, Yin, Liu, Duan and Gao2008; Q. Tang et al., Reference Tang, Pang, Yuan and Xiao2020; LoDuca et al., Reference LoDuca, Swinehart, LeRoy, Tetreault and Steckenfinger2021, Reference LoDuca, Meacher, Pepper, Brett and Isotalo2023) or animal taxa with alga-like morphologies (e.g., Maletz et al., Reference Maletz, Steiner and Fatka2005; LoDuca et al., Reference LoDuca, Caron, Schiffbauer, Xiao and Kramer2015a). In this section, these approaches are curated and reviewed in the areas of fine-scale morphology, chemical composition, and comparisons with living macroalgae, the last including thallus architecture, reproductive structures, cellular-level details, and ontogeny.
Fine-scale morphology
Seaweed-like gross morphologies are displayed by members of a wide variety of animal and plant groups. These include sponges, specifically demosponges with dense spicule and spongin cores, such as the living genera Raspailia, Axinella, and Haliclona and the Cambrian Hazelia, as well as Cambrian ascosponges, such as Leptomitus (Fig. 2.1, 2.2); hemichordates, particularly early benthic pterobranchs (e.g., Sphenoecium), some of which, such as Tarnagraptus, can even show monopodial growth habits (Maletz and Lerosey‐Aubril, Reference Maletz and Lerosey‐Aubril2025) (Fig. 2.3–2.7); cnidarians, most notably hydroids, including ‘bottle-brush’ forms (e.g., Thuiaria), but also some octocorals; and a wide variety of terrestrial plant groups, including liverworts, mosses, and early tracheophytes (e.g., rhyniophytes, sphenophytes). In addition, parts of various animals isolated through selective preservation or pre-burial fragmentation can present alga-like forms. These include, but are not limited to, the spines and appendages of some lobopods and arthropods (e.g., Acinocricus, Tamisiocaris) and the organic tubes of various early tubicolous animals (e.g., Sabellidites, Conotubus).
Examples of macroalgal mimics in the fossil record. (1) Ascosponge Leptomitus zitteli Walcott, Reference Walcott1886, complete specimen, Cambrian (Dyeran Series 2, Stage 4) Parker Formation, Franklin County, Vermont, lectotype, USNM 15308, (2) enlargement of area at arrow in (1) showing elongate spicules; (3) colony of the benthic pterobranch Tarnagraptus cupidus Lerosey-Aubril et al., Reference Lerosey‐Aubril, Maletz, Coleman, Del Mouro, Gaines, Skabelund and Ortega‐Hernández2024, Cambrian (Drumian) Marjum Formation, House Range, Utah, holotype, MCZ.IP.199849, (4) enlargement of area at left arrow in (3) showing stem with fuselli, (5) enlargement of area at right arrow in (3) showing conical thecae with terminal apertures; (6) complete specimen of the benthic pterobranch Sphenoecium wheelerensis Maletz and Steiner, Reference Maletz and Steiner2015, Cambrian (Drumian) Wheeler Shale, Drum Mountains, Utah, FMNH PE 61081, (7) BSE-SEM image of area at arrow in (6) showing fuselli; (8) colonial metazoan Webbyites felix Muir and Gutiérrez-Marco, Reference Muir and Gutiérrez-Marco2023, Lower Ordovician Fezouata Formation, Morocco, holotype, AA.TER.OI.32a, (9) enlargement of area at arrow in (6) showing thecae. Images in (1, 2) from Pari et al. (Reference Pari, Briggs and Gaines2022), (3–5) courtesy of Rudy Lerosey-Aubril, (8, 9) courtesy of Lucy Muir. Scale bars are (1, 3, 8) 10 mm, (2, 6) 1 mm, (4, 7) 0.2 mm, (5) 2 mm, (9) 0.5 mm.
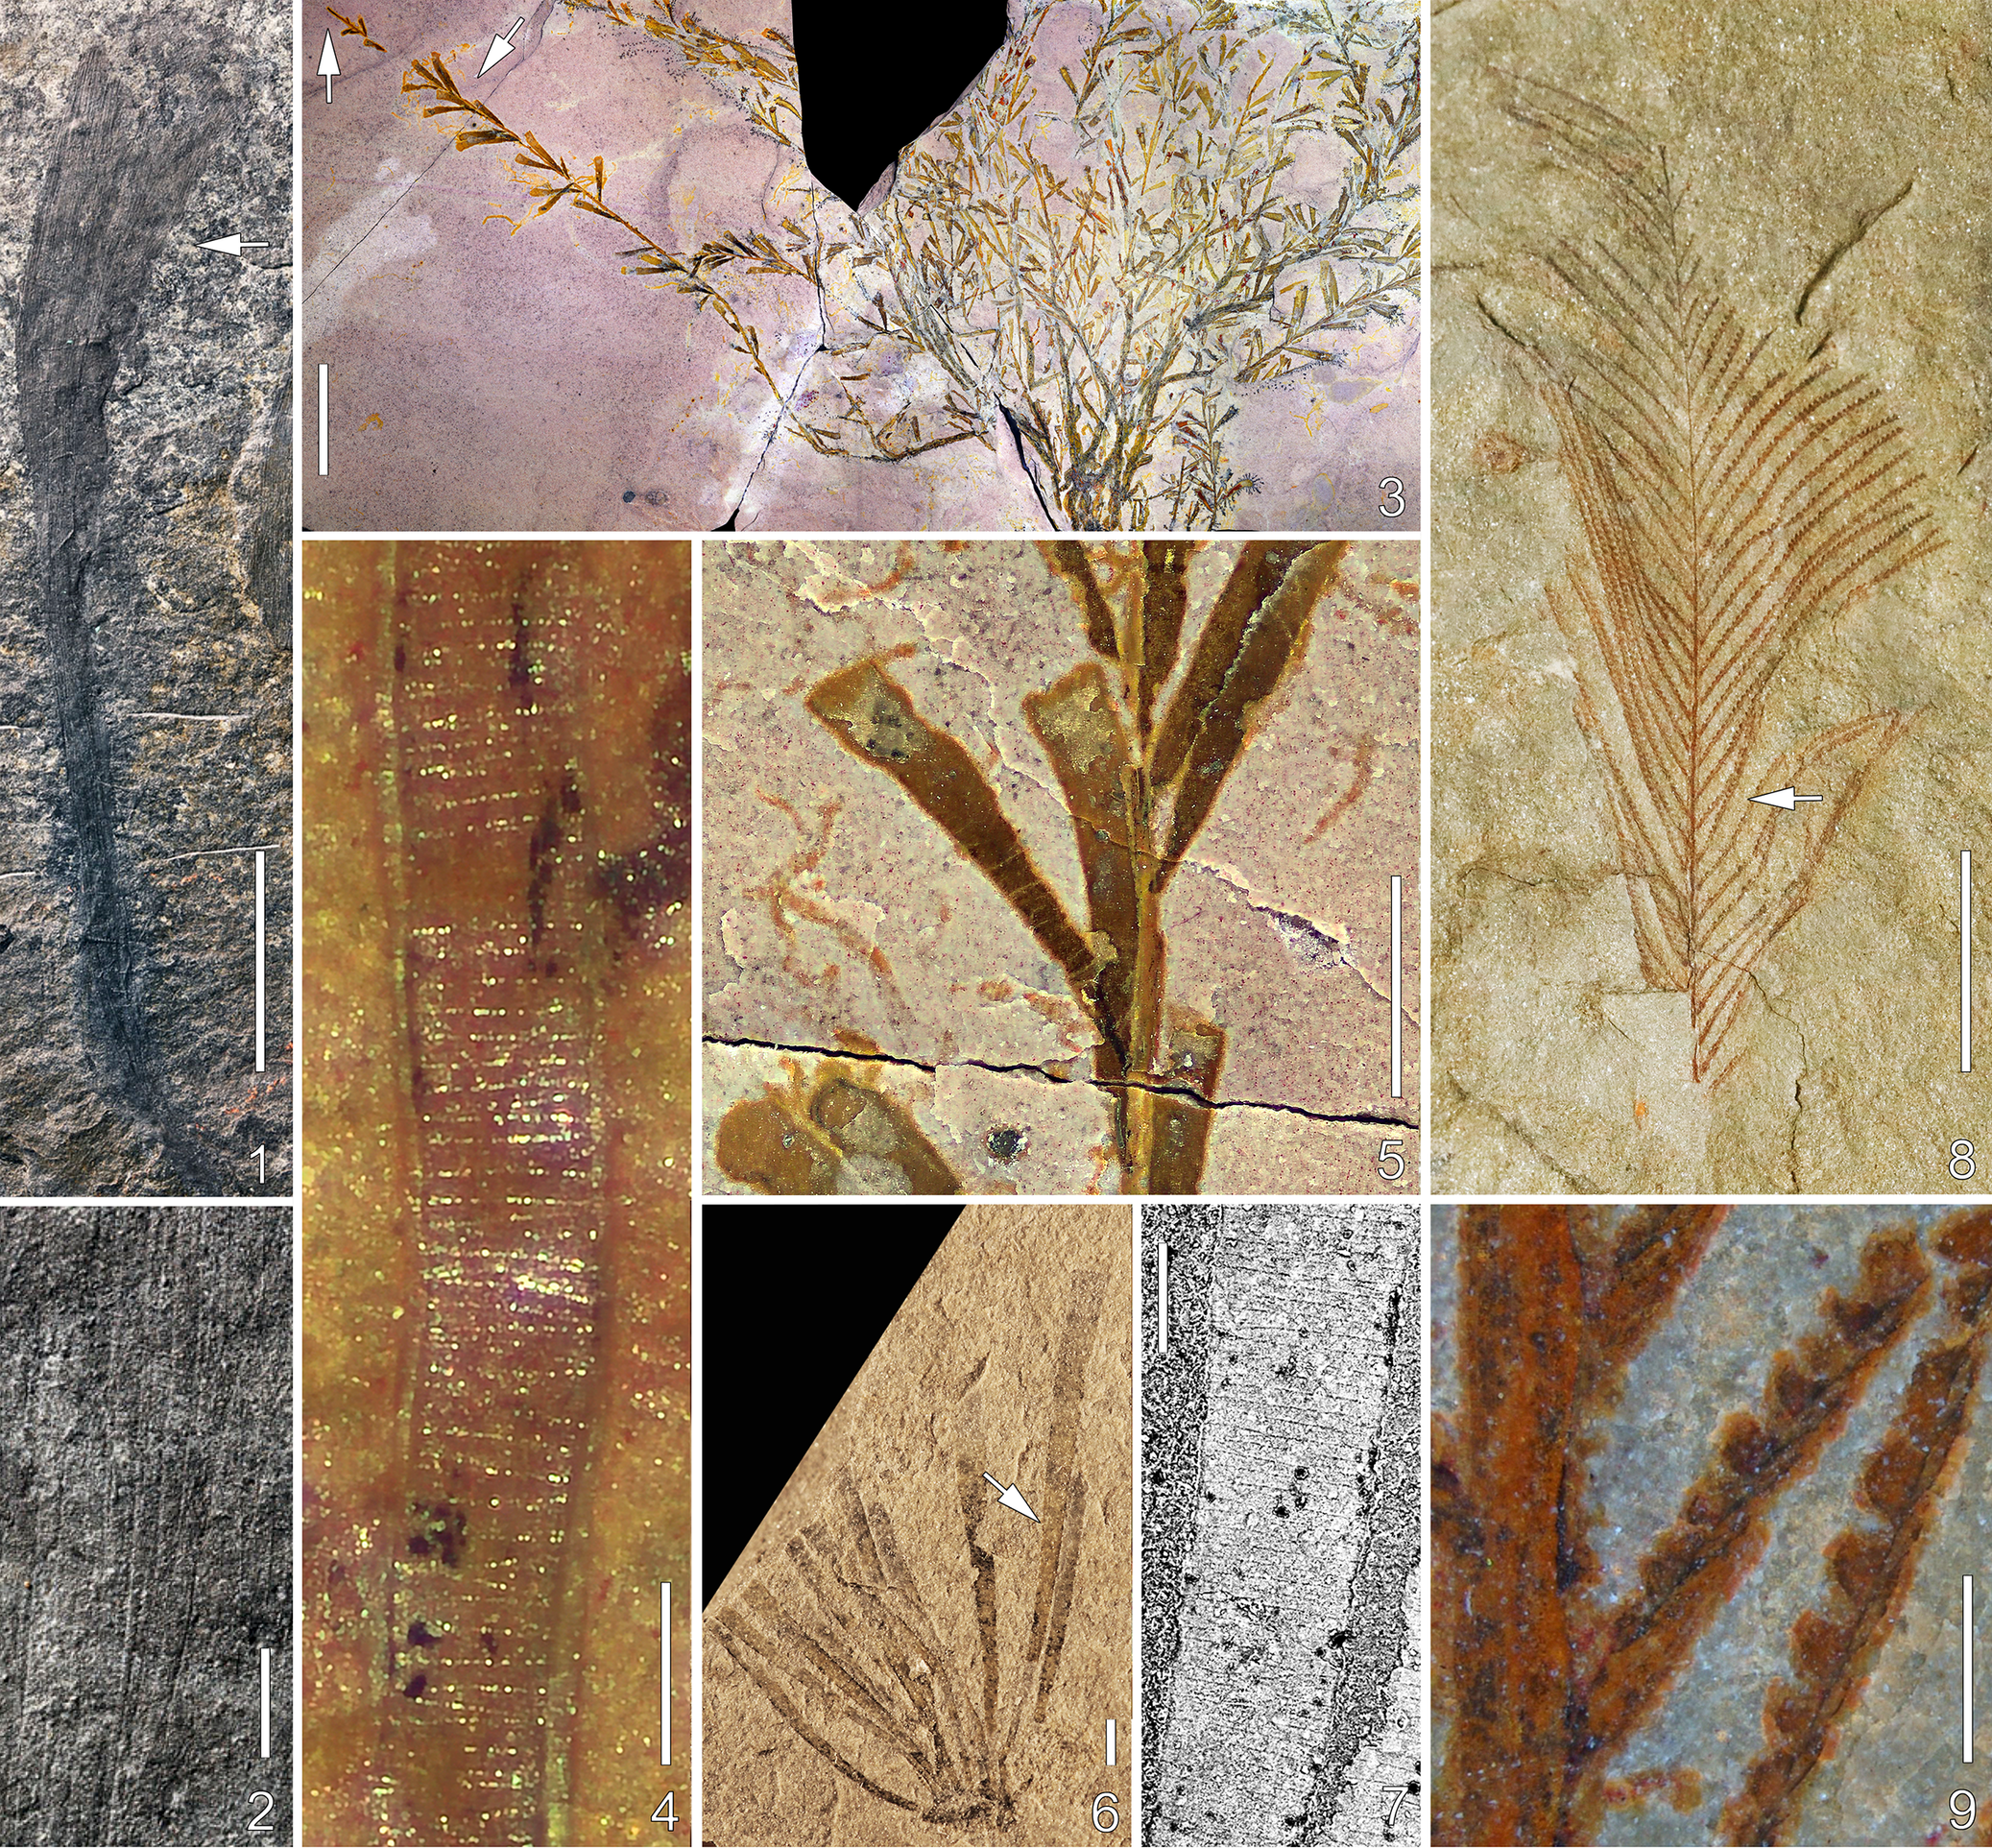
Figure 2. Long description
Panel 1 shows a long, dark, slender specimen of Leptomitus zitteli on a grey rock surface with a 10 mm scale bar. Panel 2 is a high-magnification view of the area marked by an arrow in panel 1, revealing fine, parallel elongate spicules with a 1 mm scale bar. Panel 3 displays a branching colony of Tarnagraptus cupidus on a purple-tinted rock with two arrows pointing to different structures. Panel 4 is a close-up of the left arrow in panel 3, showing a stem with horizontal fuselli bands and a 0.2 mm scale bar. Panel 5 is a close-up of the right arrow in panel 3, showing conical thecae with terminal apertures and a 2 mm scale bar. Panel 6 shows a fan-like specimen of Sphenoecium wheelerensis with a 1 mm scale bar. Panel 7 is a B S E S E M image of the arrowed region in panel 6, showing detailed fuselli texture with a 0.2 mm scale bar. Panel 8 features a feathery, reddish-brown colonial metazoan, Webbyites felix, with a 10 mm scale bar. Panel 9 is an enlargement of the arrowed area in panel 8, showing serrated thecae structures with a 0.5 mm scale bar.
Most of the aforementioned animal groups did not originate until after the Ediacaran, and many of the tracheophyte groups did not originate until after the Silurian, therefore specimen age can in some cases serve to eliminate interpretations that might otherwise be possible. Apart from this, however, it is clear that distinguishing macroalgae from macroalgal mimics in the fossil record must involve factors other than gross morphology. Fortunately, aspects of fine-scale morphology are instructive in many cases. Following on from a key report by Maletz et al. (Reference Maletz, Steiner and Fatka2005), scanning electron microscope imaging of uncoated specimens in backscattered electron mode (BSE-SEM), which can show fine-scale details that are not otherwise evident, has become an important tool for investigating material preserved as carbonaceous compressions. Photography of such specimens immersed in alcohol or water and in cross-polarized light can also highlight important details (Muir et al., Reference Muir, McCobb and Zhang2021) and, for some material, microCT scanning and synchrotron-based scanning transmission X-ray microscopy can be effective, such as for determining the presence and morphology of tracheids (e.g., Strullu-Derrien et al., Reference Strullu‐Derrien, Bernard, Spencer, Remusat, Kenrick and Derrien2019). Below, fine-scale morphological features are listed and described that are not known in macroalgae and that, therefore, would serve to eliminate an algal affinity when present.
Thecae
Present in many hemichordates and hydroids either as conspicuous trumpet- to triangular-shaped projections or as much less obvious openings (apertures) along the flanks or ends of branches (Fig. 2.3, 2.5–2.9). In fossil specimens, these features might be difficult to observe because of the effects of compaction, or they might be missing because of a lack of preservation.
Fuselli
Present in pterobranch periderm as a distinctive ‘banded’ pattern, with each band consisting of a ring or half-rings joined by diagonal sutures and having a height typically between 0.01 and 0.03 mm (Fig. 2.4, 2.7). This structure, which reflects the way in which the tubarium is constructed, can be difficult to observe without BSE-SEM imaging. Using this method, fuselli were identified in the holotype of Yuknessia simplex Walcott, Reference Walcott1919, a taxon originally described from the Burgess Shale by Walcott (Reference Walcott1919) as an alga, as well as in some material that had been assigned to this taxon from the Cambrian of Utah (Maletz et al., Reference Maletz, Steiner and Fatka2005; LoDuca et al., Reference LoDuca, Caron, Schiffbauer, Xiao and Kramer2015a; Maletz and Steiner, Reference Maletz and Steiner2015). Crucially, fuselli can be obscured by overlying cortical material (Maletz et al., Reference Maletz, Steiner and Fatka2005, Reference Maletz, Bates, Beli, Brussa, Cameron and Cooper2023) and, therefore, are not always evident in pterobranch specimens, including in BSE-SEM images. A pattern similar to that presented by fuselli is known for scyphozoans (Maletz and Gutiérrez-Marco, Reference Maletz and Gutiérrez-Marco2024).
Stolon
In pterobranchs, the stolon system serves to connect the individual zooids, and, in fossil specimens, the sclerotized outer covering appears as a dark thread running through the interior of the tubarium (Maletz et al., Reference Maletz, Bates, Beli, Brussa, Cameron and Cooper2023). In some specimens, however, this feature might not be evident because of a lack of preservation, or it might be thoroughly concealed by the surrounding tubarium. A possible stolon was figured for some Burgess Shale specimens of Dalyia by Maletz and Steiner (Reference Maletz and Steiner2015, fig. 16), a taxon originally described as a macroalga (Walcott, Reference Walcott1919). Remnants of a stolon system also appear to be present in the alga-like pterobranch Yunotubus from the Cambrian Xiaoshiba Lagerstätte of South China, for which a hemichordate affinity is indicated by well-preserved fuselli (Yang et al., Reference Yang, Guo, Vannier, Ou and Aria2025).
Spicules
In fossil sponges that have an alga-like gross morphology, these structures are monaxial, composed of silica and/or calcite but can have a dense organic outer layer (Botting et al., Reference Botting, Muir, Xiao, Li and Lin2012, Reference Botting, Muir and Lin2013), and are straight to slightly sinuous but generally cannot be contorted. In demosponges, such spicules are usually very small (less than 1 mm long). In ascosponges, such as leptomitids, the spicules can be much larger (exceeding 10 cm) (Fig. 2.1, 2.2) but are often preserved dissolved or highly altered and with minimal evidence for original composition (Rigby, Reference Rigby1986; Botting et al., Reference Botting, Muir, Xiao, Li and Lin2012; Botting and Peel, Reference Botting and Peel2016; Pari et al., Reference Pari, Briggs and Gaines2022).
Tracheids
A diagnostic feature of tracheophytes, tracheids and tracheid-like structures have been identified in carbonaceous compressions as old as late Silurian (Lang, Reference Lang1937; Edwards and Davies, Reference Edwards and Davies1976; Edwards et al., Reference Edwards, Davies and Axe1992; Edwards, Reference Edwards2003; Libertín et al., Reference Libertín, Kvaček, Bek and McLoughlin2023). In fossil specimens, however, this structure might not be evident because of a lack of preservation, or it might be obscured by the effects of compaction. In many cases, determining the presence of such structure requires the use of SEM, microCT scanning, or synchrotron-based scanning transmission X-ray microscopy.
A general limitation of fine-scale morphology in this context is that, in part because of preservational nuances, an absence of evidence is not evidence of absence. Thus, a lack of all items listed above in a particular body fossil will not, on its own, serve to definitively establish a macroalgal affinity and, as noted by Babcock (Reference Babcock, Hoffman and Nitecki1986), it is important to avoid using algae as a taxonomic wastebasket. In addition, burrows do not possess any of the above features and can mimic many macroalgal growth habits, including monopodial (e.g., Oldhamia), dichotomously branching (e.g., Chondrites), and tubular (e.g., Planolites). Indeed, in Paleozoic strata, brown to black dichotomously branching forms without fine-scale features are far more likely to be burrows with an organic lining or dark-colored infill than macroalgae. For such material, particular aspects of sedimentology and morphology can be instructive. For example, burrows tend to maintain a uniform width, commonly show cross-cutting relationships, and lack alignment and abrupt kinks and folds (Becker-Kerber et al., Reference Becker-Kerber, Archilha, Knoll, Stipp Basei, Warren, Mouro, Kerber, Ahmed and Ortega-Hernández2026; Gougeon et al., Reference Gougeon, Vaucher, Vidal, Birolini, Dupichaud, Lefebvre and Saleh2026). Preservational details can be important in this context as well, as is discussed in detail in the section devoted to this topic.
Chemical composition of carbonaceous compressions
Endogenous biochemical information is potentially present in macroalgae preserved as carbonaceous compressions. Below, this will be examined in terms of stable carbon isotope ratios and biomolecular composition.
Stable carbon isotope ratios
To date, δ13Corg values for individual macroalgal taxa have been reported for material from the Ediacaran (Xiao et al., Reference Xiao, Bykova, Kovalick and Gill2017) and Silurian (LoDuca and Pratt, Reference LoDuca and Pratt2002; LoDuca et al., Reference LoDuca, Swinehart, LeRoy, Tetreault and Steckenfinger2021). The Silurian taxa consistently yielded values 1–2‰ lower than those of directly associated animal taxa, and a difference of this nature is typical between primary producers and consumers (Ostrom and Fry, Reference Ostrom, Fry, Engel and Macko1994). The values yielded by the Ediacaran taxa were not evaluated in this way, but the macroalgal values in all of these studies differed from those yielded by the total organic carbon (TOC) of the host rock by about 1‰ or more. More work is needed to assess this approach as a reliable means to distinguish macroalgae from other groups preserved as carbonaceous compressions within the same unit (preferably using specimens from the same location and even along the same bedding plane; see LoDuca and Pratt, Reference LoDuca and Pratt2002). Caution is warranted because although studies of living macroalgae have shown that green macroalgal taxa from a particular location can show a narrow range of values, these can differ from those of associated red macroalgal taxa by 10‰ or more (Raven et al., Reference Raven, Johnston, Kübler, Korb and McInroy2002). Nonetheless, it appears to hold promise, especially since it is possible to obtain δ13Corg values from very small amounts of material (~1 mg).
Biomolecular composition
The remnants of sterols, altered through diagenetic processes to steranes, have been identified in carbonaceous compressions of individual taxa as old as Ediacaran, and the ratios of particular sterols, including cholesteroids (C27), ergosteroids (C28), and stigmasteroids (C29), can provide information about phylogenetic affinity in some cases (Bobrovskiy et al., Reference Bobrovskiy, Hope, Ivantsov, Nettersheim, Hallmann and Brocks2018a, Reference Bobrovskiy, Hope, Krasnova, Ivantsov and Brocks2018b, Reference Bobrovskiy, Hope, Golubkova and Brocks2020, Reference Bobrovskiy, Nagovitsyn, Hope, Luzhnaya and Brocks2022; Shawar et al., Reference Shawar, Love, Uveges, Zumberge, Cárdenas, Giner and Summons2025). For example, extreme stigmasteroid predominance is characteristic of some green algal groups (Kodner et al., Reference Kodner, Pearson, Summons and Knoll2008), and a signature of this nature has been observed in some Ediacaran macroalgal material (Bobrovskiy et al., Reference Bobrovskiy, Poulton, Hope and Brocks2024). Using a different approach involving synchrotron-based X-ray fluorescence and absorption, Sforna et al. (Reference Sforna, Loron, Demoulin, Francois and Cornet2022) reported bound nickel-geoporphyrins moieties preserved in situ within ca. 1-Ga microfossils. These were identified as chlorophyll derivatives indicative of a phototrophic affinity for Arctacellularia from the Mbuji-Mayi Supergroup (Congo Basin, the Democratic Republic of the Congo). More recently, Wong et al. (Reference Wong, Prabhu, Alexander, Cleaves and Cody2025) employed an approach that utilized the full three-dimensional output files provided by py-GC-MS analyses combined with machine learning. For samples as old as Archean, this approach showed promise for determining whether material had an abiogenic versus biogenic origin, and whether biogenic material represented the remains of photosynthetic organisms, although for the latter many Precambrian samples fell below the threshold for confident assessment. Collectively, biomolecular data obtained from carbonaceous compressions has potential as a tool for identifying early macroalgae in the fossil record. As noted by Bobrovskiy et al. (Reference Bobrovskiy, Poulton, Hope and Brocks2024), however, certain caveats apply from a taphonomic perspective and, as with stable carbon isotopic composition, a further limitation of this approach is that it is destructive.
Detailed comparisons with modern macroalgae
As emphasized by Babcock (Reference Babcock, Hoffman and Nitecki1986), identification and interpretation of macroalgae in the fossil record must incorporate careful comparisons with modern macroalgae. Unfortunately, it is not possible to compare fossil material with living algae in terms of two items that are critically important for algal systematics, chlorophyll type and genetic data, since this information is not preserved in fossil specimens. Instead, apart from possible biomolecular data (see above), such comparisons must rely on information pertaining to thallus architecture and, when present, reproductive structures, cellular-level details, and ontogenetic sequences. Phylogenies developed from living macroalgae using molecular techniques can also provide a useful guide.
Thallus architecture
Fossil macroalgae with simple thallus architectures, including tubular and ribbon-like forms, sheets, and dichotomizing axes, are permissive of green, red, or brown affinities, because these forms independently evolved within each of these groups. Indeed, establishing an algal affinity, in general, for such forms can present a challenging task but, when present, the details of holdfast morphology can serve as an important guide (Ye Wang et al., Reference Wang, Wang, Tang and Zhao2020; Xiao et al., Reference Xiao, Gehling, Evans, Hughes and Droser2020; X. Wang et al., Reference Wang, Wu, Wan, Niu, Zheng, Guan, Pang, Chen and Yuan2021). A further guide can be found in the degree of flexibility. Specifically, thin axes that show a consistently straight form indicate a stiff and rigid character that is antithetic to an algal affinity. For this reason, the phylogenetic affinity of the Cambrian taxon Wahpia, described as a macroalga on the basis of material from the Burgess Shale by Walcott (Reference Walcott1919), is best regarded as uncertain pending restudy of the type and related material. In similar fashion, the strikingly rectilinear side branches that characterize Devonian examples of Plumalina, including the type species, argue against an algal affinity for the genus and differ markedly from the pinnules of living Caulerpa and Ordovician and Silurian taxa described as being Caulerpa-like, such as Buthograptus and Earltonella (Muscente and Allmon, Reference Muscente and Allmon2013; LoDuca, Reference LoDuca2019; Maletz et al., Reference Maletz, Zhu, Zhang and Gutiérrez-Marco2025). Flexuous unbranched tubular and ribbon-like forms that lack a holdfast can be particularly problematic and are addressed separately in the final section of this paper.
Extant macroalgae with particularly distinctive complex thallus architectures
Among extant macroalgae with complex thallus architectures, those listed below are particularly distinctive.
Members of the green algal order Dasycladales: All 10 extant genera are characterized by thalli consisting of an upright stalk (main axis) surrounded by branched laterals arranged in discrete circlets (verticils) (Berger and Kaever, Reference Berger and Kaever1992). For these genera, this thallus architecture in combination with the particulars of lateral morphology (e.g., segment shape, branching pattern) and ontogeny (see below) is quite distinct from living red or brown algal genera, and from genera belonging to other orders of green algae. On this basis, together with data pertaining to fine-scale morphology, including a lack of interior cross-walls (see below), mode of preservation, and depositional context, the Paleozoic taxa Archaeobatophora (Fig. 3.1), Palaeocymopolia (Fig. 3.2, 3.3), and Jimaodanus (formerly Heterocladus) (Fig. 3.4, 3.5) were interpreted as early dasycladalean algae with thalli closely matching, respectively, those of the living dasycladalean genera Batophora, Cymopolia, and Acetabularia (Nitecki, Reference Nitecki1976; LoDuca et al., Reference LoDuca, Kluessendorf and Mikulic2003, Reference LoDuca, Melchin and Verbruggen2011; Mastik and Tinn, Reference Mastik and Tinn2015; LoDuca, Reference LoDuca2025).
Fossil macroalgae with complex thallus architectures. (1) Thalli of the dasycladalean alga Archaeobatophora typa Nitecki, Reference Nitecki1976, Ordovician (Katian) Big Hill Formation, Delta County, Michigan, holotype, FMNH PP 18122; (2) complete thallus of the dasycladalean alga Palaeocymopolia silurica Mastik and Tinn, Reference Mastik and Tinn2015, Silurian (Llandoverian), Estonia, holotype, TUG 1269-9, (3) detail of Palaeocymopolia silurica showing cylindrical main axis (arrows) and segmented form, Silurian (Llandoverian), Estonia, TUG 1269-18; (4) complete thallus of the dasycladalean alga Jimaodanus waukeshaensis (LoDuca, Kluessendorf, and Mikulic, Reference LoDuca, Kluessendorf and Mikulic2003), Silurian (Llandoverian) Brandon Bridge Formation, Waukesha, Wisconsin, holotype, FMNH PP 45959b, (5) enlargement of upper part of thallus in (4) showing club-shaped laterals with a possible reproductive role. Images in (2, 3) courtesy of Oive Tinn. Scale bars are (1, 2, 4) 10 mm, (3) 1 mm, (5) 5 mm.

Figure 3. Long description
A multi-panel collection of five photos showing fossilized algae.
Panel 1, at the left, shows several thalli of Archaeobatophora typa. These appear as dark, feathery, elongated structures on a light tan rock surface. The thalli have a central axis with dense, fine lateral filaments. A 10 mm scale bar is in the bottom left.
Panel 2, at the top right, displays a complete thallus of Palaeocymopolia silurica. It consists of a network of dark, segmented, bead-like structures branching across a light-colored matrix. A 10 mm scale bar is at the bottom left.
Panel 3, below panel 2, provides a close-up of Palaeocymopolia silurica. Three white arrows point to specific features: two arrows at the top point to branching segments, and one arrow in the center points to the cylindrical main axis within a bulbous segment. A 1 mm scale bar is at the top left.
Panel 4, at the bottom center, shows the complete thallus of Jimaodanus waukeshaensis. It features a long, thin central vertical axis with fine, hair-like laterals extending outward. The top of the axis terminates in a darker, denser, brush-like structure. A 10 mm scale bar is at the bottom left.
Panel 5, at the bottom right, is an enlargement of the upper portion of the thallus from panel 4. It highlights the dense, club-shaped lateral structures at the apex, which have a darker, more robust appearance than the lower filaments. A 5 mm scale bar is at the top left.
Stalked-blade members of the green algal order Bryopsidales: The thalli of these taxa consist of an upright stalk with a distinctive apical blade composed of a network of thin elongate branches, which in many cases are linked by localized cohesion or by specialized protuberances. Nothing quite like this is known among red or brown macroalgae. On this basis, together with data pertaining to aspects of fine-scale morphology, including a lack of interior cross-walls, mode of preservation, and depositional context, the Silurian taxon Voronocladus was interpreted as an early bryopsidalean alga with a stalked-blade thallus architecture broadly comparable to that of the living genus Rhipiliella (LoDuca, Reference LoDuca2024).
Members of the bryopsidalean genera Codium and Caulerpa: Species belonging to these genera produce thalli that, in the details, are distinct from those of all living red and brown algae, as well as from those of all other orders of green algae. Specifically, the unsegmented dichotomously branching axes of Codium comprise a complex internal array of siphons (tubes) 0.03–0.09 mm in diameter in which central bundles of longitudinally arranged medullary tubes give rise along their sides to rows of short cortical tubes, and the creeping thallus of Caulerpa consists of a cylindrical prostrate runner (stolon) that bears a series of upright fronds, each consisting of a central axis (rachis) with small side branches (pinnules). On this basis, together with data pertaining to aspects of fine-scale morphology, including a lack of interior cross-walls, mode of preservation, and depositional context, the Silurian taxa Inocladus lesquereuxi (Grote and Pitt, Reference Grote and Pitt1876) (formerly Inocaulis lesquereuxi) (Fig. 4.1–4.4) and Earltonella (Fig. 4.5–4.7) were interpreted as early bryopsidalean algae with thalli broadly resembling, respectively, Codium and Caulerpa. For I. lesquereuxi, an algal affinity, in general, is also indicated by its stable carbon isotopic composition in comparison to that of associated animals (LoDuca et al., Reference LoDuca, Swinehart, LeRoy, Tetreault and Steckenfinger2021).
Fossil macroalgae with complex thallus architectures. (1) Thallus of the Codium-like bryopsidalean alga Inocladus lesquereuxi, Silurian (Pridolian) Bertie Group, Fort Erie, Ontario, ROMIP 50692, (2) detail of an axis of Inocladus lesquereuxi showing twisted medullary tubes bearing cortical tubes, arrows mark areas shown in (3) and (4), Silurian (Pridolian) Bertie Group, Fort Erie, Ontario, ROMIP 63966, (3) BSE-SEM image of area at upper arrow in (2) showing medullary tube (m) bearing cortical tube (c), (4) BSE-SEM image of area at lower arrow in (2) showing medullary tube (m) bearing cortical tubes (c) along one side; (5) thallus of the Caulerpa-like bryopsidalean alga Earltonella fredricksii LoDuca in LoDuca et al., Reference LoDuca, Meacher, Pepper, Brett and Isotalo2023, Silurian (Llandoverian) Earlton Formation, Earlton, Ontario, holotype, ROMIP 66270.1, (6) enlargement of frond at arrow in (5) showing upcurved pinnules, (7) BSE-SEM image of frond central axis of Earltonella fredricksii showing distinctive ‘mud-cracked’ pattern, Silurian (Llandoverian) Earlton Formation, Earlton, Ontario, ROMIP 66270. Scale bars are (1) 20 mm, (2) 1 mm, (3, 4, 7) 0.1 mm, (5) 10 mm, (6) 2 mm.

Figure 4. Long description
Panel 1: A photo of a dark, branched thallus of Inocladus lesquereuxi on a light tan rock surface. The structure is cylindrical and bifurcated. Scale bar 20 mm.
Panel 2: A close-up photo of an axis showing vertical, twisted medullary tubes. Two white arrows point to specific junctions. Scale bar 1 mm.
Panel 3: A B S E S E M micrograph of the upper arrow area from panel 2. A vertical medullary tube labeled m is connected to a horizontal cortical tube labeled c. Scale bar 0.1 mm.
Panel 4: A B S E S E M micrograph of the lower arrow area from panel 2. A vertical medullary tube labeled m bears multiple cortical tubes labeled c extending to the right. Scale bar 0.1 mm.
Panel 5: A photo of the Earltonella fredricksii thallus showing a central axis with numerous radiating fronds. A white arrow points to a specific frond. Scale bar 10 mm.
Panel 6: An enlargement of the frond indicated in panel 5, showing a central axis with thin, upcurved pinnules arranged in a feather-like pattern. Scale bar 2 mm.
Panel 7: A B S E S E M micrograph of the central axis of Earltonella fredricksii showing a dark, textured surface with a mud-cracked pattern. Scale bar 0.1 mm.
Pneumatocyst-bearing members of the Phaeophyceae: The thalli of some brown algae, such as Fucus and Macrocystis, incorporate specialized gas-filled bladders, termed pneumatocysts, to provide buoyancy. Thalli with these conspicuous structures are distinct from those within any group of red or green algae. To date, pneumatocyst-bearing thalli have not been detected in the pre-Mesozoic fossil record, which is consistent with evolutionary timelines for brown algae indicated by molecular clock studies (see below).
A general guideline when comparing carbonaceous compressions with modern macroalgae is that, for the latter, it is best to include examination of pressed examples, such as those on herbarium sheets. High resolution images of these are now widely available in online databases (e.g., macroalgae.org).
Reproductive structures
Many extant macroalgae produce distinctive reproductive structures. Among these, carposporophytes, carposporangia, and cystocarps (which surround and protect the former) are unique to red algae, plurilocular sporangia are unique to brown algae, and gametophores borne along the sides or tips of siphons are unique to green algae. The lack of such structures among fossil material, however, does not necessarily preclude an algal affinity, not least because the thalli might not have been preserved at the proper time in the life cycle. In addition, for dasycladalean and bryopsidalean algae, the earliest types seem not to have produced distinct external reproductive structures (Pia, Reference Pia1920; Berger and Kaever, Reference Berger and Kaever1992; Barattolo et al., Reference Barattolo, Romano and Conrad2021; LoDuca et al., Reference LoDuca, Meacher, Pepper, Brett and Isotalo2023; LoDuca, Reference LoDuca2025), and this continues to be the case for some living members of the latter (e.g., Penicillus).
Examples of noncalcified macroalgae from Proterozoic and lower Paleozoic strata that show reproductive structures are rare. Qingjiangthallus from the Cambrian Qingjiang biota of South China and Leveilleites from the Silurian of Estonia were interpreted as red algae on the basis of circular and elliptical structures, respectively, that broadly resemble cystocarps, although they lack diagnostic internal details (Mastik and Tinn, Reference Mastik and Tinn2017; R. Li et al., Reference Li, Cui, Fu and Zhang2023). The microfossils Thallophyca and Paramecia from the Ediacaran Weng’an biota of South China also show structures interpreted as cystocarps and these include structures consistent with carposporophytes (Xiao et al., Reference Xiao, Knoll, Yuan and Pueschel2004). Among green algae, Proterocladus from the ca. 1.0-Ga Nanfen and Diaoyutai formations in North China (Fig. 5.1, 5.2) and Chaetomorphium from the Cambrian Chengjiang biota in South China show heteromorphic cells interpreted as akinetes on the basis of their comparatively large size, thickened cell walls, condensed cytoplasm, and lateral pores (Tang et al., Reference Tang, Pang, Yuan and Xiao2020; D. Li et al., Reference Li, Luo, Tang, She and Xiao2023; Li and Zhang, Reference Li and Zhang2025). Two Silurian noncalcified dasycladalean taxa have been described with possible reproductive structures, Kalania from the Llandoverian of Estonia (Tinn et al., Reference Tinn, Mastik, Ainsaar and Meidla2015) and Jimaodanus from the Llandoverian of Wisconsin (LoDuca et al., Reference LoDuca, Kluessendorf and Mikulic2003). Jimaodanus produced club-shaped laterals in the upper part of the thallus that, on the basis of their shape and markedly different morphology in comparison to underlying laterals, appear to have had a reproductive role (Fig. 3.5).
Fossil macroalgae showing siphonocladous cellular construction. (1) Complete thallus of Proterocladus antiquus Tang et al., Reference Tang, Pang, Yuan and Xiao2020, Tonian, Nanfen Formation, Liaoning Province, China, VPIGM-4762, (2) partial thallus of Proterocladus antiquus showing large cells separated by thick septa (arrows), Tonian, Nanfen Formation, Liaoning Province, China, VPIGM-4759; (3) partial thallus of the tubular macroalga Archaeochaeta guncho Maloney et al., Reference Maloney, Maverick, Schiffbauer, Xiao, La and Halverson2023, showing large cells separated by thick septa (arrows), Tonian, Dolores Creek Formation, Yukon, Canada, ROMIP 66167. Images in (1, 2) courtesy of Shuhai Xiao and Qing Tang, (3) courtesy of Katie Maloney. Scale bars are (1) 0.2 mm, (2) 0.1 mm, (3) 0.5 mm.

Figure 5. Long description
A multi-panel display of fossilized algae specimens.
Panel 1 is a wide-field photo of Proterocladus antiquus. It shows a dark brown, branched thallus against a light tan matrix. The structure originates from a single base and branches upward into multiple filamentous arms. A scale bar at the bottom left indicates 200 micrometers.
Panel 2 is a high-magnification inset at the bottom center of the first panel. It shows a section of the thallus with thick, dark horizontal lines. Two black arrows on the left side point to these thick septa that separate large, rectangular cells. A vertical scale bar on the right indicates 0.1 millimeters.
Panel 3 is a separate vertical photo on the right side of the frame showing Archaeochaeta guncho. It features a tubular structure with a series of stacked, reddish-brown rectangular cells. Four white arrowheads on the right side point to the thick septa dividing the cells. A vertical scale bar on the right indicates 0.5 millimeters.
Notably, thalli with a dichotomous branching pattern in which axes terminate in a large (> 1 mm) sporangium are not known for macroalgae described from Proterozoic or lower Paleozoic strata. Such a configuration is known, however, for Silurian vascular plants and bryophytes, such as Cooksonia and Capesporangites, respectively (Edwards et al., Reference Edwards, Banks, Ciurca and Laub2004; Uhlířová et al., Reference Uhlířová, Pšenička and Sakala2024).
Cellular-level details
Modern macroalgae show siphonous, multicellular, and siphonocladous constructions, the last being a variation of multicellular consisting of large cells that contain multiple nuclei (coenocytic). As noted by Tang et al. (Reference Tang, Pang, Yuan and Xiao2020), a filamentous siphonocladous construction is known for only a handful of extant eukaryote groups, including some fungi, xanthophytes (e.g., Vaucheria in reproductive stage), and rhodophytes, and is characteristic of cladophoralean green algae. Proterocladus, from 1050- to 950-Ma strata in Liaoning Province, North China, was interpreted by Tang et al. (Reference Tang, Pang, Yuan and Xiao2020) and D. Li et al. (Reference Li, Luo, Tang, She and Xiao2023) as a member of the cladophoralean green algae on the basis of a suite of features that it shares with living Cladophora and that, either individually or in combination, serve to exclude an affinity with the other aforementioned siphonocladous groups, thereby establishing it as the oldest macroalga that can be confidently identified as a member of the Chlorophyta. These features include cell size, cell shape, thallus branching pattern (including lateral branches positioned subjacent to a septum), constrictions at septa (consistent with intercalary cell division), septum morphology (non-perforate), production of heteromorphic reproductive cells with lateral pores (akinetes), and the development of a small holdfast with a lobate or subdiscoidal form (Fig. 5.1, 5.2).
Most of these features, but not all, were also recognized in less well preserved (more fragmentary) material from the late Tonian Svanbergfjellet Formation of Svalbard (Butterfield et al., Reference Butterfield, Knoll and Swett1994; Butterfield, Reference Butterfield2015), Khastakh Formation (ca. 820–720 Ma) of Siberia (Nagovitsin et al., Reference Nagovitsin, Rogov, Marusin, Karlova, Kolesnikov, Bykova and Grazhdankin2015), Nonesuch Formation (ca. 1078 ± 24 Ma) of Michigan (Wellman and Strother, Reference Wellman and Strother2015; Strother and Wellman, Reference Strother and Wellman2021), and Middle Ordovician Winneshiek Lagerstätte of Iowa (Nowak et al., Reference Nowak, Harvey, Liu, McKay, Zippi, Campbell and Servais2017). Uniseriate chains of large cells described as unbranched (tubular) macroalgal thalli with a siphonocladous construction include Archaeochaeta from the Tonian Dolores Creek Formation of northwestern Canada (Maloney et al., Reference Maloney, Halverson, Schiffbauer, Xiao and Gibson2021, Reference Maloney, Schiffbauer, Halverson, Xiao and Laflamme2022, Reference Maloney, Maverick, Schiffbauer, Xiao, La and Halverson2023) (Fig. 5.3) and Chaetomorphium from the Cambrian Chengjiang biota of South China (Li and Zhang, Reference Li and Zhang2025).
Macroalgae with a siphonous construction, including members of the green algal orders Dasycladales and Bryopsidales, produce a vegetative (i.e., pre-reproductive) thallus that is a single giant cell without internal partitions (cross-walls). For fossil macroalgae preserved as carbonaceous compressions, a siphonous construction is indicated when portions of a thallus transected longitudinally by the plane of split show a lack of interior cross-walls (Fig. 6.1). In addition, for thallus elements with a cylindrical form, particularly the stalks of dasycladalean algae, a siphonous (‘hollow’) construction is often indicated in carbonaceous compressions by the presence of a distinctive longitudinal crease formed during compaction (LoDuca, Reference LoDuca2025). Possible macroalgae showing a siphonous construction have been described from strata as old as Mesoproterozoic (Tang et al., Reference Tang, Pang, Li, Chen, Yuan, Sharma and Xiao2021).
Thalli of Archaeobatophora gulliverensis LoDuca, Reference LoDuca2025, showing siphonous thallus construction and ontogenetic stages, Silurian (Llandoverian) Schoolcraft Formation, Gulliver, Michigan: (1) enlargement of thallus at arrow in (2) showing stalk interior without cross-walls, (2–4) ontogenetic sequence showing progressive loss of lateral segments, UMMP 84855, 84857, 84856.002, respectively. Scale bars for all are 2 mm.

Figure 6. Long description
A series of four photos labeled 1 through 4 showing fossilized thalli on a light tan rock matrix. Each panel includes a 2 mm scale bar in the bottom left corner.
* Panel 1 is a high-magnification view of the specimen in panel 2. It focuses on the central stalk where a white arrow points to the interior. The stalk appears as a dark, continuous vertical line without internal cross-walls, with lateral branches extending outward and upward.
* Panel 2 shows a complete thallus specimen U M M P 84855. It features a central vertical axis with numerous fine, feathery lateral segments densely packed along the upper half, while the lower half shows fewer, more spaced-out branches.
* Panel 3 displays specimen U M M P 84857. This thallus shows a progressive loss of the fine lateral segments compared to panel 2. The central axis is more prominent, and the remaining lateral structures are concentrated primarily at the very top, forming a dark, tufted crown.
* Panel 4 shows specimen U M M P 84856.002. This represents the final stage in the sequence, where the lateral segments are almost entirely absent. The fossil consists mainly of the thin, branching central stalk with only faint, sparse traces of lateral appendages remaining along its length.
All macroscopic red and brown algae are multicellular. In general, preservation of cellular-level details in fossil algae with a multicellular construction other than siphonocladous is very rare, and the most convincing examples known from the pre-Devonian fossil record are microfossils that have been phosphatized or silicified (e.g., Butterfield et al., Reference Butterfield, Knoll and Swett1990; Butterfield, Reference Butterfield2000; Xiao et al., Reference Xiao, Knoll, Yuan and Pueschel2004; Zhang and Zhang, Reference Zhang and Zhang2022; Tang et al., Reference Tang, Zheng, Qin, Wang, Yang, Wang, Sun, Uesugi, Komiya and Han2022; Anderson et al., Reference Anderson, Mughal and Wedlake2024). For multicellular algae, important information that might be gleaned from fossil specimens that preserve cellular-level information includes (1) cell division patterns and (2) whether the thallus has pseudoparenchymatous versus true parenchymatous construction, with the last known only among brown algae and with bangiophycean red algae lacking substantial pseudoparenchymas. Details of this nature are central to establishing Bangiomorpha pubescens Butterfield, Reference Butterfield2000, from ca. 1-Ga strata within the Bylot Supergroup of Arctic Canada as the oldest definitive red alga (Butterfield et al., Reference Butterfield, Knoll and Swett1990; Butterfield, Reference Butterfield2000; Yang et al., Reference Yang, Boo, Bhattacharya, Saunder, Knoll, Fredericq, Graf and Yoon2016; Gibson et al., Reference Gibson, Shih, Cumming, Fischer and Crockford2018) and, together with possible reproductive structures (see above), to the interpretation of Thallophyca and Paramecia from the Ediacaran Weng’an biota in South China as stem group corallinalean red algae (Xiao et al., Reference Xiao, Knoll, Yuan and Pueschel2004).
For fossils of multicellular algae that preserve anatomical information at the cellular level, a further potential source of information resides in the details of intercellular connection. Specifically, brown algae have plasmodesmata, whereas red algae have pit connections (Terauchi et al., Reference Terauchi, Nagasato and Motomura2015), with morphological details of the latter providing important taxonomic information (Pueschel and Cole, Reference Pueschel and Cole1982). To date, plasmodesmata have not been identified in fossil algae described from either Proterozoic or lower Paleozoic strata, but pit connections may be present in some Proterozoic microfossils that have been described as red algae (Xiao et al., Reference Xiao, Knoll, Yuan and Pueschel2004; Bengtson et al., Reference Bengtson, Sallstedt, Belivanova and Whitehouse2017). A key cytological aspect that is diagnostic of Rhodophyta is the presence of pyrenoids. To date, these have been reported only once, for the microfossil Rafatazmia, described as a red alga from the Mesoproterozoic (ca. 1.6 Ga) Chitrakoot Formation of India (Bengtson et al., Reference Bengtson, Sallstedt, Belivanova and Whitehouse2017; but see Gibson et al., Reference Gibson, Shih, Cumming, Fischer and Crockford2018; Carlisle et al., Reference Carlisle, Jobbins, Pankhania, Cunningham and Donoghue2021).
Ontogeny
Living dasycladalean algae display a distinctive ontogenetic sequence that involves progressive shedding of the higher-order lateral segments (Berger and Kaever, Reference Berger and Kaever1992). Such an ontogenetic sequence has been documented for Wiartonella and Archaeobatophora from the Silurian of Ontario and Michigan, respectively (LoDuca and Tetreault, Reference LoDuca and Tetreault2017; LoDuca, Reference LoDuca2025) (Fig. 6.2–6.4).
Molecular phylogeny
Molecular phylogenies, particularly those that have been time-calibrated through the application of molecular clock methods, can aid in constraining interpretations of fossil material and should be routinely included in studies of fossil macroalgae. For example, this approach indicates that brown algae did not originate until the Ordovician, that the earliest forms had simple, filamentous morphologies, and that the familiar kelps and wracks did not originate until the Mesozoic (Choi et al., Reference Choi, Graf, Choi, Jo and Boo2024; Denoeud et al., Reference Denoeud, Godfroy, Cruaud, Heesch and Nehr2024). When viewed in this context, Choi et al. (Reference Choi, Graf, Choi, Jo and Boo2024) concluded that a brown algal affinity for Miaohephyton, a form from the Ediacaran Doushantuo Formation of South China with conceptacle-like structures and possible intercalary meristem (Xiao et al., Reference Xiao, Knoll and Yuan1998), was unlikely, and Gibson et al. (Reference Gibson, Shih, Cumming, Fischer and Crockford2018), together with uncertainties regarding anatomical reconstructions, questioned a rhodophyte affinity for Rafatazmia and Ramathallus from the Mesoproterozoic (ca. 1.6 Ga) Chitrakoot Formation of India. Time-calibrated molecular phylogenies of green algae are provided in Verbruggen et al. (Reference Verbruggen, Ashworth, LoDuca, Vlaeminck and Cocquyt2009), Leliaert et al. (Reference Leliaert, Smith, Moreau, Herron, Verbruggen, Delwiche and De Clerck2012), Draisma et al. (Reference Draisma, Prud’homme van Reine, Sauvage, Belton, Gurgel, Lim and Phang2014), Del Cortona et al. (Reference Del Cortona, Jackson, Bucchini, Van Bel and D’hondt2020), Hou et al. (Reference Hou, Ma, Shi, Li, Yang, Xiao, De Clerck, Leliaert and Zhong2022), and Yang et al. (Reference Yang, Ma, Wang, Tian, Sun, Zhang, Xiao, De Clerck, Leliaert and Zhong2023), and those for red algae are provided in Yoon et al. (Reference Yoon, Hackett, Ciniglia, Pinto and Bhattacharya2004, Reference Yoon, Zuccarello, Bhattacharya, Seckbach and Chapman2010), Aguirre et al. (Reference Aguirre, Perfectti and Braga2010), Yang et al. (Reference Yang, Boo, Bhattacharya, Saunder, Knoll, Fredericq, Graf and Yoon2016), and Peña et al. (Reference Peña, Vieira, Braga, Aguirre, Rosler, Baele, De Clerck and Le Gall2020). Additional studies that demonstrate the application of this approach to the interpretation of fossil macroalgae include Xiao et al. (Reference Xiao, Knoll, Yuan and Pueschel2004), Tang et al. (Reference Tang, Pang, Yuan and Xiao2020), LoDuca et al. (Reference LoDuca, Swinehart, LeRoy, Tetreault and Steckenfinger2021), Hou et al. (Reference Hou, Ma, Shi, Li, Yang, Xiao, De Clerck, Leliaert and Zhong2022), D. Li et al. (Reference Li, Luo, Tang, She and Xiao2023), and LoDuca (Reference LoDuca2024, Reference LoDuca2025).
Preservation of noncalcified macroalgae in the Proterozoic and lower Paleozoic fossil record
Experimental taphonomy
In comparison to investigations of animal groups (e.g., Sansom et al., Reference Sansom, Gabbott and Purnell2010; Naimark et al., Reference Naimark, Kalinina, Shokurov, Boeva, Markov and Zaytseva2016; Newman et al., Reference Newman, Daye, Fakra, Marcus, Pajusalu, Pruss, Smith and Bosak2019; Clements et al., Reference Clements, Purnell and Gabbott2022; Corthésy et al., Reference Corthésy, Saleh, Antcliffe and Daley2025; Fraga and Vega, Reference Fraga and Vega2025), relatively little work of this nature has been done for macroalgae. However, Mayo de la Iglesia et al. (Reference Mayo de la Iglesia, Saleh, Antcliffe, Gueriau and Daley2025) reported that, when buried in kaolinite, the marine green macroalgal taxa Chaetomorpha and Caulerpa, analogs of which, if not members of the same lineages, have been documented from lower Paleozoic strata (e.g., LoDuca et al., Reference LoDuca, Meacher, Pepper, Brett and Isotalo2023; Li and Zhang, Reference Li and Zhang2025; LoDuca, Reference LoDuca2025), retained external morphology with little change after the nine-week study interval. These findings, when coupled with the generally decay-resistant nature of cellulose (Béguin and Aubert, Reference Béguin and Aubert1994), provide important empirical support for the preservability of macroalgae. Additionally, this study found that organic matter did not spill outside the algal cells and that internal details, such as nuclei and organelles, as well as the pigments phycoerythrin and chlorophyll were lost over the study interval. Decay experiments that examined the fate of biomarkers in macroalgae were conducted by Bobrovskiy et al. (Reference Bobrovskiy, Poulton, Hope and Brocks2024).
Taphonomic windows for noncalcified macroalgae
Only two modes of preservation have been documented among Proterozoic and lower Paleozoic material identified with a high degree of confidence as noncalcified macroalgae: (1) kerogenization in the context of carbonaceous compressions, in some cases accompanied by localized pyritization and/or aluminosilicification; and (2) molds, in some cases with associated casts. The latter mode, however, is known from only a handful of macroalgal occurrences, all of which are Ediacaran, including the limestones of the Shibantan Member of the Dengying Formation in South China and the sandstones of the Ediacara Member of the Rawnsley Quartzite in South Australia (Wan et al., Reference Wan, Chen, Yuan, Pang, Tang, Guan, Wang, Pandey, Droser and Xiao2020; Xiao et al., Reference Xiao, Gehling, Evans, Hughes and Droser2020, Reference Xiao, Chen, Pang, Zhou and Yuan2021). Algal material that is phosphatized and silicified is known from the Proterozoic and lower Paleozoic (see examples provided above, but also Chai et al., Reference Chai, Aria and Hua2022), but all of this material falls below the size threshold for macroalgae. Thus, establishing a macroalgal affinity for macrofossil material that is not preserved as carbonaceous compressions, especially if recovered from strata of post-Proterozoic age, would require particularly strong evidence in terms of the various items discussed in the Identification section.
The kerogenization window, which entails diagenetic polymerization of organic carbon to kerogen, bears further scrutiny. Two variations on this theme are evident for fossil macroalgae. The first is Burgess Shale-type (BST) preservation (sensu Butterfield, Reference Butterfield1995, Reference Butterfield2003). Here, macroalgae are preserved in shales and mudstones (i.e., fine-grained siliciclastic sediment) and often show localized pyritization and/or aluminosilicification (Fig. 7.1, 7.2), with the pyrite in many instances being altered later to iron oxides (Gabbott et al., Reference Gabbott, Hou, Norry and Siveter2004; Gaines et al., Reference Gaines, Briggs and Zhao2008; Cai et al., Reference Cai, Schiffbauer, Hua and Xiao2012; Forchielli et al., Reference Forchielli, Steiner, Kasbohm, Hu and Keupp2014; Schiffbauer et al., Reference Schiffbauer, Xiao, Cai, Wallace, Hua, Hunter, Xu, Peng and J. Kaufman2014; LoDuca et al., Reference LoDuca, Wu, Zhao, Xiao, Schiffbauer, Caron and Babcock2015b). This type of preservation characterizes all macroalgal occurrences known from the Cambrian and all macroalgal material preserved as carbonaceous compressions from the Proterozoic, with a possible exception of some of the material from the limestone intervals in the aforementioned Shibantan Lagerstätte. Notably, in Cambrian BST deposits, pterobranch material typically has a distinctive luster that is lacking in associated macroalgal material (LoDuca et al., Reference LoDuca, Caron, Schiffbauer, Xiao and Kramer2015a).
Modes of preservation for macroalgae. (1) Burgess Shale-type preservation of Fuxianospira gyrata Chen and Zhou, Reference Chen and Zhou1997, specimens, Cambrian (Drumian) Marjum Formation, House Range, Utah, KUMIP 373593, (2) elemental map of central area of (1) showing localized areas of iron enrichment; (3) Bertie dolostone-type preservation of a Wiartonella nodifera LoDuca and Tetreault, Reference LoDuca and Tetreault2017, specimen, Silurian (Wenlockian) Eramosa Formation, Wiarton, Ontario, ROM 63803, (4) elemental maps of area marked by arrow in (3) showing presence of carbon but not iron or silica; (5) BSE-SEM image of a Buthograptus laxus Hall, Reference Hall1861, specimen showing distinctive ‘mud-cracked’ pattern on frond central axis, Ordovician (Sandbian) Platteville Formation, Wisconsin, UWGM 2366. Scale bars are (1) 1 mm, (2) 2 mm, (3) 5 mm, (4) 0.5 mm, (5) 0.2 mm.

Figure 7. Long description
Panel 1 is a photograph of Fuxianospira gyrata showing dark, ribbon-like carbonaceous compressions on a grey rock matrix. A vertical scale bar at the bottom right represents 1 mm.
Panel 2 is an elemental map of the central area of panel 1. It uses yellow stippling to show the concentration of iron, F e, which corresponds to the fossil’s structure. A vertical scale bar at the bottom right represents 2 mm.
Panel 3 is a photograph of Wiartonella nodifera, a long, dark, feathery fossil with a central axis and lateral branches on a light tan dolostone. A white arrow on the left side points to a specific branch. A vertical scale bar at the bottom left represents 5 mm.
Panel 4 consists of three stacked elemental maps corresponding to the area marked by the arrow in panel 3. From top to bottom: a blue map for silica, S i; a red map for iron, F e; and a green map for carbon, C. The carbon map shows a high density of bright green filaments, while the S i and F e maps show a diffuse, low-concentration distribution. A vertical scale bar in the green map represents 0.5 mm.
Panel 5 is a B S E S E M image of Buthograptus laxus in grayscale. It shows a textured surface with a prominent mud-cracked pattern consisting of small, irregular polygonal plates along the central axis of the fossil frond. A vertical scale bar at the bottom right represents 0.2 mm.
In the other variation on the kerogenization theme, macroalgae are preserved within fine-grained carbonate, as opposed to siliciclastic, sediment. Because this taphonomic pathway applies to macroalgae that are locally abundant in dolostone intervals within the well-known Silurian Bertie Group of Ontario and New York (e.g., LoDuca et al., Reference LoDuca, Swinehart, LeRoy, Tetreault and Steckenfinger2021), it is referred to herein as Bertie dolostone-type (BDT) preservation. Carbonate intervals that host macroalgae with BDT preservation tend to be argillaceous and dense (‘hammer-ringing’), and they commonly display conchoidal fracture. For macroalgal material, pyritization and aluminosilicification are generally lacking (Fig. 7.3, 7.4), and the carbon is typically thick, with extensive networks of cracks. The geometry of the latter was described by Edwards (Reference Edwards1977, p. 826) for Powysia from the Silurian of Wales as being “cleat-like” in reference to the orthogonal fractures formed in coal deposits during devolatilization and compaction of the carbonaceous material (Laubach et al., Reference Laubach, Marrett, Olson and Scott1998). In other cases, the fracture pattern is more akin to that of desiccation cracks (LoDuca, Reference LoDuca2019, LoDuca et al., Reference LoDuca, Meacher, Pepper, Brett and Isotalo2023), such as in Buthograptus material from the Ordovician Platteville Formation of Wisconsin (Fig. 7.5). More work is needed to understand the details of the BDT taphonomic pathway, but it seems that lithification of the carbonate sediment, as with bed-topping carbonate cements in BST deposits (Gaines et al., Reference Gaines, Hammarlund, Hou, Qi, Gabbott, Zhao, Peng and Canfield2012), commenced early, perhaps as a consequence of low oxygen levels below the sediment–water interface (LoDuca and Brett, Reference LoDuca, Brett, Brett and Baird1997).
For deposits with BDT preservation, low oxygen conditions at and extending below the seafloor can often be tied to restricted circulation, in some cases imposed by associated bioherms and other localized forms of seafloor topography (see below), and early lithification of the carbonate sediment is indicated by macroalgal stalks, branches, and internal siphons that, unlike the case in BST preservation, retain much of their original three-dimensional form, such that they are circular in cross-section, or nearly so (e.g., LoDuca and Tetreault, Reference LoDuca and Tetreault2017) (Fig. 7.3). BDT preservation applies to most Ordovician and Silurian macroalga-bearing deposits, including many of those listed in LoDuca et al. (Reference LoDuca, Bykova, Wu, Xiao and Zhao2017, table 1), although some are known that show BST preservation (e.g., Botting et al., Reference Botting, Muir, Jordan and Upton2015, Reference Botting, Muir, Pates, McCobb, Wallet, Willman, Zhang and Ma2023; Van Roy et al., Reference Van Roy, Briggs and Gaines2015; Saleh et al., Reference Saleh, Pittet, Sansjofre, Guériau and Lalonde2020).
Depositional/stratigraphic context of noncalcified macroalgae in the Proterozoic and lower Paleozoic fossil record
As noted above, Proterozoic and Cambrian macroalga-bearing intervals are broadly similar in that they mainly accumulated in environments in which fine-grained siliciclastic sediments were deposited. A key difference between Ediacaran and Cambrian macroalga-bearing intervals is evident, however, in terms of the associated biota. Specifically, animals (Ediacara-type macro-organisms) are typically absent in the former (e.g., Xiao et al., Reference Xiao, Yuan, Steiner and Knoll2002; Wang et al., Reference Wang, Wang, Du and Wang2014, Reference Wang, Du, Komiya, Wang and Wang2015; Ye et al., Reference Ye, Tong, An, Hu, Tian, Guan and Xiao2017; Wan et al., Reference Wan, Chen, Yuan, Pang, Tang, Guan, Wang, Pandey, Droser and Xiao2020; but for key exceptions see Xiao et al., Reference Xiao, Gehling, Evans, Hughes and Droser2020; Hou et al., Reference Hou, Wang, Hou, Ramezani, Tang and Shen2025), whereas a wide variety of nonbiomineralized animal taxa together with shelly faunas characteristic of the timeframe (e.g., brachiopods, echinoderms, trilobites) typically accompany macroalgae in Cambrian Lagerstätten, such as the Kaili (Zhao et al., Reference Zhao, Zhu, Babcock, Yuan, Parsley, Peng, Yang and Wang2005), Chengjiang (Chen and Zhou, Reference Chen and Zhou1997), Qingjiang (Fu et al., Reference Fu, Tong, Dai, Liu and Yang2019), Balang (Fu et al., Reference Fu, Wu, Liu, Peng and Zhao2010), Nuititang (Yang et al., Reference Yang, Zhang, Jiang and Gao2003), Tsinghsutung (Wu et al., Reference Wu, Zhao and Zhao2024), and Burgess Shale (Caron and Jackson, Reference Caron and Jackson2008) biotas. The reasons for this discrepancy are poorly understood and more work is needed in this area. Certainly, however, nonbiomineralized macrofaunas are known from other facies/taphonomic windows in the Ediacaran. Indeed, in the Khatyspyt Formation of Siberia they occur in limestone beds that alternate with mudstone intervals preserving an abundance of macroalgae as carbonaceous compressions (Grazhdankin et al., Reference Grazhdankin, Balthasar, Nagovitsin and Kochnev2008; Nagovitsin et al., Reference Nagovitsin, Rogov, Marusin, Karlova, Kolesnikov, Bykova and Grazhdankin2015; Bykova et al., Reference Bykova, LoDuca, Ye, Marusin, Grazhdankin and Xiao2020).
Ordovician and Silurian macroalga-bearing intervals differ from those of the Cambrian in that they often accumulated in carbonate-dominated depositional environments. They also differ in a further key environmental characteristic in that they often accumulated in restricted-marine settings, in many cases in areas between and along bioherms and other localized topographic highs, such as small-scale scarps, which limited water circulation. Animals within these distinctive macroalga-rich settings, when present, comprised unusual, depauperate faunas composed of worms, including abundant scolecodont-bearing polychaetes, ostracods, eurypterids and other nonbiomineralized arthropods, lingulid brachiopods, and, in some cases, dendroid graptolites. The make-up of these biotas appears to reflect biotic exclusion imposed by low-oxygen conditions, perhaps coupled with abnormal salinity. Those in which macroalgae comprise the most abundant constituents were termed thallophytic alga-dominated (TA) biotas by LoDuca (Reference LoDuca1995), and macroalga-dominated deposits of this nature have been termed algal-Lagerstätten (A-L) (LoDuca et al., Reference LoDuca, Melchin and Verbruggen2011). To date, six A-L have been documented in the Ordovician and 17 in the Silurian (LoDuca et al., Reference LoDuca, Bykova, Wu, Xiao and Zhao2017; LoDuca, Reference LoDuca2025). The greater number for the Silurian may reflect enhanced bioherm development during this timeframe. A key stratigraphic aspect of some Silurian A-L is that they show considerable lateral persistence. For example, an A-L within the Goat Island Formation extends along the outcrop belt in western New York for some 100 km (LoDuca and Brett, Reference LoDuca, Brett, Brett and Baird1997), and an A-L within the Schoolcraft Formation of northern Michigan has been traced for nearly 50 km (LoDuca, Reference LoDuca2025). Thus, conditions for the formation of these distinctive deposits seem to have been fairly widespread at certain times during the Silurian.
Despite the aforementioned differences, several key factors appear to broadly characterize Proterozoic and lower Paleozoic macroalga-bearing deposits: (1) rapid burial, with evidence of obrution in tempestites or turbidite beds indicated by graded bedding; (2) lack of abundant trace fossils, with burrows, when present, mainly comprising unbranched horizontal forms (e.g., Planolites); (3) uneven spatial distribution of the macroalgal material, with this material typically being concentrated in localized ‘patches’ (e.g., LoDuca and Brett, Reference LoDuca, Brett, Brett and Baird1997); and (4) multitaxic floras, with three or more macroalgal species being typical, although rare exceptions with just one or two species are known (LoDuca et al., Reference LoDuca, Bykova, Wu, Xiao and Zhao2017; Bykova et al., Reference Bykova, LoDuca, Ye, Marusin, Grazhdankin and Xiao2020). In terms of rapid burial, a possible further indicator is the presence of thalli that appear to have been buried upright, in their original growth position (e.g., LoDuca, Reference LoDuca1990, fig. 3.7; LoDuca, Reference LoDuca2019, fig. 4.10). Some of these might instead be transported segments of fragmented thalli, but they often occur in discrete clusters (e.g., LoDuca, Reference LoDuca1990, fig. 3.10; LoDuca, Reference LoDuca2019, fig. 4.8) and a vertical cut through the center of one such specimen (Fig. 8.1) shows the thallus extending through much of the 3-cm-thick bed (Fig. 8.2).
Thallus of Medusaegraptus mirabilis Ruedemann, Reference Ruedemann1925, buried upright, in original life position, Silurian (Wenlockian) Goat Island Formation, Gasport, New York, UMMP 90192. (1) Bedding plane view of thallus, (2) cross-section of specimen in (1) showing thallus (arrows) extending vertically through much of bed. Scale bars are (1) 20 mm, (2) 10 mm.

Figure 8. Long description
A two-panel scientific photograph.
Panel 1, on the left, shows a bedding plane view of the thallus. At the center is a dark, dense circular core. Radiating outward from this core are numerous thin, dark, branching filaments that extend in all directions across the light tan rock surface. A vertical white scale bar in the lower left corner represents 20 mm. The number 1 is in the bottom right corner.
Panel 2, on the right, shows a cross-section of the specimen. The rock has a layered, horizontal grain in shades of brown and tan. Three white arrows on the left side point rightward to dark, carbonaceous vertical structures that cut through the horizontal bedding planes. These structures represent the thallus extending vertically in its original life position. A vertical white scale bar in the lower left corner represents 10 mm. The number 2 is in the bottom right corner.
From the foregoing, it is clear that, as with the details of preservation, there are particular ‘motifs’ that broadly characterize macroalgal occurrences in Proterozoic and lower Paleozoic strata in terms of depositional/stratigraphic factors, some aspects of which are age specific. For all Proterozoic and lower Paleozoic macroalga-bearing deposits, much work remains to be done in terms of understanding what, if any, relationship might exist with positive carbon isotope excursions (CIEs). During the Silurian, such CIEs have been linked with regressions, which exposed large amounts of carbonate rock to weathering and possibly also enhanced burial of organic carbon (Loydell, Reference Loydell2007). In this context, macroalga-bearing intervals, including A-L deposits, should be positioned stratigraphically between CIEs, since they seem to be associated with the early stages of transgressions (LoDuca and Brett, Reference LoDuca, Brett, Brett and Baird1997; Vrazo et al., Reference Vrazo, Brett and Ciurca2017). Future research in this area, combined with sequence stratigraphy, holds promise in that it could lead to a predictive model that is useful for locating new macroalga-bearing deposits.
Broad-scale ecological and evolutionary patterns of Proterozoic and early Paleozoic noncalcified macroalgae
A large-scale study by LoDuca et al. (Reference LoDuca, Bykova, Wu, Xiao and Zhao2017) documented two major macroalgal floras during the early Paleozoic on the basis of morphogroup composition. Specifically, Cambrian macroalgal assemblages show dominance by simple morphogroups, with the thalli primarily being unbranched tubes or ribbons, or dichotomizing axes with thin delicate branches. This so-called Cambrian Flora was replaced in the Ordovician, roughly concomitant with the Great Ordovician Biodiversification Event (GOBE), by the Ordovician Flora, which persisted through the Silurian and was dominated by comparatively complex morphogroups. A further finding of that study is that macroalgal assemblages during the Cambrian broadly resembled those of the Ediacaran, so that there was no detectable ‘Cambrian explosion’ of macroalgae. Instead, morphospace occupation by Cambrian macroalgae comprised a slightly contracted version of that during the Ediacaran (Fig. 9).
Scatter plots showing realized morphospace (convex hulls in solid line) for macroalgae in the Silurian, Ordovician, Cambrian, Ediacaran, and all four periods pooled (convex hull in dashed line) as determined through non-metric multidimensional scaling (NMDS) analysis. Histogram shows sum of variances of NMDS dimensions 1 and 2. Figure modified from LoDuca et al. (Reference LoDuca, Bykova, Wu, Xiao and Zhao2017).

Figure 9. Long description
A multi-panel figure containing five scatter plots and one bar chart.
Panels 1 through 5 are scatter plots with N M D S 1 on the x-axis ranging from -2 to 1 and N M D S 2 on the y-axis ranging from -1.0 to 1.5. Each plot contains a cluster of red, blue, and green data points and displays Stress = 0.17 in the top-left corner.
* Top-left panel Silurian: A thick black convex hull outlines a large area shifted toward the top-right, labeled with a blue S.
* Top-center panel Ordovician: A thick black convex hull outlines a central area, labeled with a green O.
* Top-right panel Cambrian: A thick black convex hull outlines a central area, labeled with a black C.
* Bottom-left panel Ediacaran: A thin black convex hull outlines a large area shifted toward the bottom-right, labeled with a red E.
* Bottom-center panel All time periods: Overlays all previous convex hulls. A dashed purple line represents the pooled convex hull for all four periods. The hulls for S, O, C, and E are nested and overlapping, showing the expansion of morphospace over time.
Panel 6 (bottom-right) is a bar chart titled N M D S variance. The y-axis is N M D S variance from 0.0 to 0.6 and the x-axis is Time bin. Four bars are shown from left to right:
* E (red bar): approximately 0.38.
* C (black bar): approximately 0.35.
* O (green bar): approximately 0.58.
* S (blue bar): approximately 0.72.
The trend shows a general increase in variance from the Ediacaran through the Silurian periods.
Notably, this distinctive pattern has been bolstered by Proterozoic and lower Paleozoic macroalgal occurrences that have been discovered and described since that report (e.g., Lan et al., Reference Lan, Yang, Zhang and Hou2018; LoDuca, Reference LoDuca2019, Reference LoDuca2024, Reference LoDuca2025; Bykova et al., Reference Bykova, LoDuca, Ye, Marusin, Grazhdankin and Xiao2020; LoDuca et al., Reference LoDuca, Swinehart, LeRoy, Tetreault and Steckenfinger2021, Reference LoDuca, Meacher, Pepper, Brett and Isotalo2023; Wang et al., Reference Wang, LoDuca, Wu, Tang and Sun2022; Kröger et al., Reference Kröger, Tinn, Rikkinen, Jolis, Butcher, Toom and Hints2023; R. Li et al., Reference Li, Cui, Fu and Zhang2023; G. Li et al., Reference Li, Wei, Guo and Cong2024; Liu et al., Reference Liu, Li, Tang, Zhao, Song, Zhou, Song and Ren2024; Wu et al., Reference Wu, Zhao and Zhao2024). In addition, recent studies have shown that much of the change from the Cambrian Flora to the Ordovician Flora reflects major evolutionary radiations within the green algal orders Dasycladales and Bryopsidales, with Late Ordovician and Silurian macroalgal floras resembling to a large degree those composed of dasycladalean and bryopsidalean algae in modern carbonate-dominated shallow-marine environments, such as the Bahama Banks (LoDuca Reference LoDuca2024, Reference LoDuca2025).
A large-scale study conducted along similar lines for Proterozoic macroalgae by Bykova et al. (Reference Bykova, LoDuca, Ye, Marusin, Grazhdankin and Xiao2020) noted marked increases in macroalgal morphological diversity and maximum size in the Tonian and Ediacaran periods, respectively. In addition, analysis of Ediacaran macroalgal assemblages showed that macroalgae broadly follow the Ediacara-like fossil assemblages, with a marked drop in most of the studied metrics in the terminal Ediacaran stage. Notably, this roughly coincides with the Kotlinian crisis experienced by Ediacara-type macro-organisms, highlighting the possibility that this extinction event during the Ediacaran–Cambrian transition affected both macroalgae and Ediacara-type macro-organisms.
Despite these recent advances, more work is needed to better understand broad-scale evolutionary and ecological changes among macroalgae during the Proterozoic and early Paleozoic. For example, what triggered/drove increases in macroalgal morphological diversity during the Tonian, Ediacaran, and Ordovician? For the Ordovician, LoDuca et al. (Reference LoDuca, Bykova, Wu, Xiao and Zhao2017) suggested that this might reflect an intensification of grazing pressure associated with the GOBE, but more work is needed to fully evaluate this hypothesis, including refining the timing of this change in macroalgal floras and developing a better understanding of meso-herbivory during the Cambrian and Ordovician. In addition, further study is needed with regard to documenting extinction events among macroalgae and the details of subsequent macroalgal recovery, especially in relation to the Cryogenian glaciations, the Kotlinian crisis, and the Sinsk event (Murphy et al., Reference Murphy, Penny, Zhuravlev and Wood2025; McIlroy et al., Reference McIlroy, Denyszyn, Olschewski, Rosse-Guillevic and Muirhead-Hunt2026; Zeng et al., Reference Zeng, Liu, Zhao, Luo and Wang2026). This, in turn, would benefit substantially from the identification and description of new macroalgal occurrences in the fossil record that are positioned in close stratigraphic proximity to these events.
Potential pitfalls when investigating Proterozoic and lower Paleozoic noncalcified macroalgae
Fossil noncalcified macroalgae lend themselves easily to over-interpretation. The three most common “pitfalls” in this regard are examined below, along with suggested pathways around them.
Attempting to erect a new macroalgal species on the basis of limited material
It is axiomatic in paleontology that erecting a new species on the basis of a single specimen is best avoided, and fossil macroalgae are no exception, although the pull to do so can be especially great because specimens tend to be scarce in general. Problems that can potentially arise are many and varied and include the fact that it is not uncommon for macroalgal groups to show heteromorphic alternation of generations. In addition, as noted above, dasycladalean thalli can appear very different at different ontogenetic stages because of lateral shedding, and taphonomic artifacts are difficult to separate from original morphology with limited material. Examples of how an abundance of material facilitates rigorous taxonomic treatment are provided by Tang et al. (Reference Tang, Pang, Yuan and Xiao2020) and LoDuca and Tetreault (Reference LoDuca and Tetreault2017). Often, when dealing with material that aligns well with a macroalgal affinity but cannot be readily accommodated by an existing species and is limited to less than a few specimens, the best approach may be to simply label it as “undetermined macroalgae” and to leave it at that.
Attempting to assign a species to a higher-level group
The temptation to assign a red, green, or brown affinity to a fossil macroalgal species is undoubtedly strong. Nonetheless, in part because of a propensity for convergent evolution of thallus shapes, this is best avoided unless compelling evidence exists in terms of the items discussed above, including complex thallus architectures and/or reproductive structures that are diagnostic of particular groups. Notably, informative evolutionary and ecological analyses of fossil macroalgae can be conducted by classifying species in a morphological rather than strictly biological sense (e.g., Xiao and Dong, Reference Xiao, Dong, Xiao and Kaufman2006; LoDuca et al., Reference LoDuca, Bykova, Wu, Xiao and Zhao2017; Bykova et al., Reference Bykova, LoDuca, Ye, Marusin, Grazhdankin and Xiao2020; but see Machado and Oliveira, Reference Machado and Oliveira2024, for some key caveats).
Assigning an algal affinity to material as a ‘default’ position
As mentioned above, for many fossils with a macroalga-like form, a complete lack of features diagnostic of other groups will not be enough to definitively establish a macroalgal affinity. In such cases, to avoid using macroalgae as a taxonomic wastebasket, it is essential to evaluate the material further in terms of the other areas examined herein, including detailed morphological comparisons with living macroalgae, mode of preservation, and depositional/stratigraphic context. Nonetheless, even with a multi-pronged approach, the results can be less than definitive, especially when working with simple tubular and ribbon-like forms that lack a holdfast since, in addition to macroalgae, such forms are known for a wide array of other biogenic material, including but not limited to coprolites/cololites, the sheaths of giant sulfur-oxidizing bacteria (e.g., Thioploca), and the organic tubes of various early tubicolous animals. A good example of a cautionary tale in this regard is provided by Margaretia, a taxon erected on the basis of material from the Burgess Shale (Walcott, Reference Walcott1931). For a time, Margaretia was regarded as a green alga with a prostrate cylindrical stolon somewhat similar to that of Caulerpa (Conway Morris and Robison, Reference Conway Morris and Robison1988), and an algal affinity, in general, is supported by its mode of preservation, association with other photoautotrophs, such as Marpolia, and depositional environment. Nanglu et al. (Reference Nanglu, Caron, Conway Morris and Cameron2016), however, redescribed it as the tube of an enteropneust hemichordate with rare examples of the tube-builder (Oesia) preserved within. In light of these issues, although a diverse array of evidence supports a macroalgal affinity for Vendotaenia and other vendotaenids (reviewed in Chen et al., Reference Chen, Yang, Bouougri, Zhao and Hu2025; Vayda et al., Reference Vayda, Birolini and Xiao2026) and for forms such as Fuxianospira, Sinocylindra, and Yunnanospirellus, a good approach at the present time is to regard a macroalgal interpretation for these and some other simple tubular and ribbon-like forms as reasonable but meriting further study. For such forms, further examination of fine-scale morphology, including wall microstructure, coupled with chemical analyses along the lines of those mentioned above may serve to unequivocally establish their phylogenetic affinity.
Summary
This paper reviews recent advances in understanding of the early macroalgal fossil record, including identification methods, modes of preservation, depositional/stratigraphic context, and broad-scale ecological and evolutionary history, and highlights research topics that appear to hold particular promise for future study. A key takeaway is that interpretation of a macroalgal affinity for a given fossil is most robust when informed by multiple avenues of inquiry. It is also important to be mindful that, for some macroalga-like material, the available evidence may not be sufficient to allow for a definitive identification or higher-level assignment. Acknowledging as much, however, can nonetheless carry considerable value when presented in the context of a thorough evaluation that addresses, to the fullest extent possible, each of the areas examined herein.
Acknowledgments
This paper emerged from a keynote presentation delivered at the IGCP 735 meeting held in Llandrindod, Wales, and the organizers are thanked for the invitation and for their input to this project. SEM imaging at the University of Michigan EMAL facility was kindly assisted by J. Schiffbauer and O. Neill. The following have been especially helpful in planning and/or conducting fieldwork over the years: C. Brett, D. Tetreault, B. Goodman, T. Swinehart, D. Mikulic, J. Kluessendorf, S. Xiao, Y. Zhao, M. Wu, P. Wang, H. Sun, X. Yang, O. Tinn, B. LoDuca, S.M. LoDuca, and J. LoDuca. This manuscript benefitted from thoughtful and constructive comments provided by Guest Editor J. Botting and by reviewers S. Xiao and L. Muir, and from information provided by K. Maloney, G. Pari, I. Bobrovskiy, and R.A. Armitage. Images were generously contributed by L. Muir, S. Xiao, Q. Tang, R. Lerosey-Aubril, K. Maloney, and O. Tinn.
Competing interests
The author declares none.



