

1. Introduction
This paper examines the pattern and determinants of committee chair appointments by the General Council (GC) of the World Trade Organization (WTO). The motivation for this inquiry lies in the nature of decision making in the WTO, in which committee chairs can potentially influence agendas, as well as negotiating and implementation outcomes. Since the founding of the WTO in 1995, developing countries, now representing 77% of the WTO membership, have raised the issue of fairness in country representation, especially with regard to multilateral trade negotiations. Jawara and Kwa (Reference Jawara and Kwa2004), for example, claim that the power structure of WTO governance is biased against the interests of developing countries, through their lack of access to positions of influence in the organization, and the power of existing committee chairs, dominated by high-income countries, to dominate negotiating texts and agendas. In this regard, the trend in committee chair appointments in the major WTO governing and negotiating committees may indicate the degree to which developing country influence in the WTO has changed in recent years. In addition, many subsidiary WTO committees deal with administrative matters and specific implementation issues associated with WTO rules and market access agreements, in which representation as chairs may help determine the degree of developing country participation in day-to-day WTO trade relations. At the same time, the importance of committee chairs in trade negotiations, and in the efficient implementation of the WTO agreements, suggests the benefits of a meritocratic system of chair selection. This study examines the statistical evidence to infer the criteria used by the GC in their committee chair appointments from 1995 to 2011. The results support the hypothesis that the General Council uses a human capital model of chair selection, while maintaining a balance of developed and developing countries and a balance among the geographical regions represented. Member countries with greater experience in the GATT/WTO system, larger participation in world trade, and greater investments in the size and quality of their Geneva missions receive more chair appointments. Emerging market (EM) countries receive a particularly large share of appointments, while LDC countries have a disproportionately small share. Large trading powers such as the United States and China have small share of appointments, apparently for political, and perhaps their own strategic, reasons. The human capital model and the pattern of committee chair appointments have important implications for the future of WTO governance and negotiations, and for the future commitment of WTO members to the multilateral trading system.
The paper is organized as follows. The first section presents information on the WTO, including the formal structure of WTO committees and the importance of informal committee chair practices, followed by a brief discussion of the ‘human capital’ model of chair selection. The next section briefly summarizes events that led to discontent with WTO governance by many developing countries. The study then examines empirical evidence regarding WTO chair appointments in terms of developed and developing country representation, and introduces a set of panel data that allows a more detailed probit analysis of chair appointments by nationality. Further discussion focuses on additional patterns within committee groupings and the frequency of individuals serving as chairs. The final section summarizes the statistical results and offers a perspective on the role of WTO chairs in the larger issue of WTO governance and the implications for developing country representation in the future.
2. The WTO as an institution
The WTO carries out three major functions: (1) negotiating multilateral trade liberalization and rules for market access; (2) implementing and maintaining the WTO agreements on a day-to-day basis; and (3) providing a forum for the settlement of disputes, based on rules and processes agreed by the members. These functions are carried out by the delegations of the member countries in Geneva, aided by a small WTO secretariat of support staff and trade specialists.Footnote 1 As in other large representative organizations, most of the WTO's work is done in committees controlled by the member countries, subdividing negotiating, implementation, and administrative issues into specialized deliberations, each led by a committee chair. The WTO does not use formal rules of member representation in allocating chair appointments, so this task falls to the GC, to be discussed below. At the very top of the WTO organizational chart stands the Ministerial Conference (MC), which must formally approve all major WTO agreements.Footnote 2 Beneath the MC, the WTO GC oversees day-to-day operations and multilateral negotiations, and appoints most WTO committee chairs. The GC meets in a plenary session about 12 times a year, and consists of the heads-of-delegation for all WTO members. This same body also convenes as the Dispute Settlement Body and the Trade Policy Review Body, but for each of these plenary committees there is a separate chairperson. Subordinate to the GC are also several standing committees and working groups, including three Councils for trade in goods, for trade in services, and for trade-related aspects of intellectual property (TRIPS). The Goods and Services Councils, in turn, oversee subordinate committees on specialized topics. In addition, the GC oversees the Trade Negotiations Committee (TNC), which convenes when multilateral trade negotiations are in progress, and creates subsidiary committees focusing on specific negotiating issues. In the Doha Round, there have been ten such sub-committees, dealing individually with market access in goods, agriculture (with cotton as a subsidiary committee), and services, trade facilitation, TRIPS, Dispute Settlement, Rules (antidumping, subsidies, regional trade agreements), trade and environment, and trade and development. There are also two pleurilateral committees linked with agreements of subsets of WTO members who have signed separate agreements on civil Aircraft and Government Procurement. Membership on these committees is restricted to signatory members. Each chair appointed to a committee reporting to the GC or its subsidiary committees is subject to an annual appointment cycle. One additional set of committees under the GC comprises the Working Parties on WTO accession, one for each country negotiating entry into the WTO, and their activities often span several years. Chairs of these Working Parties often serve several years, although in long accession negotiations (of which there are many) chairpersons will often be changed.
The central institutional feature of WTO decision making is that final agreement must be based on consensus, a difficult requirement in such a large organization.Footnote 3 Kenworthy (Reference Kenworthy2000) and Hoekman and Kostecki (Reference Hoekman and Kostecki2009) note that consensus is regarded in diplomatic practice as ‘the absence of dissent’, where there is no open opposition to the agreement under consideration. Members may not like the decision, but are nonetheless willing to join the consensus if they believe it is the best outcome available to them. Consensus is therefore the ‘holy grail’ of any WTO multilateral deliberation, since no final agreement on most issues is possible without it. Committee chairs thus often have the challenging job of moving negotiations or discussions towards consensus. While the WTO Agreement itself formally delegates chair appointments to each individual committee,Footnote 4 WTO practice has placed the decision squarely with the GC (see WTO, 2012a). This arrangement suggests that the GC anticipated from the early years of the organization that representational balance of WTO members through chair appointments would require centralized, systematic control. The WTO GC chair presents a single list each year, usually in February, naming chairs to all active committees, which must be approved by consensus, after lengthy consultation and bargaining with the WTO membership, with no changes. The one exception to the one-year rotating terms is the chair of the TNC itself, to which the GC has, at its discretion during the Doha Round, named the Director-General (D-G) on a continuing basis. The D-G is thereby placed in a pivotal role in multilateral trade negotiations. In addition, the GC has established a broad set of principles that committee chairs of the GC must follow in a document known as ‘WT/L/161’ (WTO, 1996). Aside from several procedural rules for the course of meetings, the chair is given ‘complete control of the proceedings’ (ibid., rule 17) and is normally expected to preside over the meeting as a neutral party rather than as a representative of his or her country (ibid., rule 15). In general, committees must follow the principles outlined in WTO article IX (WTO Decision Making), in particular the practice of consensus (ibid., rule 28). Beneath the MC and GC in the WTO organizational structure, other WTO committees have adopted rules specific to their issue coverage, but they mirror the general rules in document WT/L/161 (Kanitz, Reference Kanitz and Kanitz2011: 14–16).Footnote 5
3. Informal elements of decision making
There are three basic types of committees to which the GC appoints chairs: (1) those that oversee major WTO activities, (2) those that engage in multilateral trade negotiations on specific issues, and (3) those that implement or administer existing agreements. The first group has standing representation from every WTO member, and includes the triumvirate of the GC, Trade Policy Review Body (TPRB), and the Dispute Settlement Body (DSB), as well as the Goods and Services Councils and the TRIPS Council. The trio of GC, TPRB, and DSB are the highest-level administrative committees, with head-of-delegation representation from each member country, and the Goods and Services Councils (subordinate to the GC) oversee the activities of other subordinate committees. The second group consists of active trade negotiating committees, whose chairs are often decisive in the success or failure of the deliberations in reaching agreement (see Tallberg, Reference Tallberg2010; Odell, Reference Odell2005, Reference Odell2009; Ismail, Reference Ismail2009). The third group, subordinate to the Goods and Services Councils, conducts much of the quotidian work of the WTO, including details of operations and rules implementation, as well as discussion of ongoing issues. Most attention and research devoted to WTO committee chairs has focused on the Doha negotiating committees and the GC, which prepares and oversees the negotiating agenda, and ultimately controls the Round. Even before the negotiations begin, for example, the GC must identify the agenda of items that will be negotiated, and, once the agenda is agreed, establish the specific negotiating groups. This is an important and often controversial part of the agenda-setting process, exemplified by the tenuous last-minute compromise that finally launched the Doha Round in October 2001 (see Das, Reference Das2002). During the negotiations themselves, bargaining must narrow the differences in country positions on many technical and complicated issues, which typically require informal discussions that go beyond the confines of the formal structure of meetings. Ultimately, any final WTO agreement requires a showing of consensus at the GC that concludes the negotiation, but negotiators are typically reluctant to reveal any flexibility in open, formal meetings. Chairs, in pursuing their primary goal of achieving consensus, must often use off-the-record, confidential meetings to discover negotiators' ‘reservation’ or ‘red-line’ positions that define the limits on concessions they can make in the negotiations. In addition, the chair's personal powers of mediation and persuasion, which may be crucial in achieving progress towards consensus, often require informal tools, such as negotiating drafts ‘on the chairs’ personal responsibility’ (see del Castillo, Reference Del Castillo and Kanitz2011: 147), a particular sequencing of issues under discussion, the timing of meetings, and the management of one-to-one informal ‘confessional’ meetings with chief negotiators.Footnote 6
Within the day-to-day ongoing administration and implementation of WTO agreements and rules in Geneva, many other committees play important, but often less dramatic and less visible, roles in trade relations. These committees are subordinate to the GC and to the Goods and Services Councils. GC-subordinate committees include ‘talking shops’ (trade and development, trade and environment; working groups on trade and investment, transfer of technology), as well as administrative (WTO budget/finance) and monitoring (balance of payments, regional trade arrangements) bodies.Footnote 7 Committees subordinate to the Goods and Services Councils focus on technical issues of the implementation of WTO agreements.Footnote 8 The importance of these committees, and of the chair appointments to them, has been the subject of debate. Unlike negotiating committees, which have a ‘legislative’ role in the WTO, these committees cannot create new rights and obligations for members.Footnote 9 However, Stewart (Reference Stewart2011) maintains that WTO administrative governance is creating a framework for global administrative law, while noting that its powers are currently weak. Lang and Scott (Reference Lang and Scott2009) claim that WTO administrative committees have created international epistemic communities of specialized trade policy experts and practitioners who discuss important trade issues and potential conflicts informally, outside the dispute settlement and formal negotiating frameworks. These forums can thereby stabilize trade relations and forestall trade disputes, an observation also made by Mavroidis (Reference Mavroidis2011: 380). Steinberg (Reference Steinberg2010), however, is skeptical that such committees can attain any independent power to resolve trade disputes, since the positions taken by representatives on them are tightly controlled by their countries. Yet the ongoing deliberations of specialized trade officials, meeting constantly with their peers on topics of mutual interest, have the potential to influence everyday trade relations, as well as future negotiations. Progress in cooperation on trade policy is certainly possible, if pursued quietly, in the interstices of the WTO's day-to-day administrative processes. To the extent that this is true, the chairs of such committees will also play an important role in the process, perhaps closer to the role of mediator and facilitator among committee members than what a ‘bureaucratic caretaker’ model might suggest. It is also important to remember that chair service on these committees may lead later to chair service on higher-level and trade negotiating committees.Footnote 10
3.1 Human capital hypothesis of committee chair selection
The importance of committee chairs in WTO negotiations and governance suggests that the GC will seek out the most-qualified candidates, subject to a broad balance in overall WTO representation. Kahler (Reference Kahler2001: 12–13), for example, observes the importance of merit in appointments to WTO leadership positions, subject to national diversity of representation. Official WTO documents themselves contain only vague indications of the qualifications for committee chairpersons, implied by the inherent powers of the chair to control the meetings and to discharge his or her role independently of home country interests. Those close to the process of selecting committee chairs emphasize the importance of diplomatic and organizational skills and experience, and familiarity with the substantive matters of the committee, with the WTO Secretariat, and with WTO procedures and rules (Lafer, Reference Lafer and Kanitz2011: vii–xiii). For practical reasons, candidates for chair positions must also be seen as capable of carrying the discussions or negotiations forward. These elements suggest the importance of the candidate's personal human capital in the selection of committee chairs. From the perspective of national representation in committee chair appointments, the selection process also implies the importance of the country's WTO mission capacity to support the activities of committee chairs among its delegates, which divert resources away from their normal duties. Larger missions thereby imply increased ability to support candidates for chair positions. Thus ‘human capital’ may act as a determinant of WTO committee chair appointments, both in terms of the qualitative attributes of individual candidates and the quantitative capacity of WTO member country delegations to support such appointments.
The committee chair selection process has been explored in the corporate governance literature (see Dunn, Reference Dunn2012 and more generally Gatewood et al., 2011) and in studies of legislative committee appointments (Padro i Miquel and Snyder, Reference Padro i Miquel and Snyder2006). This study sets out to identify the distinctive elements of WTO committee chair selection through WTO member country characteristics. In the absence of individual educational and other personal background information on all potential candidates, testing this hypothesis requires the use of country-by-country statistical information that offers proxies for important selection criteria. The most important differentiator in this regard is likely to be the size of a country's Geneva mission to the WTO.Footnote 11 A larger mission provides greater capacity for chair appointments, as described above. Small delegations, for example, find it difficult just to keep up with the WTO's day-to-day meetings and deliberations, and it was very rare for any of them to receive a chair appointment.Footnote 12 In addition, during the sample period 20 countries had no effective representation in Geneva at all, so chair appointments for them were impossible. Mission size may also signal the country's commitment to WTO representation, and therefore to developing trade diplomacy ‘assets’ in the form of better educated and experienced trade diplomats.Footnote 13 In general, the shortfall in diplomatic ‘assets’ in Geneva may explain in part the fact that 69 WTO member countries did not have a single committee chair during the sample period.
Further evidence of a higher value of a potential chair's human capital might be reflected in the country's length of experience in the GATT/WTO system, which presumably carries over into country staff members' familiarity with trade law and diplomacy. Economic indicators of a country's ability and willingness to invest resources in WTO representation could include GDP, GDP per capita, and perhaps more importantly, the country's share in world exports and the importance of trade in its economy (trade/GDP ratios). From the GC's point of view, prior experience in chairing a WTO committee will also enhance the individual's (or perhaps the delegation's) human capital, and thus the attractiveness of a candidate (or perhaps candidates from countries that have previously had chair appointments). The study therefore focuses on the nationality of the chairperson, and how WTO-specific human capital and other national indicators can be linked with the number of chair assignments a country receives. Patterns of assignments may also reveal the importance of development status and geography in committee chair representation.
Large countries Human capital considerations and the motivation of countries to develop the capacity to support WTO chair appointments may not apply in the case of very large countries, such as the United States and China, as well as the European Union, as the chief representative of its 28-country voting bloc in the WTO. Conversations with trade diplomats suggest that there are two complementary reasons for the lack of large country chairmanships. First, the GC is evidently mindful of the political danger of appointing chairs of major committees from large countries, due to other countries' fears that such chairpersons may not act as neutral parties and unduly influence the deliberations and outcomes.Footnote 14 At the same time, large countries seem to regard the neutrality provision for chairs as a constraint on their influence and bargaining power, which they prefer to exercise within the committee system without formal restriction. In other words, large countries may see chairmanships on key committees as undesirable, to the extent that their influence on the outcome may be greater if they can assert their negotiating positions more forcefully and freely behind the scenes, or directly with the D-G.
Unobserved factors in chair appointments In considering candidates, the GC can also be expected to consider special personal attributes of potential chairpersons, such as leadership, personality, and the ability of the candidate to command respect among fellow trade diplomats that may not be linked to mission size or other national delegation attributes. With the exception of documented previous committee chair appointments, which enter the probit models in the time series data, such individual attributes remain unobserved in the regressions. Political considerations in chair appointments, which may override human capital considerations, also remain largely unobserved.Footnote 15 In view of the presumed importance of diversity in national representation among committee chairs, particularly talented candidates from poorer, or otherwise under-represented countries, for example, would be especially attractive to the GC. Such appointments may therefore be due to observed human capital factors associated with mission size or other national attributes, previous chair appointments (in the probit regressions), or unobserved human capital, personal or political characteristics. Dummy variables for EM countries, for least developed countries, and for developing countries in general are included to test the hypothesis that these groups of countries receive greater or fewer chair appointments, independent of their mission size, GATT/WTO experience, and economic indicators.
Developing country discontent as a possible determinant of chair representation
Concerns with the balance of representation in WTO decision making emerged shortly after the founding of the WTO. Disappointment among developing countries in the results of the Uruguay Round regarding back-loaded textiles liberalization, intellectual property compliance costs, and limited progress in agriculture liberalization raised objections to the entire system of WTO governance, and, by implication, the alleged use of committee chairs to promote developed country agendas.Footnote 16 The issue of representation continued to fester as a result of the use of ‘green room’ meetings at critical negotiating junctures, from which many developing countries would inevitably be excluded. This issue boiled over in the 1999 WTO Seattle Ministerial, where selective green room deliberations excluded many developing countries. The representation issue arose again in the 2003 Cancun Ministerial, when many developing countries, dissatisfied with what they regarded as a rich-country-driven negotiating agenda, joined a large ‘blocking’ coalition, which contributed to the first of several major breakdowns in the Doha Round.
The backlash from developing countries at the Seattle Ministerial prompted the new D-G at the time, Michael Moore, to establish more inclusiveness in green room meetings, and communication between attendees and those outside the meeting. Subsequently, the D-G has managed the list of invited members to WTO green room meetings very carefully, so that informal coalitions of WTO members would be represented and share information with delegations not present at the meetings. Since then the green room controversy has receded significantly (see Patel, Reference Patel2007: 14–15). Yet the issue of inclusiveness has also raised the question of representation in all WTO committee meetings, a factor that the GC evidently observes carefully in selecting slates of committee chairs on an annual basis. In the early years of the Doha Round, developing country observers criticized WTO negotiating committee chairs in particular for alleged biases in favor of developed countries and for high-handed tactics to suppress developing country interests (see Jawara and Kwa, Reference Jawara and Kwa2004). The agreement of the WTO membership to a ‘Doha Development Round’ thus also implied an effort to ensure that developing country interests would be adequately represented during the negotiations and in the management of the WTO in general. This mandate presented the GC with the need to strike a delicate balance between overall WTO member representation and recognition of traditional experience and background attributes in considering candidates for chair positions. The human capital model, in contrast, predicts that small or non-existent delegations of most resource-poor developing countries will prevent them from achieving adequate representation to pursue their trade interests (see Michalopoulos, Reference Michalopoulos2001; VanGrasstek, Reference VanGrasstek2008; Laker, Reference Laker2013). At the same time, some developing country observers acknowledge that the nationality of a committee chair, in itself, is not generally decisive in whether developing or developed country interests will prevail in committee negotiations.Footnote 17 In order to explore the possibility of an ‘affirmative action’ chair appointment program in favor of developing countries, the probit model includes dummy variables to pick up any additional developing country chair appointments for post-1999 and post-2003 years in the sample, corresponding to the aftermath of the Seattle and Cancun debacles, respectively.
4. Aggregate trends and determinants of committee chairs
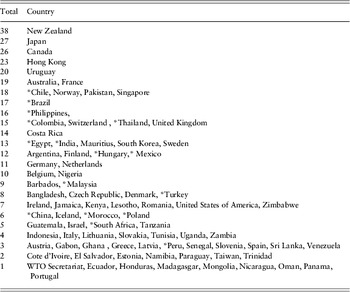
Each year from 1995 to 2011, the WTO GC announced the chairmanships of 25–46 committees operating under it and its subsidiary councils, and also periodically appointed chairs of Working Parties for WTO accession for countries negotiating membership. The most chair appointments occurred during the Doha Round, when additional negotiating committees were formed under the TNC. Table 1 summarizes the national distribution of WTO chairmanships appointed through this GC process over this time period.Footnote 18 The tally counts each chair appointment for each year for each committee, since the GC process is to appoint new chairs to each committee annually.Footnote 19 The exception is the set of Accession Working Parties, which meet on an irregular basis according to the stage of the accession negotiations, and whose activities typically span several years. Each of these chairmanships thus counts in the tally as a single appointment, regardless of how long the chair served (turnover is common for long accession negotiations). From 1995 to 2011, there were a total of 732 committee chair appointments, an average of nearly five per WTO member. The branch-and-stem breakdown of national representation of the chairs in Table 1 shows that a small number of countries accounted for most of the chairs, led by New Zealand, Japan, and Canada. Out of 152 WTO members included in the study, the 11 countries with the most chair appointments accounted for fully one-third of the total, and the top 23 countries accounted for 57% of the total. At the same time, 52% of the chairs came from developing countries, and developing country representation did increase slightly, year by year, during this period, as described below. It is noteworthy that the top trading nations in the world are not among the top recipients of chair appointments, with the exceptions of Japan (27) and France (19). As suggested by the GC's ‘large country’ rule (or the preferences of the large countries themselves), Germany, China, and the United States, the world's top three exporters, had relatively few chairs (although China's more recent 2001 accession reduced its opportunities for appointments). The United States has in fact had fewer chairs than Bangladesh and many other developing countries!
Total WTO chair appointments, by country, 1995–2011

Note: * indicates Emerging Market country (see Appendix for complete list).

Source: WTO, http://www.wto.org/english/thewto_e/secre_e/current_chairs_e.htm (accessed 27 July 2012).
Overall participation among the many developing countries in terms of committee chairmanships has been limited, although it increased over the period. In 1995, there were just 12 different developing countries with chairs among 25 total committee chair appointments. The number of developing countries represented in chairmanships increased steadily in subsequent years, peaking at 24 in 2009 (among 46 chair appointments), and then declined, along with the cutback in WTO chair activity as the Doha Round was suspended. Even so, 20 different developing countries chaired 20 out of 28 chairs in 2012, 71% of the total. It should also be noted, however, that 77% of the WTO membership consists of developing countries, and they are still under-represented in this regard. Most of the developing country chair appointments have gone to a relatively small number of EM countries, such as Chile, Brazil, Colombia, and Thailand.Footnote 20 Sixty-seven WTO members, nearly all of them developing countries, did not have any chairmanships at all during this period. Some of the imbalance can also be seen in the geographical distribution of chairs. Sub-Mediterranean Africa (10% of total) and Northern African/Middle Eastern countries (11%) are under-represented in comparison with Europe (28%), East Asia/Oceana (26%), and the Americas (24%).
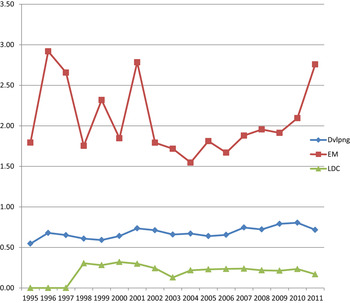
A closer look at the trend in representation among developing countries and among the regional groupings shows that some improvement in the balance of chair distribution took place over this period. Figure 1 tracks the year-to-year representation ratio of developing countries and of the subsets of EMs and least-developed countries (LDCs) from 1995 to 2011. The representation ratio is defined as the proportion of committee chair assignments for that group in a given year divided by the share of that group's membership in the WTO for that year. A representation ratio value of unity is therefore the benchmark for perfectly proportional representation for the group as a whole. Figure 1 shows that the overall developing country ratio has generally increased over the period, moving from 0.55 in 1995 to 0.72 in 2011. Many of the developing country chairmanships have been from a small group of 15 (out of 17) EM countries, whose representation ratios have ranged from 1.55 to 2.92 during this period. Very few chair appointments have gone to LDCs, which received their first chair appointment only in 1998; their representation ratio fluctuated between 0.13 and 0.32 for the rest of the period. Alternatively, it is also evident (see Web Appendix Table A) that in terms of trade shares in the world economy, developing countries are not under-represented.Footnote 21 They had greater than proportional representation by this measure, reaching a representation ratio peak of 3.14 in 1997 and declining since then, based largely on their increasing share of global exports, especially after China's 2001 accession. Clearly, given the currently low, if growing, capacity to trade among developing countries, along with the sensitivity of ‘big country’ representation on major committees, the GC is not going to rely on trade-weighted representation as a criterion in chair appointments.
WTO chairs developing, emerging markets and LDC representation ratios

The pattern of geographical representation has also revealed a trend towards increased balance; although countries' development status and economic interests are often not aligned along geographical lines (see the main Appendix for the geographical groupings). Despite strong year-to year fluctuations, it is noteworthy that average representation ratios over this time period for Europe, North Africa/Middle East, and the Americas have been close to unity, suggesting that GC chair appointments have sought a rough geographical balance for these areas over time.Footnote 22 The two outliers are East Asia/Oceana and Sub-Mediterranean Africa. The East Asia/Oceana region had disproportionately large representation (ratios well above 2.0) for most of the period. This group contains many EM countries and trade-oriented economies such as Japan, China, Hong Kong, Singapore, Thailand, Taiwan, the Philippines, South Korea, Australia, and New Zealand, all of which (except for China and Taiwan) are among the top WTO countries in terms of chair appointments. The mainly less developed group of Sub-Mediterranean Africa experienced increased ratios over the period, but always well below unity. This, the poorest of regions, clearly had the least chair representation.Footnote 23
4.1 Regressions using aggregate data
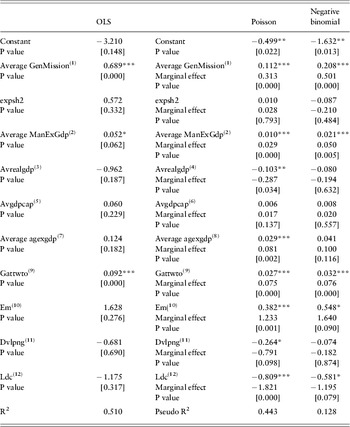
Taking the total number of chairs for each WTO country over this period as the dependent variable, and the simple averages of all explanatory variables during this time, Table 2 reports the selected and most representative results of various regressions on its determinants.Footnote 24 Complete results are available upon request. Three estimation methods are used. The presence of count data in the dependent variable suggests the appropriateness of testing Poisson (P) and negative binomial (NB) regressions, in addition to the Ordinary Least Squares (OLS) model.Footnote 25 In the P and NB regressions, the reported marginal effect for a variable shows the impact on the number of chairs of a one-unit increase in that variable above its mean, against the base of the fitted value using the mean of all tested independent variables. All estimation methods show the size of a country's Geneva mission (GenMis) and the number of years the country had been a GATT/WTO member to be highly significant determinants of the number of total chair appointments from 1995 to 2011. For example, an increase by one in GenMis is associated with an increase of 0.2 to 0.7 in the number of chairs, depending on the estimation method. When years of GATT/WTO membership increase by ten, chairs increase by 0.3 to 0.9. Results for the percentage of manufactures exports to GDP (ManExGdp) are also significant and positive, as is the EM dummy, showing an increase in the number of chairs for countries in that group by 0.4 to 0.5. In specifications not reported in Table 2, the marginal effect of the EM dummy can be as large as 0.7. The LDC Dummy is associated with a lower number of chairs for countries in that group by 0.6 to 0.8. An alternative regression (see Web Appendix B) includes a significant World Bank governance index as an explanatory variable, which tracks development status in a more continuous manner.Footnote 26 One apparently perverse result is the consistently negative coefficients for GDP. However, as noted in the earlier discussion, larger countries may be deliberately passed over in certain chair appointments (or they may resist such appointments). Another regression variant (results not reported in Table 2; available upon request), using the square of per capita GDP as an additional variable, shows in OLS and P regressions that increasing per capita GDP increases the number of chairs, but at a decreasing rate. Thus countries will continue to receive more chairs as their income rises, but this number will peak at a certain level and then decline.Footnote 27
Determinants of total number of chairs by country dependent variable: total chairs, 1995–2011 (n=152)

Notes: (1) Size of a country's Geneva mission, (2) percentage of manufactures exports to GDP, (3) average real GDP, $thousand billion, (4) average real GDP, (5) average GDP per capita, $thousand, (6) average GDP per capita, (7) agricultural exports-to-GDP ratio, (8) agricultural exports-to-GDP ratio, (9) years a country has been a GATT/WTO member, (10) emerging market dummy, (11) developing country dummy, (12) least developed country dummy.
Note: *P<0.1 significant at 10%, ** P<0.05 significant at 5%, *** P<0.01 significant at 1%.
In general, the results support the hypothesis that a country's WTO ‘capacity’, experience, and motivation for foreign market access for its manufactures positively influence the number of chair appointments it receives. These factors presumably make chair candidates from those countries both more attractive, and more eager to use their skills to promote trade liberalization. With regard to the dummy variables, or alternatively using the per capita GDP variables, it is not clear from the results whether EM candidates are ‘favored’ by the selection process because of their EM status, or if perhaps they systematically invest more effort and resources into developing attractive chair candidates because of inherent EM interests in trade. The same question could be asked in the opposite way regarding the negative coefficient for LDCs. A human capital argument for chair appointments gives more credence to the latter view, that EM economic and trade interests amplify efforts to develop chair candidates, while LDCs, more poorly positioned to gain from trade in general, devote systematically fewer resources to this end.Footnote 28
4.2 Probit regressions
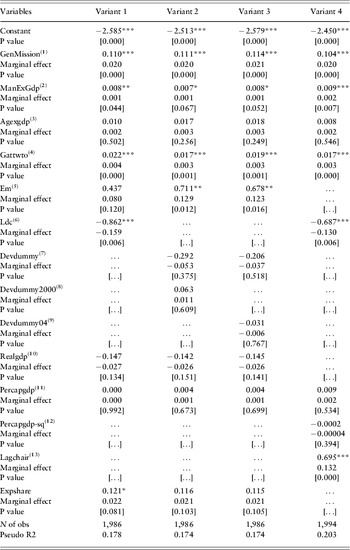
Additional detail regarding the determinants of chair appointments is possible if data can be arrayed to show how each country's attributes affect the probability that it will receive a chair appointment in a given year. Table 3 shows representative results from probit regressions using panel data, combining cross-section and time series data of WTO chair assignments. Complete results from various model specifications are available upon request. The dependent variable is a (0,1) outcome for country i in time period j, with the value ‘1’ representing at least one chair assignment for that country in that year, ‘0’ representing no chair assignment.Footnote 29 Results are reported in terms of the estimated coefficients, plus a secondary calculation of the ‘marginal effect’ of a change in the relevant variable by one unit, that is, the increased probability of receiving at least one chair assignment associated with a unit increase in the independent variable. The results thus reflect not only cross-country differences (as the aggregate data did), but also the inter-temporal changes for a given country over the time period. This modeling also allows testing of time shift dummies, to show the possible impact of events such as the Seattle (1999) and Cancun (2003) Ministerials on chair assignments, and the impact of a lagged dependent variable.Footnote 30
Panel probit: probability of WTO chair appointment (Dep. var.: Chair appointment by country by year (0/1))

Notes: (1) Size of a country's Geneva mission, (2) percentage of manufactures exports to GDP, (3) agricultural exports-to-GDP ratio, (4) years a country has been a GATT/WTO member, (5) emerging market dummy, (6) least developed country dummy, (7) developing country dummy, (8) dummies for post-Seattle, year 2000+, (9) dummies for post-Cancun, year 2004+, (10) real GDP, $thousand billion, (11) per capita GDP, $thousand, (12) per capita GDP squared, (13) previous year's chair outcome, 0 or 1.
*P <0.1 significant at 10%; ** P<0.05 significant at 5%; *** P<0.01 significant at 1%.
As suggested by the regression results in Table 2, results from the probit model in Table 3 also indicate that GenMission, GattWto, and ManExGdp increase the probability that the country will have at least one chair appointment in that year. For example, an increase by one staff member in a country's Geneva missionFootnote 31 increases the probability of its receiving a chair appointment by approximately 2%; an additional year as a member of the WTO increases this probability by 0.3% to 0.4%; and a one percentage point increase in its manufactures exports-to-GDP ratio increases the probability by 0.1% to 0.2%. EM countries have an 8% to 13% higher probability of receiving one or more chair appointments in a given year, while LDCs a 13% to 16% lower probability.Footnote 32 Coefficients for most other variables were usually insignificant. Notably, the dummies for post-Seattle (year 2000+) and post-Cancun (year 2004+), presenting the hypothesis that developing countries would experience a boost in chair appointments in the wake of these two crisis Ministerials, were not significant in any regression that included GenMission.Footnote 33 Finally, the LagChair variable, which introduces the previous year's chair outcome (0 or 1) as an independent variable for the following year, shows a strong positive and significant effect: a country that received a chair appointment in a given year has a 13% increased probability of receiving another chair appointment in the next year. The inclusion of LagChair also increases the statistical significance of other variables, notably AgExGDP, the country's agricultural exports-to-GDP ratio, and per capita GDP. Lagchair diminishes, however, the significance of the EM dummy, perhaps because it is picking up some of the repeat EM country appointments. Real GDP has a negative impact on the probability of a chair appointment, as larger countries tend to receive fewer chair appointments, as indicated above in Table 2. Thus the panel data lend added support to the hypothesis that capacity, experience in the WTO system, and motivation to seek improved foreign market access play significant roles in a country's tendency to receive chair assignments. In addition, the panel data indicate that the GC did not systematically change the distribution of chair appointments between developed and developing (or within developing) countries in the post-Seattle and post-Cancun periods. The most interesting new information from the panel data suggests that the GC tends to base its current appointment decisions in part on prior chair experience, either within the country, or by individuals under consideration.
4.3 Multiple appointments
The regression results suggest that the GC tends to appoint WTO chairs from member countries that exhibit sufficient capacity, experience with the GATT/WTO system, and motivation to take an active role in trade negotiations and the WTO administration. There is also evidence that the GC considers previous chair experience. At the same time, the pattern of chair appointments seems to balance representation between developed and developing countries, and that some attention is also paid to the geographical distribution of chair nationalities, even when many countries have never received a chair appointment. In general, nationality itself appears not to be as important a determinant as the country's group membership, based on development status and regional representation. Within these larger groupings of countries, outstanding candidates, based on their missions' human capital endowments and other national and personal factors, may give those countries particularly strong representation. The chair positions are important to the functioning of the WTO, and it is important to appoint the right person for the job, based at least in part on individual qualifications, including, for the most important chair positions, experience.Footnote 34
The pattern of appointments to chair the GC itself, along with chairs for its coequal committees, the Dispute Settlement Body (DSB) and the Trade Policy Review Body (TPRB), show how such decisions, made annually, tend to reveal a deliberate process of sequencing and ‘grooming’. Beginning in 1996, the preparation for appointment of the GC chair began with the candidate's preliminary service as chair of the DSB, or in one case (1998), the TPRB. There have been just a few exceptions to this rule, and it has now become embedded as a predictable preparation for service as GC chair. Many of these same chairs had also previously served on the Goods, Services, or TRIPS Councils, so that senior level chairs are groomed through experience chairing subsidiary committees. Yet these high-profile chair positions also have symbolic importance in reflecting the overall membership of the WTO. The nationalities of these chair appointments have been balanced exactly between developed and developing countries over the period 1995–2012, with 27 appointments for each group in the three main committees.Footnote 35 For the Goods, Services and TRIPS Councils, the balance was nearly even, with 27 developed and 33 developing country chairs. Geographically, representation was not proportional to membership, but an effort in achieving some balance is evident.Footnote 36 Further unwritten rules for chair appointments to these six major committees appear to include provisions that there will be no consecutive re-appointments to the same chair, and no appointments for the US or chief EU ambassadors.
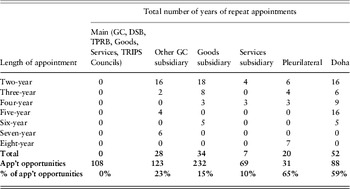
Chairs of other WTO committees, however, often serve consecutive terms. Table 4 shows the number of consecutive years served by committee chairs by committee category. As noted above, consecutive terms do not occur on the six main committees, but on subsidiary committees to the GC there were several multi-year consecutive term appointments. For the GC subsidiary committees (excluding the three Councils), Twenty-three per cent of annual chair appointments took the form of re-appointments from 1995 to 2012, while such re-appointments to the subsidiary committees of the Goods and Services Councils were 15% and 10%, respectively, of the total. Re-appointments to the two pleurilateral committees accounted for 65% of total appointments. For these chairs, specialized knowledge of the committee's focus, accumulated experience, and continuity may have more weight, and the fact that pleurilateral agreements have fewer signatories may also play a role in this pattern of re-appointments.
WTO committees: consecutive re-appointments, by committee type, 1995–2012

Source: WTO Committee chair tables.
Appointments to the Doha Round negotiating committees reflect the high value of continuity in the chair's position. The chair must bring all of his or her diplomatic skills to bear in the negotiations in order to move the committee towards consensus on the often contentious issues it faces, and the protracted nature of WTO negotiations typically requires longer periods of time for this task. Most chairs on Doha Round committees served two-year terms, but there were also numerous three-, four-, and five-year terms, and one six-year term. Overall, 59% of all chair appointments for these committees were consecutive re-appointments. While the number of chair appointments given to developing countries was greater (36 for developed, 55 for developing countries), the emphasis on continuity significantly reduced the geographical balance of the chairs. Counting each chair year separately, nine chairs came from Europe, five from sub-Mediterranean Africa, five from North Africa/Middle East, 38 from East Asia/Oceana, and 34 from the Americas. The two-year terms often tended to coincide with the Ministerial meeting cycle, when the membership (and the GC) could take stock of the progress on various negotiating issues and decide if new leadership was called for. The frustration of the Doha Round, which lurched from one crisis-induced stalemate to the next, probably increased the amount of turnover in these chair assignments.
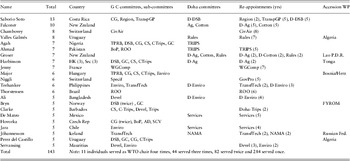
The selection of Doha negotiating committee chairs, with its presumed emphasis on the particular personal attributes needed to move the discussions towards consensus, focused on individuals, within the constraint of development status representation. There appears to be a strong reliance on multiple and consecutive appointments for other committees as well. Of the 443 individuals identified as WTO committee chairs during the period 1995–2011, 284 served just once, and 159 served multiple times. Table 5 lists 22 trade officials who have each served five or more times as WTO chairs. This group, representing about 5% of individuals who have served as WTO chairs during this period, has filled about 20% of the chair assignments. Eight are from developed, 14 from developing, countries. Many of these individuals chaired Doha committees and prominent standing committees, as well as the Working Parties on Accession. The GC, in its chair appointments, thus attains its goals of development status balance, and, in most cases, geographical balance, in part through multiple appointments of individuals from a relatively small number of countries, a process that also serves to increase the experience and quality of chairs for more important positions later.
WTO Chairmanships: those serving five times or more, 1995–2011

Legend: AD – Committee on Anti-Dumping; BoP – Committee on Balance-of-Payments Restrictions; CG – Council for Trade in Goods; CivAir – Committee on Trade in Civil Aircraft; Cotton – Sub-Committee on Cotton; CS – Council for Trade in Services; CTrips – Council for Trade-Related Intellectual Property; D-Ag – Special Session of the Committee on Agriculture; D-DSB – Special Session of the Dispute Settlement Body; D-Enviro – Special Session of the Committee on Trade and Environnment; Devel – Committee on Trade and Development; DSB – Dispute Settlement Body; Enviro – Committee on Trade and Environment; GC – General Council; GovPro – Committee on Government Procurement; NAMA – Negotiating Group on Market Access; Region – Committee on Regional Trade Agreements; ROO – Committee on Rules of Origin; Rules – Negotiating Group on Rules; SCV – Committee on Subsidies and Countervailing Measures; Services – Special Session of the Council for Trade in Services; Specif; Committee on Specific Commitments; TranspGP – Working Group on Transparency in Government Procurement; TPRM – Trade Policy Review Body; TransfTech – Working Group on Trade and Transfer of Technology; TRIPS – Special Session of the Council for TRIPS; WGComp – Working Group on Trade and Competition Policy.
Source: WTO Committee Chair Tables.
5. Summary and implications
The GC decided on hundreds of WTO chair appointments from 1995 to 2011, and in the absence of any documentation of the deliberations on the appointments, the statistical record provides indirect but substantial evidence that there are two basic elements to the decision: first, the quality and ability of a country's candidates to carry out a particular committee's chair functions, and, second, achieving balance in representation, primarily between developed and developing countries, but also, over time, in membership geography. The quality of a country's candidates, in turn, depends in part on the total and individual ‘human capital’ embodied in that country's candidates. A country's mission size appears to capture at least some of this information, as larger missions can simultaneously support chair activities by a staff member. Larger missions may also indicate higher quality among the country's chair candidates. Other indicators of human capital endowment include years of GATT/WTO membership and the importance of trade in GDP. The results suggest that EM countries, in particular, have an incentive to build the human capital foundations for WTO leadership, leading to a large share of chair appointments. LDC countries, in contrast, have low capacity for WTO leadership and a correspondingly low number of chair appointments, although this number is growing. Finally, individuals' personal attributes, presumably based on unobserved individual background, training, and leadership skills, and on observed prior WTO chair experience at the country level, enhance the candidate's attractiveness for a chair appointment. Multiple and repeat appointments of individuals are common. Political and other unobserved factors are presumably also involved in many choices in filling chair positions.Footnote 37 Further research is required to identify the detailed choice criteria, based on the individual qualifications of candidates under consideration, and the political and other criteria that enter the GC's decision making process. One additional pattern of note is the fact that large countries, such as the United States, China, and Germany, receive very few chair appointments, due in part to GC efforts to avoid giving leadership positions to WTO players that are already powerful, in part to the large countries themselves eschewing positions requiring neutrality, when they can better pursue their interests behind the scenes.
The WTO's effectiveness in pursuing its mandate depends on concluding and managing multilateral agreements while maintaining legitimacy in its system of decision making and governance. The GC appears in this regard to have struck the necessary balance between meritocracy and broad representation in its selection of committee chairs.Footnote 38 These criteria have allowed the leadership profile in terms of country representation to evolve over the years, with increasing representation from developing countries based on their increasing engagement in the trading system, experience in the WTO system, and investment in their Geneva missions. There is no evidence, on the other hand, that the GC systematically favored (or disfavored) developing countries in chair appointments in response to the rocky Seattle and Cancun Ministerials. Many EM countries, both large (India, Brazil) and small (Chile, Colombia, Thailand, and others), have had particularly strong representation as chairs, which corresponds to the strong stakes they have in trade liberalization and the WTO's rules-based system. This motivation and the evolution of committee chair appointments is as it should be, since the need for forward momentum in trade liberalization requires leadership not only from the large traditional trading powers, but also from those whose more rapid economic growth and development depend on global trade. While many developing countries still have inadequate resources to achieve representation in the form of committee chairs, the growing importance of coalitions in the WTO provides a new avenue of representation for them, which benefits from the growing participation of several developing countries in leadership roles.
Additional research on the Doha negotiations, including testimony from the negotiators, will be required to determine how, if at all, the choice of critical committee chairs affected progress in the Doha Round. However, the growing diversity of the WTO's membership and the changing structure of influence in the organization present serious challenges that cannot be addressed solely by the quality of chair appointments. The increasing importance in recent years of a relatively small number of EM and other developing countries has left other developing countries resentful of being snubbed in chair appointments.Footnote 39 This study has also noted the fact that most developing countries have never received a chair appointment. This tension is likely to continue as long as the appointment authority remains centralized in the GC, human capital endowments remain unevenly distributed among WTO members, even among developing countries, and political factors play a role in appointment decisions. It will abate to the extent that developing countries in general enhance their investment in WTO-oriented human capital, and WTO leadership from both developed and developing countries finds common ground in the pursuit of trade liberalization. The limited but significant accomplishments of the Bali agreement, under the new D-G, Roberto Azevêdo, provide hope for future agreements. In the meantime, the divergence of negotiating positions between developed and developing countries will limit the ability of committee chairs to forge consensus in large multilateral negotiations. Changes in the balance of power in the WTO, which has moved from the Old Quad countries (US, EU, Canada, Japan) to new configurations that include Brazil and India have, in view of the greater divergence in negotiating positions among major players, hampered the ability of the D-G, and the committee chairs in general, to forge consensus.Footnote 40 Positions on agriculture and services have been too far apart to reconcile through traditional D-G and committee chair efforts. Yet this situation may also improve as imports grow in EM and other developing countries, which will enhance their bargaining power in multilateral negotiations, and as OECD countries adapt more fully to the changing balance of power in the WTO. A broader range of countries that are thereby motivated to make investments in WTO representation and leadership capacity will ideally lead to a greater tendency to discover and bargain for mutual gains from trade.
The human capital model also implies possible new developments in the way that trade negotiations are conducted. The technical expertise that has been developed especially in several subsidiary bodies of the Councils for Trade in Goods and Trade in Services could serve as a resource, not only of ideas and information for future negotiations, but also as venues for deliberations on new issues as well. This would be a new approach to the negotiating process, and it may provide a direct way to explore paths for reform and compromise, led by those with the most knowledge on the subjects. One former WTO trade official from a developing country has suggested that the system of traditional trade negotiations and summitry by senior trade officials is no longer capable of identifying the best pathways for consensus on the increasingly technical issues of contemporary trade relations.Footnote 41 An ‘inversion’ of committee leadership in the negotiations, with standing committees leading the negotiating groups, would allow for a more informed ongoing discussion of some of the critical issues. An additional suggestion would be to follow several discrete paths to consensus on individual issues, allowing ‘rolling’ negotiations in specific committees to lead to a series of separate agreements. Institutionally, such an arrangement may in fact make it easier for experts, through the WTO committees, to identify common ground on policy space in new and controversial areas of negotiation.
Perhaps the most important implication of the human capital model is that it signals a warning to WTO members regarding the future of the organization. The results are consistent with the proposition that member countries invest in the quality of their delegations in part according to the value they derive from the benefits of WTO rules and trade liberalization. If the WTO were to become an ineffectual backwater for trade liberalization, its value could diminish and lead to members to deploy their trade diplomacy talent elsewhere. The implementation and dispute settlement functions of the WTO, to be sure, have remained strong and enjoy widespread support, but a failure of the trade negotiating function could eventually undermine these functions through the obsolescence of existing rules and global market access arrangements. Trade organizations, like the negotiations they sponsor, need to keep moving forward, lest they stagnate and succumb to entropy. Continued investments in trade diplomacy at the WTO by both developed and developing countries are therefore required in order to maintain the organization's ability to negotiate future multilateral trade agreements.
Appendix: Rosters of country groupings
Groupings by development status
Developed country WTO members (35): Australia, Austria, Belgium, Canada, Cyprus, Czech Republic, Denmark, Estonia, Finland, France, Germany, Greece, Hong Kong, Iceland, Ireland, Israel, Italy, Japan, Lichtenstein, Luxembourg, Malta, Netherlands, New Zealand, Norway, Portugal, Singapore, Slovakia, Slovenia, South Korea, Spain, Sweden, Switzerland, Taiwan, United Kingdom, United States.
Developing country WTO members (117): Albania, Angola, Antigua and Barbuda, Argentina, Armenia, Azerbaijan, Bahrain, Bangladesh, Barbados, Belize, Benin, Bolivia, Botswana, Brazil, Brunei, Bulgaria Burkina Faso, Burma (Myanmar), Burundi, Cambodia, Cameroon, Cape Verde, Central African Republic, Chad, China, Colombia, Democratic Republic of Congo, Republic of the Congo, Costa Rica, Cote d'Ivoire, Croatia, Cuba, Djibouti, Dominica, Dominican Republic, Ecuador, Egypt, El Salvador, Fiji, Gabon, The Gambia, Georgia, Ghana, Grenada, Guatemala, Guinea, Guinea-Bissau, Guyana, Haiti, Honduras, Hungary, India, Indonesia, Jamaica, Jordan, Kenya, Kuwait, Kyrgyzstan, Latvia, Lesotho, Lithuania, Macao, Macedonia, Madagascar, Malawi, Malaysia, Maldives, Mali, Mauritania, Mauritius, Mexico, Moldova, Mongolia, Morocco, Mozambique, Namibia, Nepal, Nicaragua, Niger, Nigeria, Oman, Pakistan, Panama, Papua New Guinea, Paraguay, Peru, Philippines, Poland, Qatar, Romania, Rwanda, Saint Kitts and Nevis, Saint Lucia, Saint Vincent and the Grenadines. Saudi Arabia, Senegal, Sierra Leone, Solomon Islands, South Africa, Sri Lanka, Suriname, Swaziland, Tanzania, Thailand, Togo, Tonga, Trinidad and Tobago, Tunisia, Turkey, Uganda, Ukraine, United Arab Emirates, Uruguay, Venezuela, Vietnam, Zambia, Zimbabwe.
Emerging market WTO members (17): Brazil, Chile, China, Colombia, Egypt, Hungary, India, Indonesia, Malaysia, Mexico, Morocco, Peru, Philippines, Poland, South Africa, Thailand, Turkey.
Least developed country (LDC) WTO members (31): Angola, Bangladesh, Benin, Burkina Faso, Burundi, Cambodia, Central African Republic, Chad, Democratic Republic of Congo, Djibouti, Gambia, Guinea, Guinea Bissau, Haiti, Lesotho, Madagascar, Malawi, Mali, Mauritania, Mozambique, Myanmar, Nepal, Niger, Rwanda, Senegal, Sierra Leone, Solomon Islands, Tanzania, Togo, Uganda, Zambia.
WTO geographical country groups
Europe (37): Albania, Austria, Belgium, Bulgaria, Croatia, Cyprus, Czech Republic, Denmark, Estonia, Finland, France, Germany, Greece, Hungary, Iceland, Ireland, Italy, Latvia, Liechtenstein, Lithuania, Luxembourg, Macedonia, Netherlands, Norway, Poland, Portugal, Slovakia, Slovenia, Spain, Sweden, Switzerland, Turkey, United Kingdom, Malta, Moldova, Romania, Ukraine.
Africa (Sub-Mediterranean) (40): Angola, Benin, Botswana, Burkina Faso, Burundi, Cameroon, Cape Verde, Central African Republic, Chad, Congo, Cote d'Ivoire, Democratic Republic of the Congo, Djibouti, Gabon, Gambia, Ghana, Guinea, Guinea-Bissau, Kenya, Lesotho, Madagascar, Malawi, Mali, Mauritania, Mauritius, Mozambique, Namibia, Niger, Nigeria, Rwanda, Saudi Arabia, Senegal, Sierra Leone, South Africa, Swaziland, Tanzania, Togo, Uganda, Zambia, Zimbabwe.
Middle East/Northern Africa (19): Armenia, Bahrain, Bangladesh, Egypt, Georgia, India, Israel, Jordan, Kuwait, Kyrgyzstan, Maldives, Morocco, Nepal, Oman, Pakistan, Qatar, Sri Lanka, Tunisia, United Arab Emirates.
East Asia/Oceana (22): Australia, Brunei, Cambodia, China, Fiji, Hong Kong, Indonesia, Japan, Macao, Malaysia, Mongolia, Myanmar, New Zealand, Papua New Guinea, Philippines, Singapore, Solomon Islands, South Korea, Taiwan, Thailand, Tonga, Vietnam.
Americas (34): Antigua & Barbuda, Argentina, Barbados, Belize, Bolivia, Brazil, Canada, Chile, Colombia, Costa Rica, Cuba, Dominica, Dominican Republic, Ecuador, El Salvador, Grenada, Guatemala, Guyana, Haiti, Honduras, Jamaica, Mexico, Nicaragua, Panama, Paraguay, Peru, St. Kitts and Nevis, St. Lucia, St. Vincent and the Grenadines, Suriname, Trinidad and Tobago, United States of America, Uruguay, Venezuela.
Sources:
Developed (advanced) and developing countries: IMF listings, in IMF, World Economic Outlook 2012, available at http://www.imf.org/external/pubs/ft/weo/2012/01/pdf/text.pdf.
Emerging markets: Based on joint listing by six or more of the following nine analysts: next-11/BRIC, CIVETS, FTSE, MSCI, The Economist, S&P, Dow-Jones, BBVA and Columbia University EMGP. These lists are compiled in the Wikipedia entry at en.wikipedia.org/wiki/Emerging_markets. Of countries meeting this criterion, Taiwan was excluded, as it is now listed by the IMF as a developed country.
Least-Developed Country WTO Members: www.wto.org/english/thewto_e/whatis_e/tif_e/org7_e.htm.
WTO Geographical Groups: Author's designation