INTRODUCTION
In animals, nematode parasites cause massive economic loss and welfare issues but in humans they depress growth and learning at school in children, they reduce work productivity in adults and help to maintain poverty. Control of these infections relies on regular chemotherapy but drug resistance is a major concern in animals (Kaplan, Reference Kaplan2004) and is emerging in humans (Albonico et al. Reference Albonico, Wright, Ramsan, Haji, Taylor, Savioli and Bickle2005). Early detection of drug resistance is necessary for limiting its spread. Although some molecular methods are available for detecting a changed genotype associated with resistance (Schwenkenbecher et al. Reference Schwenkenbecher, Albonico, Bickle and Kaplan2007; Diawara et al. Reference Diawara, Drake, Suswillo, Kihara, Bundy, Scott, Halpenny, Stothart and Pritchard2009), detection of resistance in nematode parasites is mainly based on detecting a changed phenotype. Many classes of anthelmintics (haloxon, levamisole, monepantel, derquantel, ivermectin and piperazine) act on the neuromuscular system of nematodes to inhibit locomotion (Martin, Reference Martin1997; Martin et al. Reference Martin, Bai, Clark and Robertson2003). Drug resistance may be associated with changes in the phenotype of this locomotion because signalling-muscle-contraction pathways are affected. In this paper, we describe a method for characterizing the movement phenotype of larvae of parasitic nematodes by quantitative measurement of their locomotion in microfluidic chambers. We show that phenotype varies with parasite isolates and that the movement phenotype is detectably different in a drug-resistant isolate.
Most nematodes rely on side-to-side sinusoidal movement to ‘swim’ over solid surfaces. Their mechanism of locomotion has intrigued researchers for several decades and inspired a number of quantitative models to explain the nature of undulatory motion (Gray, Reference Gray1953; Gray and Lissmann, Reference Gray and Lissmann1964; McNeal, Reference McNeal, Lee and 2002; Lockery et al. Reference Lockery, Lawton, Doll, Faumont and Coulthard2008). In the model nematode, C. elegans, locomotion experiments have often been performed on agar plates where C. elegans uses the surface tension of a thin surface water film and its internal hydrostatic pressure to generate the forward motion force (Pierce-Shimomura et al. Reference Pierce-Shimomura, Morse and Lockery1999; Ryu and Samuel, Reference Ryu and Samuel2002; Gray et al. Reference Gray, Karow, Lu, Chang, Chang, Ellis, Marletta and Bargmann2004). The oscillatory movement of the head is propagated backwards along the rest of the body as sinusoidal waves (McNeal, Reference McNeal, Lee and 2002; Gray et al. Reference Gray, Hill and Bargmann2005). Recently, microfluidics technology has enabled the fabrication of a new class of devices such as micro-chambers, mazes, wave sampler, and cylindrical posts to study worm behaviour (Whitesides, Reference Whitesides2006; Hulme et al. Reference Hulme, Shevkoplyas, Apfeld, Fontana and Whitesides2007; Qin and Wheeler, Reference Qin and Wheeler2007; Rohde et al. Reference Rohde, Zeng, Gonzalez-Rubio, Angel and Yanik2007; Lockery et al. Reference Lockery, Lawton, Doll, Faumont and Coulthard2008). Amongst other benefits, microfluidics technology offers experimental resolution at the microscale level, thereby allowing the experimentalist to observe, track, and characterize locomotion of a single worm over time (Whitesides, Reference Whitesides2006). On-chip immobilization of nematodes on microfluidic devices with high-resolution imaging of its neurons and other cellular activity has also generated great interest in the neuroscience community (Kerr et al. Reference Kerr, Lev-Ram, Baird, Vincent, Tsien and Schafer2000; Nagel et al. Reference Nagel, Brauner, Liewald, Adeishvili, Bamberg and Gottschalk2005; Heng et al. Reference Heng, Erickson, Baugh, Yaqoob, Sternberg, Psaltis and Yang2006; Hulme et al. Reference Hulme, Shevkoplyas, Apfeld, Fontana and Whitesides2007).
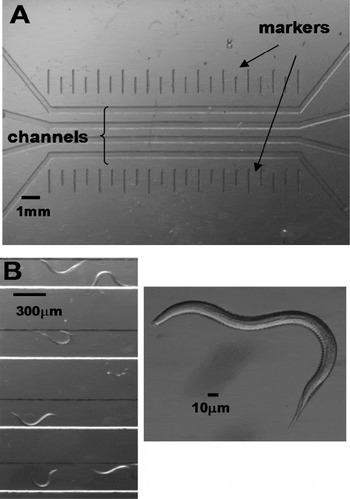
In this paper, we extend the application of microfluidics technology to the study of parasitic nematodes and to demonstrate differences in nematode phenotype. More importantly, the approach can distinguish different isolates, levamisole–sensitive and –resistant, of the same species. We designed and fabricated microfluidic bioassays to record and characterize the undulatory movement of larvae of the pig parasite Oesophagostomum dentatum (Fig. 1A and B). Two isolates of O. dentatum were tested: levamisole-sensitive (SENS), which are sensitive to the cholinergic anthelmintic levamisole and levamisole-resistant (LEVR) which are resistant to levamisole at therapeutic doses (Martin et al. Reference Martin, Bai, Clark and Robertson2003). The parameters under study were the velocity of forward migration, amplitude and wavelength of the sinusoidal motion, and the frequency of side-to-side swimming action of the nematodes. We observed clear differences between SENS and LEVR O. dentatum larvae allowing the drug-resistant phenotype to be recognized in the absence of the anthelmintic. We characterized the anthelmintic dose response for SENS and LEVR isolates and noticed differences in the degree of their drug resistance.
Microfluidic chamber and larvae. (A) The four-channel microfluidic device fabricated to study nematode locomotion. There are vertical markers to help calibrate the forward velocity. (B) Illustrations of a section of the microfluidic device during a representative experiment. Here, 2 isolates of Oesophagostomum dentatum (SENS and LEVR) are put in alternating channels and videos were recorded for data analysis. On the right, we show a picture of the organism used in our experiments: O. dentatum.

MATERIALS AND METHODS
Fabrication of microfluidic devices
The microfluidic bioassays were designed to have 4 straight, parallel channels (width=300 μm, length= 1 cm, height=40 μm), each with its individual input and output ports. The device dimensions can be easily altered at the design stage to be adapted to the selected species of nematodes under test, here O. dentatum. The fabrication was made using standard micromachining and soft lithography procedures (Sia and Whitesides, Reference Sia and Whitesides2003). The mask layout was drawn in Adobe Photoshop and sent to an outside vendor (Photoplotstore, Colorado Springs, CO, USA) to generate the masks. A 40 μm-thick SU-8 photoresist (Microchem Corporation, Newton, MA, USA) was cast on a bare silicon wafer by spin coating (∼2800 rpm). Standard photolithography was carried out to create the final SU-8 master mould. The PDMS prepolymer (Sylgard 184 Silicone Elastomer Kit, Dow Corning Corporation, Midland, MI) was cast over the SU-8 mould and cured on a hot plate at 70°C for 2 h. Subsequently, the PDMS microfluidic devices were peeled off the mould and input/output ports (2 mm diameter) were created using a sharp needle. Air plasma was exposed to the PDMS devices, which are then bonded to individual glass cover-slips. The fabricated microfluidic bioassay is shown in Fig. 1A and B, along with a recorded picture of the nematodes moving through the sealed channels.
Sample preparation
A 1% agar (Fisher Scientific) solution in water was prepared. The mixture was put on a hot plate at 100 °C and stirred for 1 h. The molten agar was allowed to cool down to 37°C in a warm water bath and 0·36 μl of agar was pipetted and filled in each of the 4 channels of the microfluidic bioassay. Care was taken to ensure that input ports of the channels are not completely filled with agar or else, after a brief time (2 min), the excess gel-like agar was scooped and cleared out of the input ports. A small volume (1 ml) of nematodes was pipetted and centrifuged to increase the concentration of the worms (100/ml). The nematodes were then added to the agar and allowed to accommodate at 37°C for 10 min. Syringes were connected to the input ports of the microfluidic bioassay using rubber tubing. Subsequently, the agar gel mixed with nematodes was filled into the input ports of the 4 channels. After 5–15 min (the scouting time), the nematodes were seen entering the channels from the input ports and moving through the channel towards the output ports.
Oesophagostomum dentatum larvae
Levamisole-sensitive (SENS) and levamisole-resistant (LEVR) O. dentatum were originally supplied by the Royal Veterinary and Agricultural School, Frederiksberg, Copenhagen and then reproduced at 6–9 month intervals by passage in pigs at Iowa State University, Ames, Iowa. The LEVR was derived from SENS in the laboratory by using increasing doses of levamisole for selection and repeated passage. The L 3 larvae isolates were maintained between passages in tap water refrigerated at 11°C (changed every 2–4 months). LEVR-infected hogs were treated orally with 8 mg/kg body weight to maintain the selection pressure before collection of eggs and preparation of larvae. The SENS L 3 were 6 months old and the LEVR L 3 were 5 months old when used for our experiments. The larvae were stored at 14°C in tap water that was replaced at least every 3 months.
Data capture and analysis
The nematodes were observed with a Leica MZ16 transmission stereomicroscope using magnifications from 7·1× to 230×. A QICAM 12-bit Mono Fast 1394 Cooled digital camera interfaces with a QCapture PRO software for capturing individual digital images and digital image sequences. Digital image sequences of nematode movement were recorded at 1 sec time-intervals with a resolution of 1392×1040 pixels and saved in uncompressed .avi video format. These videos were later imported into MATLAB where individual frames are analysed. An actual distance to pixel distance ratio was created by measuring the pixel width of a channel of known width using the MATLAB Image Toolbox. This ratio was used to translate pixel measurements to actual distance for the calculation of nematode velocity, amplitude, and wavelength. The MATLAB Image Toolbox was use to measure pixel distance and was able to accommodate the angle and direction of nematode movement.
Calculation of locomotion parameters
Nematodes with unimpeded forward propagation exhibit a consistent velocity over distances much longer than their body length. Worm average velocity was defined as the continuous forward linear distance travelled by a worm's head with respect to time. In our experiments, average velocity over a length of the channel was measured by obtaining the total number of pixels travelled by the head of a nematode between a certain number of image frames (minimum 20) taken at 1 sec time-intervals. The total number of pixels traversed between the beginning and the end frames was calculated using QCapture PRO software and translated to an actual distance using the previously mentioned ratio. This distance was then divided by the total number of frames between the beginning and end measurement positions to obtain an average velocity in μm s−1.
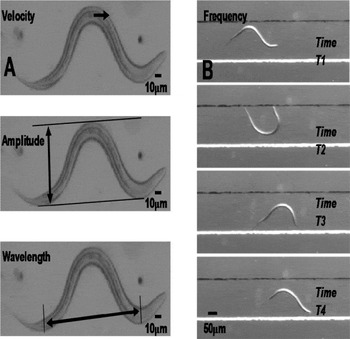
Besides the average velocity, we measured parameters related to the sinusoidal body shape of nematodes during forward locomotion. The amplitude (A) was measured from latitudinal peak to peak, while wavelength (λ) was measured from longitudinal peak to peak (Fig. 2A). The pixel distances of these attributes were measured using the MATLAB Image Toolbox. Pixel distance was converted to actual distance in the units of micrometers using the previously mentioned ratio. The oscillation frequency was calculated as the reciprocal of the total time needed for a given worm to return to its original state of sinusoidal pattern. A pictorial representation of the oscillation frequency is shown in Fig. 2B.
Measurement of locomotion parameters. (A) Illustrations of the SENS larvae for measurement of the velocity (V), amplitude (A), and wavelength (λ) from the recorded videos. Individual images were separately analysed from a video and a MATLAB program was used to accurately measure the parameters with a resolution of 0·1 mm. (B) A fourth parameter, oscillation frequency, was calculated as the reciprocal of the total time-period needed by a nematode to complete one sinusoidal wave motion. The figure shows a series of time-lapsed images of the larvae as it moved along the agar-filled channel and the time-period periods separating T1, T2, T3 and T4 is 2 sec.

These measurements of body parameters were only performed on worms that were normal to the viewing plane and clearly exhibit forward movement uninhibited by foreign objects. We ignored image frame sequences where the worm under observation touched other worms, the sidewalls of the channel or any foreign particulates during its movement. This prevented distortion of their natural amplitudes and wavelengths and gave true information of their body parameters. Furthermore, care was taken to use a small concentration of worms (∼100/ml) in each channel so the chances of observing uninhibited forward movement of nematodes in the microfluidic bioassay increase.
Statistical analysis
Unpaired t-tests were used to estimate statistical significance. Graph Pad V. 5.0 (GraphPad, San Diego, CA, USA) was used to carry out these tests.
RESULTS
Amplitude measurements
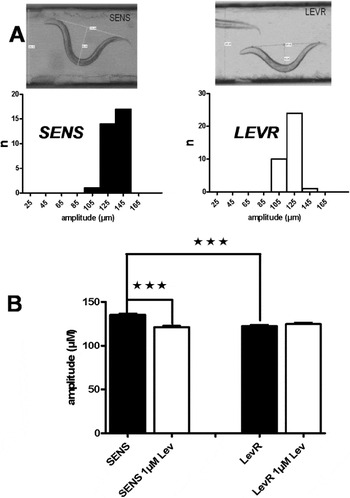
When we examined the amplitudes of the waves of contraction, we found differences between the nematode isolates. Fig. 3A shows examples of the amplitude observed with sheathed SENS and LEVR isolates of O. dentatum. Also shown are the distributions of SENS and LEVR amplitudes. SENS had an amplitude of 135·2±1·7 μm (mean,±s.e., n=32) which was significantly (P<0·001) larger than LEVR (122·5±1·8 μm, mean,±s.e., n=35).
Amplitude measurements. (A) Top: 2 images of SENS and LEVR Oesophagostomum dentatum. Below: Amplitude histogram for SENS and LEVR O. dentatum with no drug. (B) Bar charts of mean±s.e amplitudes for SENS and LEVR larvae with and without exposure to 1 mm levamisole. Significant differences, P<0·0001 (***).

When we measured amplitude of the SENS and LEVR isolates in the presence of 1 μ m levamisole, we found that there was a significant reduction in the amplitude of SENS (reduced to 121·3±1·9 μm, n=38, P<0·001) but not in LEVR (124·8±1·9 μm, n=27, P=0·39, Fig. 3B). A concentration of 1 μ m levamisole reduced the amplitude of SENS by 10·3% but the LEVR amplitude did not decrease.
Wavelength measurements
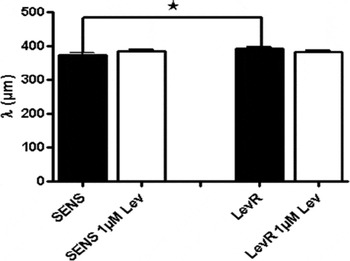
SENS had a mean wavelength of 372·9 μm ± 7·1 μm (mean,±s.e., n=32) and LEVR had a mean wavelength of 393·1±4·6 μm (mean,±s.e., n=35) which was significantly different (P=0·019), Fig. 4. A concentration of 1 μ m levamisole did not have a statistically significant effect on the wavelengths of either of the isolates.
Bar chart of the mean±s.e. of wavelengths for SENS and LEVR Oesophagostomum dentatum larvae without any drug exposure, and SENS and LEVR O. dentatum larvae with 1 mm levamisole. The SENS wavelength was significantly (P<0·02,*) less than LEVR larvae in the absence of levamisole. Levamisole (1 μ m) did not have a significant effect on wavelength of either isolate.

Tangential force measurements
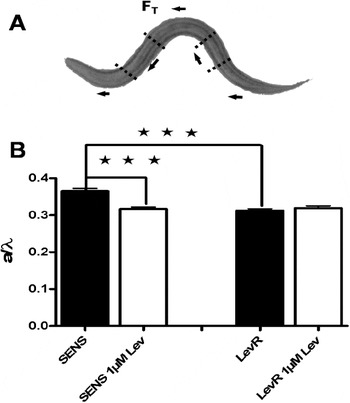
An interesting aspect of the nature of nematode locomotion involves the role of both amplitude and wavelength, which had initially motivated us to measure these body parameters. Gray (Reference Gray1953) found that the maximum forward tangential force exerted by a half-wave of the nematode body, F T, relates to its body parameters and reported a detailed theoretical analysis of undulatory motion. The normalized force F T/F o is expressed as (Gray, Reference Gray1953; Lockery et al. Reference Lockery, Lawton, Doll, Faumont and Coulthard2008):

in addition, is essentially proportional to A/λ. The normalization factor F o in equation (1) depends on parameters such as surface tension, frictional force, and coupling moment, which is assumed, unchanged in our experiments (Gray, Reference Gray1953). As shown in Fig. 5A, the body of a nematode can be viewed as different segments where each individual segment applies a tangential force F T for the forward propulsive motion. The above equation also implies that this tangential force increases with increase in amplitude and decrease in wavelength (Gray, Reference Gray1953). The data gathered for our amplitude and wavelength analysis were used to obtain a set of A/λ quotients.
Tangential forces and bar charts showing mean±s.e. values of A/λ of SENS and LEVR with and without 1 μ m levamisole. The tangential force, F T, is proportional to A/λ. (A) The tangential force F T exerted by each segment of the nematode's body results in its sinusoidal movement. (B) Bar charts of A/λ, the amplitude to wavelength ratios, are shown for SENS and LEVR without any levamisole and with 1 mm levamisole. The SENS larvae had a significantly (P<0·0001, ***) greater amplitude to wavelength ratio than LEVR larvae. A concentration of 1 μ m levamisole significantly reduced the SENS A/λ ratio but had no effect on LEVR.

The mean±s.e.A/λ quotient values of experiments on O. dentatum larvae are shown in Fig. 5B. The mean of A/λ quotients for the SENS isolate was 0·366±0·007 (mean±s.e., n=32), while that for the LEVR isolate was 0·313±0·005 (mean±s.e., n=35) which is significantly smaller (P<0·0001, unpaired t-test). After exposure to 1 μ m levamisole, the mean A/λ quotient of SENS isolate showed a 13% decrease to 0·317±0·005 (mean±s.e., n=38) whereas the LEVR isolate showed a 4·6% increase to 0·327± 0·006 (mean±s.e., n=27). The decrease in A/λ quotient for the SENS isolate was significant (P<0·001) while there was no statistically significant difference in the A/λ quotient for the LEVR isolate with 1 μ m drug exposure (P>0·05).
Following equation (1), the mean of the normalized tangential force for the SENS isolate was 2·49±0·05×10−3 (mean±s.e., n=32) while that for the LEVR isolate was significantly smaller (P<0·001), 2·27±0·03×10−3 (mean±s.e., n=35). After exposure to 1 μ m levamisole, the mean normalized force of the SENS isolate showed a 6·0% decrease to 2·34±0·04×10−3 (mean±s.e., n=38, P<0·02) whereas the LEVR isolate showed no significant change and was 2·36±0·04×10−3 (mean±s.e., n=27, P>0·05). The percentage changes in the mean normalized force among the O. dentatum isolates follow a similar trend to the percentage changes in their A/λ quotient values. This reiterates that the tangential force needed for the forward movement is directly proportional to the A/λ quotient and is an important locomotion parameter for segregating nematodes of different isolates and their response to drugs.
Examination of the A/λ and normalized tangential force results from the O. dentatum isolates leads to interesting implications. The significantly lower values for the LEVR isolate, compared to the SENS isolate, indicates that LEVR generates less forward locomotive force, and suggests that LEVR muscles produce less power. In the presence of levamisole, both the A/λ quotient and the normalized force values indicate that SENS muscles produced less force but the effect on LEVR muscles was not significant. This result is consistent with the larval migration studies (Martin et al. Reference Martin, Bai, Clark and Robertson2003) where SENS is inhibited more than LEVR by levamisole. We expect that the tangential force exerted by the different segments of the nematode body is proportional to the amount of muscle contraction actively generating forward movement. Since the cholinergic anthemintic levamisole affects body muscle contraction, it is not surprising that we have observed distinct differences in the locomotory parameters of SENS and LEVR O. dentatum larvae when exposed to levamisole.
Forward velocity measurements
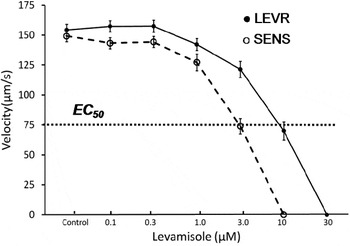
We compared the forward velocities of the O. dentatum larvae with increasing concentrations of levamisole, see Fig. 6. In the absence of levamisole, the SENS isolate had a velocity of 149·25±6 μm s−1 (mean±s.e., n=31). LEVR had a velocity of 143±4 μm s−1 (mean±s.e., n=37). The velocities of both SENS and LEVR larvae were each measured on the same 3 days. There was no statistically significant difference between the velocities of SENS and LEVR isolates in the absence of levamisole.
Velocity measurements. The measured forward velocity for SENS (dotted) and LEVR (solid) Oesophagostomum dentatum are plotted against the increasing concentration of levamisole. At concentrations higher than 1 μ m, the velocity of SENS decreases more rapidly than does that of LEVR. Line fitted by linear interpolation between points. The EC 50 for SENS isolate was 3 μ m while the EC 50 for the LEVR isolate was 9 μ m.

Next, we tested the effect of different concentrations of levamisole on the SENS and LEVR O. dentatum larvae. We measured the forward velocity of SENS and LEVR isolates when exposed to levamisole. The velocities at various drug concentrations are plotted in Fig. 6. There was little decrease in velocity for either SENS or LEVR isolates at a levamisole concentration below 0·5 μ m. However, the SENS velocity drops clearly reduced with 1 μ m while a similar reduction in velocity for LEVR required a levamisole concentration of 3 μ m. The EC 50 for SENS isolate was 3 μ m and the EC 50 for LEVR isolate was 10 μ m (Fig. 6). Thus, we obtained a resistance ratio of 3 between the two isolates as measured from the forward velocities on the microfluidic device. From our previous migration studies (Martin et al. Reference Martin, Bai, Clark and Robertson2003), the SENS EC 50 was 26 μ m and the LEVR EC 50 was 114 μ m. This indicates that the microfluidic device has approximately a 10-fold better sensitivity compared to the migration assay (Martin et al. Reference Martin, Bai, Clark and Robertson2003), but the resistance ratio between SENS and LEVR is similar in both cases.
Oscillation frequency measurements
Oscillation frequency analysis was carried out to further test measurements of velocity and wavelength (Fig. 2B). As an additional and separate test, velocity data and wavelength data were collected independently from different videos. The predicted frequency for all nematode sets was estimated by dividing the mean velocity by mean wavelength. The observed frequency was determined by observing image frames, measuring the actual time taken by the nematode larvae to return to its original state (i.e. measure the time), and then taking the inverse of this time. We found that the predicted frequency values were close and not significantly different to the observed frequency values. Interestingly, these observations were consistent with a classical equation of physics (velocity=wavelength×frequency) and this equation was found to be valid when describing the undulatory movement of nematodes.
The O. dentatum SENS larvae had an observed mean frequency of 0·35±0·02 s−1 (mean±s.e., n=75) which was not significantly differently from the mean frequency of LEVR which was 0·38±0·02 s−1 (mean±s.e., n=75). However, 1 μ m levamisole reduced the frequency of SENS by 23% to 0·27± 0·02 s−1, n=25 (P<0·001) but produced little change in the LEVR isolate (0·35±0·02 s−1, P>0·1).
DISCUSSION
Here we present a microfluidic bioassay with parallel channels to observe and characterize nematode locomotion parameters. We demonstrate that these locomotion parameters are different for resistant and sensitive isolates within the same species: SENS and LEVR isolates of O. dentatum. Furthermore, we showed the use of this microfluidic device for observing drug effects on targeted nematode isolates with better sensitivity than current migration assays. Our approach is attractive because it allows us to run multiples of experiments (each in an individual channel) simultaneously and record the nematode movement from all the channels. The low cost of mass production of the device renders it disposable (Hu, Reference Hu, Ren, Bachman, Sims, Li and Allbritton2002) although it can be re-used multiple times.
The locomotion studies described in this paper can be conducted in channels filled with water or any suitable fluid. We preferred to use agar-filled channels for the following reasons. (a) Agar provides a better medium for the worms to push against as they crawl and propel themselves forward. In a fluid environment, the worms will swim and encounter slips as they move forward. As such, a solid agar medium would be closer to the natural soil habitat of these worms. (b) In microfluidic channels, it is difficult to maintain constant fluid pressure when both sides of the channel are exposed to air. In our initial experiments with water as a medium, the fluid pressure in the channel interfered with the natural movement of the nematodes. Such variation in fluid pressure is not a concern when using agar or other gel-like material as a medium in the channels.
Besides illustrating the difference in movement phenotype between two drug-sensitive and drug-resistant isolates, we think the usefulness of the microfluidic device also lies in drug testing. Currently, migration assays based on mesh structures are used to characterize the effect of a drug on nematodes (Martin et al. Reference Martin, Bai, Clark and Robertson2003). This testing is a slow process, requiring many nematodes for a single test and requiring higher concentrations of the drug. With the microfluidic bioassays presented here, the drug testing was done in parallel and each test was completed within 45–60 min. This time, does not include the extra time for data collection from the video and analysis; we are now developing data capture software and automatic analysis to speed this process. However, compared to the binary migrated/inhibited or hatch/not hatch measurements used in larval migration or egg hatch assays, we are able to measure the nematode velocity, wavelength, and amplitude in the microfluidic bioassay.
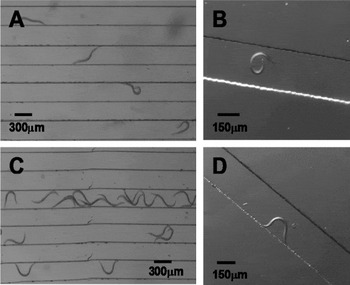
The drug sensitivity is also significantly improved. We have shown that the EC 50 for the O. dentatum larvae on the microfluidic bioassay is roughly 10 times smaller than that measured for O. dentatum larvae on the migration assays. However, with higher levamisole concentrations, the forward movement of the larvae in the micro-channels becomes more sluggish and discontinuous. Fig. 7 shows the upper limit of the levamisole dose that was useful for O. dentatum larvae in the microfluidic bioassay. At a concentration of 2·2 μ m levamisole, the SENS isolate lost some of its ability to make sinusoidal movements but LEVR retained this capacity. As shown in Fig. 6, the forward velocity can still be measured in and above this concentration of drug until the larvae is completely immobile. This drug concentration limit is reached at 10 μ m of levamisole for the SENS isolate and at 30 μ m for the LEVR isolate. We used a typical therapeutic dose of 8 mg/kg, given orally, to maintain selection of LEVR during passage of O. dentatum (see Materials and Methods section) through our pigs. A dose of 8 mg/kg following oral administration in hogs yields plasma concentrations of up to 7 μ m (De Baere et al. Reference De Baere, Cherlet, Croubels, Baert and De Backer2003). This concentration lies between the EC 50 (3 μ m) of SENS and the EC 50 (10 μ m) of LEVR and is consistent with the therapeutic effect of levamisole on SENS and its limited therapeutic effect on LEVR. The effect of levamisole on larval locomotory movements that we observed with our microfluidic assay technique at lower concentrations than with our larval migration inhibition assay (Martin et al. Reference Martin, Bai, Clark and Robertson2003) may then relate more closely to the therapeutically relevant effects on the adult worm.
Effect of higher concentrations of levamisole on the locomotion parameters of SENS and LEVR Oesophagostomum dendatum larvae. (A and B) A concentration of 3 μ m levamisole distorted the natural sinusoidal movement of SENS larvae slowing velocity, producing occasional curling and retraction from forward movement. (C and D) At 3 μ m levamisole had little effect on the sinusoidal movement of LEVR larvae and their locomotion parameters.

Other anthelmintic drug classes also affect locomotion: the macrocyclic lactones (ivermectin) produce paralysis of the body-wall muscle (Wolstenholme and Rogers, Reference Wolstenholme and Rogers2005; Kotze et al. Reference Kotze, Clifford, O'Grady, Behnke and McCarthy2004); piperazine inhibits body muscle as a GABA agonist (Martin, Reference Martin1982); emodepside inhibits muscle, apparently increasing a Slo-1 potassium current (Guest et al. Reference Guest, Bull, Walker, Amliwala, O'Connor, Harder, Holden-dye and Hopper2007). Even benzimidazoles, which bind β-tubulin, affect larval motility (Kotze et al. Reference Kotze, Clifford, O'Grady, Behnke and McCarthy2004). We anticipate that all of these classes of anthelmintic drugs could affect our phenotypic parameters of locomotion in the resistant isolates, both in the absence and in the presence of the anthelmintic.
Although our focus for this study was on the detection and resolution of the phenotypes of parasitic larvae that are associated with anthelmintic resistance, the methods are also likely to be of great benefit for reverse genetic experiments where gene knockdown, knockout or transgenic experiments (Johnson et al. Reference Johnson, Behm and Trowell2005) may produce subtle locomotory phenotypes. We think the bioassay method is a powerful tool that will also facilitate these studies.
The time required for data analysis can be reduced and parameter extraction can be improved by using automated nematode tracking software. Several groups have developed software that automatically calculates body parameters for C. elegans (Feng et al. Reference Feng, Cronin, Wittig, Sternberg and Schafer2004; Cronin et al. Reference Cronin, Mendel, Mukhtar, Kim, Stirbl, Bruck and Sternberg2005; Chronis et al. Reference Chronis, Zimmer and Bargmann2007). However, their software has to be customized to measure the locomotion parameters as we have done. Currently, we use MATLAB to calculate parameters and characterize drug effects on nematode locomotion. It will speed analysis to automate the entire data recording and analysis steps by adding a movable test stage and developing a user-friendly program for tracking nematodes in the microfluidic bioassay under different drug concentrations.
We point out that like any bioassay; our method has potential sources of error. A number of factors need to be controlled for and can be minimized. For example, movement of the larvae will be reduced by a temperature reduction. This requires that collection of the data for comparison be made at the same temperature. We also found that as the age of the larvae increased, there was a gradual decrease in the velocity of movement; thus variation between isolates, even those that are drug sensitive may be anticipated. However, we do expect that despite some phenotypic variation between drug-sensitive isolates, that they will show sensitivity to the drug under test, in contrast to the resistance isolates. Despite potential limitations, we think that these sources of error can readily be controlled for and that our microfluidic assay offers an improved and higher level of resolution.
FINANCIAL SUPPORT
The project was supported by Grant Number R 01 AI 047194 from the National Institute of Allergy and Infectious Diseases to R.J.M., an Iowa Center for Neurotoxicology grant to A.P.R. and Iowa State College of Engineering funding to S.P. The content is solely the responsibility of the authors and does not necessarily represent the official views of the National Institute of Allergy and Infectious Diseases of the National Institutes of Health.