Implications
In production farms, pigs face challenging environments that impair health and performance, leading to economic losses and raising questions about welfare.
In contrast, genetic selection of high-performing animals is usually carried out in optimal conditions for the expression of genetic potential and not for their ability to cope with stressors. This study assessed to what extent genetic selection for production efficiency influenced pig susceptibility to an environmental challenge. Our results highlighted different responses to the challenge of two pig lines differing in feed efficiency and suggested that immune response, metabolism and feed intake modulations may supported pig adaptive capabilities.
Introduction
In conventional production systems, pigs are frequently confronted with non-optimal and challenging environments that impair their performance and health (Hyun et al., Reference Hyun, Ellis, Riskowski and Johnson1998). Some studies suggest unfavourable relationships between selection of pigs for productive traits and their ability to cope with stressors and to maintain their health (Doeschl-Wilson et al., Reference Doeschl-Wilson, Kyriazakis, Vincent, Rothschild, Thacker and Galina-Pantoja2009; Prunier et al., Reference Prunier, Heinonen and Quesnel2010). This hypothesis is supported by negative genetic associations found between growth performance and some innate immune traits in pigs (Clapperton et al., Reference Clapperton, Diack, Matika, Glass, Gladney, Mellencamp, Hoste and Bishop2009). Genetic selection for high-nutrient-demanding processes such as improved growth performance is usually carried out in optimal environments with non-limiting supplies of nutrients. It has been suggested that this may lead to the selection of animals that are not able to allocate sufficient nutrients to other demanding processes when facing environmental and health challenges, such as the responses of the immune system (Rauw et al., Reference Rauw, Kanis, Noordhuizen-Stassen and Grommers1998). However, further experimental data are required to support and validate this hypothesis.
The present study aimed to determine the ability of two lines of pigs divergently selected for residual feed intake (RFI; a measure of net feed efficiency) to cope with a degradation of hygiene in their housing environment. This hygiene challenge is known to impair growth performance and activate the immune system (Le Floc’h et al., Reference Le Floc’h, Melchior and Obled2014b). Our hypothesis was that pigs from the most efficient line (low RFI (LRFI)) would be more affected by poor hygiene than pigs from the less efficient line (high RFI (HRFI)). The objectives were thus to compare growth performance, plasma metabolite concentrations and blood indicators of the immune system activation, and health of the two RFI lines throughout the growing–finishing period when housed in poor or good hygiene conditions.
Material and methods
Animals
The experiment was performed in the INRA experimental facilities (Saint-Gilles, France) in compliance with the French directive on animal experimentation and care (2013-118). The trial was performed on two batches of 80 pigs each, with a total of 160 entire male and female Large-White pigs produced from the 8th generation of a divergent genetic selection for RFI (Gilbert et al., Reference Gilbert, Bidanel, Gruand, Caritez, Billon, Guillouet, Lagant, Noblet and Sellier2007). Briefly, the lines were established using the RFI selection criterion between 35 and 95 kg BW, calculated as: RFI=ADFI−(1.24×ADG)−(31.9×BFT), where ADFI was the average daily feed intake (g/day), ADG the average daily gain (g/day) and BFT was the back-fat thickness (in mm) at 95 kg (Gilbert et al., Reference Gilbert, Bidanel, Gruand, Caritez, Billon, Guillouet, Lagant, Noblet and Sellier2007). The LRFI line eat less than predicted and is most efficient, whereas the HRFI line eat more than predicted and is less efficient.
For the present study, pigs were born in the INRA experimental facilities in Saint-Gilles (France) from 30 sows (17 LRFI and 13 HRFI) and the two lines×six boars selected to sire this generation. The animals were included in the experiment upon transfer to the experimental growing – finishing unit at 12 weeks of age, hereafter referred to as week 0 (W0; average weight 27.1 kg, SD 3.5 kg).
Experimental design
Pigs were housed in individual pens (85×265 cm) on concrete floor throughout the experiment. The experiment was a 2×2 factorial design including four experimental groups of 40 pigs each, HRFI housed in good hygiene conditions (good-HRFI), HRFI housed in poor hygiene conditions (poor-HRFI), LRFI housed in good hygiene conditions (good-LRFI) and LRFI housed in poor hygiene conditions (poor-LRFI). Within each line, 80 pairs of littermates (same sex: female or entire male) having a similar BW were constituted. Within each pair, one animal was randomly assigned to one of the two hygiene conditions described hereafter. The experiment was divided into two periods. A total of 40 pairs of pigs, balanced for the sex and the line, were pre-selected to be slaughtered at the end of the first period. Period 1 (Challenge) lasted 6 weeks (W0 to W6) during which pigs from 12 to 18 weeks of age were housed either in poor or good conditions. At W6, half of the pigs in each group were slaughtered. Regardless of hygiene treatments during Period 1, the remaining pigs were transferred in another room within the same experimental growing unit of standard cleanliness, for Period 2 (Recovery). In that room, consecutive pens hosted alternatively pigs previously housed in good and poor hygiene conditions. All these pigs were slaughtered at W13 or 14 (25 or 26 weeks of age).
Animal housing and feeding
Throughout Period 1, the poor housing conditions consisted of no cleaning nor sanitation of the room after a previous occupation by non-experimental pigs as already described (Le Floc’h et al., Reference Le Floc’h, Melchior and Obled2014b). Conversely, to establish good conditions for Period 1, the rooms were cleaned and disinfected, in addition to the application of optimal aeration rate and temperature and strict biosecurity precautions. No antibiotic was systematically administrated, but individual treatment was applied when needed. Pigs were vaccinated against Mycoplasma hyopneumoniae (SUVAXYN® M.Hyo Mono; Malakoff, Zoetis, France) during the post-weaning period, and received two intra-muscular injections of swine influenza virus vaccine (GRIPOVAC 3®; Merial, Lyon, France) at W6 and W9. Throughout the experimental periods, pigs were fed ad libitum a standard growing diet (94.73 kJ digestible energy; trp/lys 0.2; lys 8.3 g; dry matter 87.38%; starch 44.17%; NDF 15.7%; ADF 5.6%; ADL 1.6%; fat 3.14%; wheat 32.2%; barley 30%; maize 15%; soya bean 7%; bran 5%) and had free access to water.
Measurements and blood sampling
Pigs were weighed after an overnight fast three times during Period 1 (W0, just before the transfer of the pigs in the experimental building, W3 and W6) and every 2 weeks during Period 2 (W8, W10 and W12). Feed consumption was estimated weekly as the difference between allocated feed minus feed refusals. Each animal was carefully inspected and coughing, lameness and any other clinical signs were recorded weekly. Six blood samples were taken during the trial, at the time of weighing, for measuring indicators of immune system activation and fasting plasma metabolites concentrations. Blood was collected between 0800 and 1000 h by jugular punctures in heparin (9 ml), ethylenediaminetetraacetic acid (EDTA) (4 and 9 ml) and dry (4 ml) vacutainers tubes. Samples were kept on ice, except for blood cell count assessment, until centrifugation (3000 rpm, 4°C, 15 min), and plasma and serum were aliquoted and kept at −20°C before analyses.
Lesion scoring
At slaughter, the carcass, digestive tract, lung and snout were carefully inspected, and pathological lesions such as pericarditis and pleurisy were recorded. To assess the prevalence of pneumonia, a score from 0 to 4 was attributed to each of the seven pulmonary lobes and a total score from 0 to 28 was calculated as the sum of the scores attributed to each lobe (Corrégé, Reference Corrégé2004). Pigs with a score⩾6 were considered to be suffering from pneumonia.
Blood analyses
Blood cell counts, plasma concentrations of haptoglobin, glucose and free fatty acids (FFA) were measured from blood collected on EDTA, whereas plasma total protein concentrations were measured from blood collected on heparin. The total number of leucocytes (white blood cell (WBC)) and the differential count of granulocytes (eosinophils, basophils and neutrophils) were measured with a haematology automated cell counter calibrated for pigs (MS9®; Melet Schloesing Laboratories, Osny, France). Plasma haptoglobin concentrations (phase haptoglobin assay T801; Tridelta Development Ltd, Maynooth, Ireland), glucose (Kit Glucose RTUTM, ref. 61269; Biomérieux), FFA (Kit WAKO NEFA; Sobioda, France), total proteins (Kit Protéines-KitTM, ref. 61602; Biomérieux) and albumin (KitTM Albumine, ref. 61051; Biomérieux) were assessed by colorimetry on a Konélab 20i device (ThermoFisher Scientific, Courtaboeuf, France). Quantitative sandwich ELISA tests were used to quantify total immunoglobulin G (IgG) (Le Floc’h et al., Reference Le Floc’h, Knudsen, Gidenne, Montagne, Merlot and Zemb2014a) and anti-influenza-specific immunoglobulins (anti-flu Ig; IDEXX laboratories Inc., Westbrook, ME, USA) in serum samples from W6, W10 and W12.
Calculations and statistical analysis
Within periods, individual ADG (g/day) and ADFI (g/day) were calculated from the BW gain and the feed consumption, respectively. Feed efficiency was calculated as the gain-to-feed (G : F) ratio (kilogram BW per kilogram of feed consumed).
Growth performance calculated during Period 1 and Period 2, blood metabolites and immune variables measured at each sampling time, and the overall score values of pulmonary were analysed with a linear mixed model (PROC MIXED procedure, SAS software; SAS Institute Inc., Version 9.4, Cary, NC, USA). The statistical analyses were carried out separately for each period. The model included the effect of the hygiene conditions (poor or good), line (LRFI or HRFI), replicate (one or two) and sex (male or female) as main effects, and all significant two-way interactions with the pair as a random effect. The experimental unit was the pair of pigs for testing line effects, and the pig to test the hygiene effect and the corresponding interactions. For ADG and ADFI, initial BW at the beginning of Period 1 (W0) or of Period 2 (W6) was used as covariate. Blood immune indicators (granulocytes, WBC, haptoglobin) and metabolite concentrations (proteins, FFA and glucose) were square root transformed, and total antibodies were log transformed, to fit the test for normality (Shapiro–Wilk test, PROC UNIVARIATE). Estimated least-square means and pooled residual standard errors are presented for performance data. For blood data, results are presented as the mean and standard deviations of the back-transformed predicted values. Pair-wise comparisons of means were performed using a post hoc Bonferroni adjustment. The prevalence of pneumonia, pleurisy and pericarditis were compared with a χ 2 or Fisher test (PROC FREQ). A difference was considered as significant when P⩽0.05, whereas 0.05<P⩽0.10 was discussed as a trend.
Results
General observations
Data of total of 157 pigs were finally kept for the statistical analysis. One animal died from acute diarrhoea soon after the beginning of the experiment (good-HRFI group). Two animals were euthanised, one for a rectal prolapse (poor-HRFI group) and one due to an unexplained weight loss (good-LRFI group). In poor conditions, five animals had feed spillage behaviours and therefore they were removed from the analysis of feed consumption and feed efficiency. During Period 1, the following clinical signs were recorded at least once: sneezing and coughing (16 pigs in poor conditions and eight in good conditions); anaemia (one pig in poor conditions, treated with vitamin K), hyperthermia (one pig in good conditions, treated with flunixin), umbilical hernia (one pig in good conditions), lameness (two pigs in good conditions, treated with flunixin). Diarrhoea was recorded for seven pigs housed in poor conditions and 14 pigs housed in good conditions. However, the number of pigs with diarrhoea observed in poor conditions was likely underestimated due to the accumulation of effluents on the floor making difficult the scoring of faeces. At the end of Period 2, two pigs previously housed in good conditions during Period 1 had exudative dermatitis and were treated with local application of chlorhexidine.
Growth performance
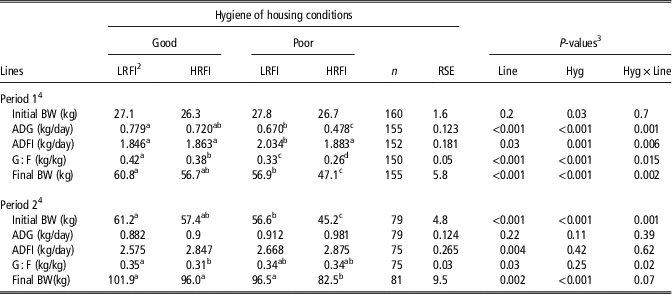
Growth performance are shown in Table 1. At W0, before pigs were transferred in experimental housing conditions, the initial BW of pigs allotted in poor hygiene housing conditions was greater than for pigs in good conditions (P=0.03). Irrespective of the line, average BW at the end of Period 1 and ADG during Period 1 were −6.8 kg (P<0.001) and −0.175 kg/day (P<0.001) lower in poor than in good conditions. During this period, in good hygiene conditions, ADG did not differ significantly between lines. ADG of the HRFI pigs was the most affected by poor hygiene conditions (hygiene×line (Hyg×Line), P<0.005), with the difference between poor- and good-HRFI pigs being twice the differences observed between poor- and good-LRFI pigs (−0.242 and −0.109 kg/day, respectively). During Period 2 (W12), ADG did not differ between the four experimental groups. However, there was a trend for a hygiene conditions and line interaction for BW at W12 (Hyg×Line, P=0.07) with a significant BW difference (−13 kg) between poor- and good-HRFI pigs.
Effect of contrasted hygiene of housing conditions on performance of the low and high residual feed intake (LRFI and HRFI) pigsFootnote 1

RSE=residual standard error; ADG=average daily gain; ADFI=average daily feed intake; G : F=gain-to-feed ratio.
a,b,c,dWithin a row values with different superscripts differed significantly (P<0.05).
1 Values are least-square means.
2 Two pig lines differing for their RFI (less efficient HRFI v. more efficient LRFI) housed in good hygiene (good) or in poor hygiene conditions (poor).
3 Probability values for the effect of hygiene challenge (Hyg), genetic lines (Line) and the interaction (Hyg×Line).
4 Period 1: hygiene challenge (weeks 0 to 6); Period 2: recovery period (weeks 6 to 12).
During Period 1, ADFI of poor-LRFI pigs was higher than that of good-LRFI (+0.19 kg/day), whereas no effect of the hygiene conditions was observed for the HRFI line (Hyg×Line, P=0.006). During Period 2, ADFI did not differ between pigs previously housed in good or poor hygiene conditions. However, HRFI pigs ate more than LRFI pigs (P=0.004).
The LRFI line had higher G : F ratios for the both periods. During Period 1, good-HRFI and good-LRFI pigs had greater G : F ratios than pigs raised in poor hygiene (+0.127 and +0.087, respectively, Hyg×Line, P=0.015). During Period 2, poor-HRFI pigs tended to exhibit a slightly higher G : F ratio than good-HRFI pigs, whereas the G : F ratio was similar irrespective of hygiene status in for the LRFI line (Hyg×Line, P=0.02).
Immune and inflammatory responses
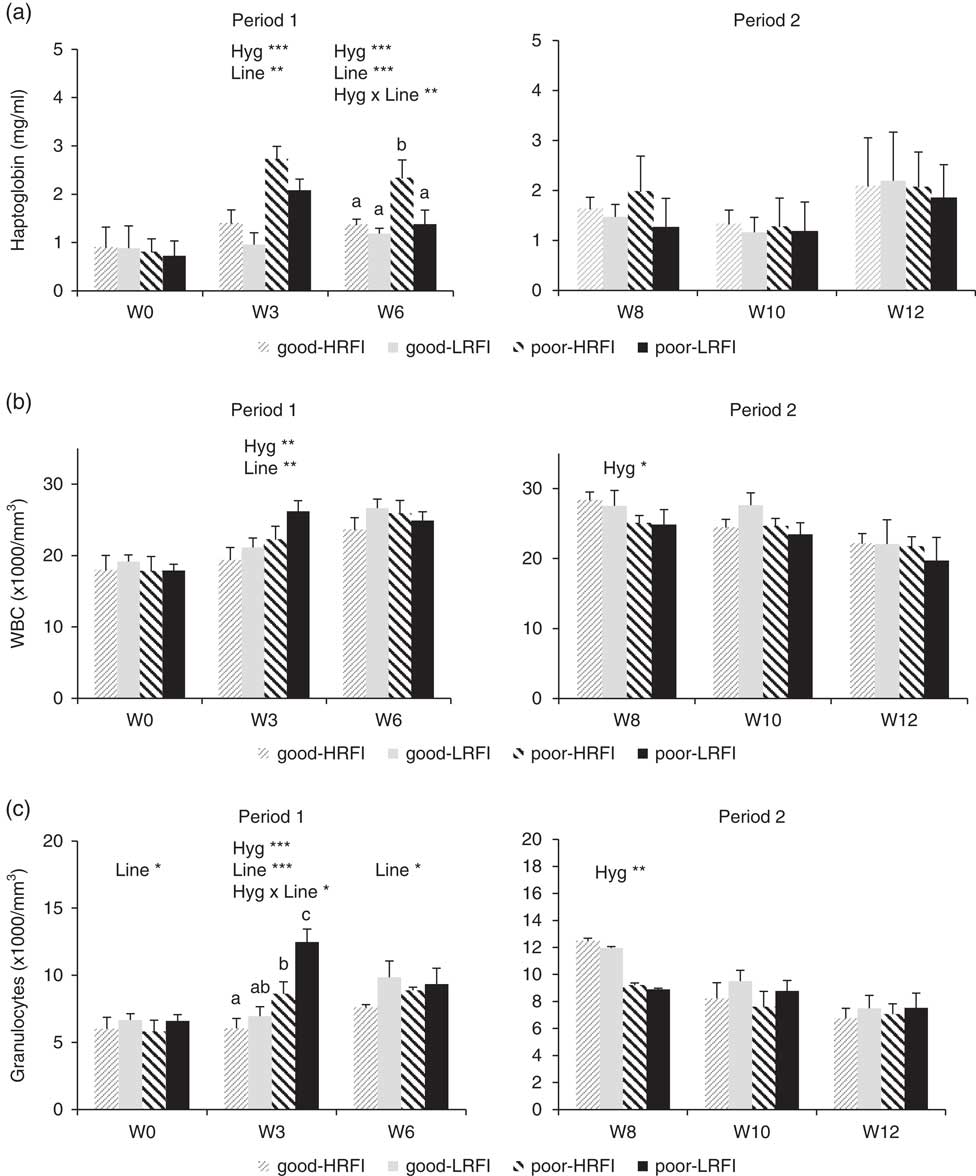
Plasma haptoglobin concentrations, WBC and blood granulocytes counts are presented in Figure 1. At W0, just before the challenge and irrespective of line, pigs allotted to poor or good hygiene conditions had similar plasma haptoglobin concentrations, WBC and blood granulocyte counts. At W3, plasma haptoglobin concentrations in poor conditions were twice the level measured in good conditions for the two RFI lines (P<0.001). At W6, the poor-HRFI pigs still had higher plasma concentrations of haptoglobin than good-HRFI animals (P<0.001), whereas poor-LRFI and good-LRFI pigs did not differ for that trait (Hyg×Line, P=0.007). At W3, pigs in poor conditions had 19.6% more WBC than pigs housed in good conditions (P<0.001) but no differences were observed at W6.
Effect of contrasted hygiene of housing conditions on (a) plasma haptoglobin concentrations, (b) white blood cell counts (WBC) and (c) blood granulocyte counts during the hygiene challenge (Period 1) and recovery (Period 2) in low residual feed intake (LRFI) and high residual feed intake (HRFI) pigs. Each bar represents the average value for one experimental group. Error bars are mean standard deviations of the back-transformed predicted values. Hyg×Line=hygiene×line.

At W3, poor-LRFI pigs had 79.5% more blood granulocytes than good-LRFI, whereas poor-HRFI had 42.7% more blood granulocytes than good-HRFI (Hyg×Line, P=0.03). At W6, pigs housed in good or poor conditions had similar number of blood granulocytes.
During Period 2, plasma haptoglobin concentrations were no affected by the hygiene conditions or by the line. At W8, and irrespective of the line, pigs previously housed in poor hygiene conditions had 10.6% lower WBC (P=0.04) and 26% lower blood granulocyte counts than pigs housed in good conditions (P=0.007). No further differences were observed at later stages (W10 and W12).
At W6, total immunoglobulin concentrations in plasma were higher in poor than in good conditions (13.3 g/l (SD 2.7 g/l) v. 11.0 g/l (SD 2.2 g/l), respectively; P=0.004) for both lines, and they were higher in HRFI than in LRFI (13.6 g/l (SD 2.7 g/l) v. 10.7 g/l (SD 1.8 g/l), respectively; P=0.01). The concentrations did not differ at W10 or W12. Plasma anti-flu Ig were below the threshold of seropositivity at W6. At W8 and W10, anti-flu Ig were higher in poor-LRFI pigs than in the three other experimental groups (Hyg×Line, P=0.02 and P=0.01, respectively).
Lesions scoring
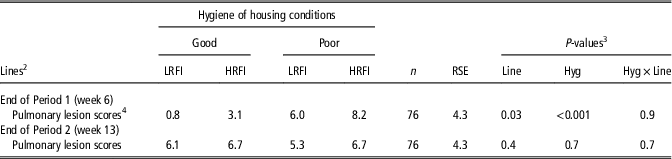
At the end of Period 1, two pigs with pericarditis and three with pleurisy were observed for poor-HRFI pigs, and none in the other experimental groups (among 75 pigs). The number of pigs suffering from pneumonia (lesion scores⩾6) was higher in poor conditions (P<0.001), with a prevalence of 51% and 8% for pigs in poor and good conditions, respectively. The average pulmonary lesions score was significantly higher in poor than in good conditions (hygiene, P<0.001), and was generally higher for the HRFI than for the LRFI line (line, P=0.03) (Table 2).
Effect of contrasted hygiene of housing conditions on the average lungscores of the low and high residual feed intake (LRFI and HRFI) pigsFootnote 1

RSE=residual standard error.
1 Values are least-square means.
2 Two pig lines differing for their RFI (less efficient HRFI v. more efficient LRFI) housed in good hygiene (good) or in poor hygiene conditions (poor).
3 Probability values for the effect of hygiene challenge (Hyg), genetic lines (Line) and the interaction (Hyg×Line).
4 Lung lesion scores: a score from 0 to 4 was attributed to each of the seven pulmonary lobes and a total score from 0 to 28 was calculated as the sum of the scores attributed to each lobe
At the end of Period 2, there was no effect of previous hygiene conditions on the prevalence of pneumonia (n=14/39 pigs and n=16/41 pigs in good and poor conditions, respectively; P=0.6). However, there was a higher prevalence of pleurisy for pigs previously housed in poor conditions (n=9/41: 22%) than for pigs previously housed in good conditions (n=1/39: 2.6%) (P=0.02). Among the nine pigs suffering from pleurisy in poor conditions, six were HRFI pigs. Similarly, the prevalence of pericarditis at the end of Period 2 for animals previously housed in poor or good conditions was 26.8% (n=11/41) and 2.6% (n=1/39), respectively (P=0.002). Among the 11 pigs housed in poor conditions and diagnosed with pericarditis, eight were HRFI. At the end of Period 2, lung lesion scores were not affected by the hygiene conditions or by the line (Table 2).
Plasma metabolite concentrations
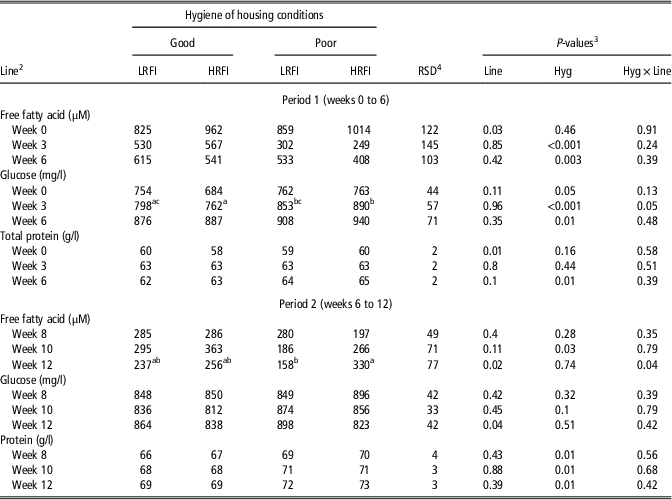
Fasting plasma FFA, glucose and proteins concentrations are presented in Table 3. At W0, plasma FFA concentrations were higher in HRFI than in LRFI pigs (P=0.03). Plasma FFA concentrations were lower in poor than in good conditions at W3 (P<0.001) and W6 (P=0.003), with no differences between the two lines. At W0, plasma glucose concentrations were greater in pigs allotted to poor conditions than in pigs allotted to good conditions, essentially due to lower values in the good-HRFI group. At W3, plasma glucose concentrations were greater for pigs housed in poor conditions but the difference was significant only for HRFI pigs (Hyg×Line, P=0.05). At W6, glycaemia was higher in poor than in good conditions for both lines (P=0.01). Similar results were obtained when plasma glucose concentrations at W0 were used as covariate to account for initial differences. At W0, plasma protein concentrations were similar in both housing conditions, and LRFI pigs had lower concentrations than HRFI pigs (P=0.007). No difference was observed at W3. At W6, plasma protein concentrations of pigs housed in poor conditions were higher than those of pigs in good conditions (P=0.007). At W3 and W6, plasma albumin concentrations (data not shown) were lower in poor conditions compared with good conditions (P<0.01), at W6, the differences between the two conditions were greater for the HRFI line (Hyg×Line, P=0.01).
Effect of contrasted hygiene of housing conditions on plasma metabolite concentrations of the low and high residual feed intake (LRFI and HRFI) pigsFootnote 1

a,b,cWithin a row values with different superscripts differed significantly (P<0.05).
1 Values are back-transformed predicted values.
2 Two pig lines differing for their RFI (less efficient HRFI v. more efficient LRFI) housed in good hygiene (good) or in poor hygiene conditions (poor).
3 Probability values for the effect of hygiene challenge (Hyg), genetic lines (Line) and the interaction (Hyg×Line).
4 Standard deviation of the back-transformed predicted values.
During Period 2, at W12, poor-HRFI pigs had higher plasma FFA concentrations than poor-LRFI, whereas there was no difference between good-HRFI and good-LRFI (Hyg×Line, P=0.04). Glycaemia of pigs previously housed in good or poor conditions during Period 1 did not differ during Period 2. Irrespective of the line, plasma protein concentrations at W8 (P=0.01), W10 (P=0.01) and W12 (P=0.01) were greater for pigs previously housed in poor conditions than for pigs housed in good conditions during Period 1. Similarly, plasma albumin concentrations (data not shown) were lower for pigs previously housed in poor conditions than for pigs housed in good conditions at W8 (30.4 v. 33.2 g/l, P=0.001) and at W10 (32.4 v. 34.9 g/l, P=0.001).
Discussion
Pig responses to poor hygiene conditions
This study confirmed that poor hygiene conditions affect pig health and depress growth performance. Pig health was worse when housed in poor conditions, as demonstrated by the higher prevalence of pneumonia and lung lesions at the end of Period 1 compared with pigs housed in good conditions. Higher pulmonary diseases were also observed in commercial farms with poor sanitisation levels (Fablet et al., Reference Fablet, Marois-Créhan, Simon, Grasland, Jestin, Kobisch, Madec and Rose2012a). In our study, it was not possible to discriminate the two housing conditions based on carbon dioxide, ammonia and temperatures (Supplementary Material S1). However, the high relative humidity which was observed in poor conditions may have promoted bacterial growth (Banhazi et al., Reference Banhazi, Seedorf, Rutley and Pitchford2008) and could have enhanced the bacterial pressure, so that pigs would have been exposed to a wider range of antigens. The stimulation of the immune system of pigs in poor conditions was indicated by the greater plasma haptoglobin concentrations, WBC and granulocytes counts observed three weeks after the beginning of the challenge, as already reported (Le Floc’h et al., Reference Le Floc’h, Melchior and Obled2014b). High levels of haptoglobin, an acute phase protein (APP), were found in plasma during inflammation, infections or enzootic pneumonia in pigs (Fraile et al., Reference Fraile, Saco, Grau-Roma, Nofrarías, López-Soria, Sibila, Callén, Bassols and Segalés2015). Granulocytes are the first immune cells to be mobilised during an inflammatory response. In pigs, blood granulocytes are composed of 95% of neutrophils and high neutrophil counts are generally considered as an indicator of systemic infections (Kampman-van de Hoek et al., Reference Kampman-van de Hoek, Sakkas, Gerrits, van den Borne, van der Peet-Schwering and Jansman2015). In addition, at W6, higher total blood IgG concentrations were observed for pigs housed in poor hygiene compared with pigs in good conditions implying a greater history of antigenic stimulations for these pigs. After 2 weeks the hygiene challenge has ceased, pigs previously housed in good hygiene had higher blood granulocytes than pigs from poor conditions. Moreover, pneumonia occurrence was similar in both groups at the end of Period 2. This suggested that during Period 2, pigs coming from good housing conditions were contaminated by pig-to-pig contacts with pigs previously housed in poor hygiene during Period 1(Fablet et al., Reference Fablet, Marois-Créhan, Simon, Grasland, Jestin, Kobisch, Madec and Rose2012a). In our study, the disease status of the herd was negative for Actinobacillus and porcine reproductive and respiratory syndrome virus (PRRS) but positive to porcine respiratory Coronavirus and M. hyopneumoniae. In the present study, it was not possible to differentiate anti-Mycoplasma antibodies induced by vaccination and by natural infection. However, M. hyopneumoniae may act synergistically with other pathogens to cause pulmonary lesions in pigs (Fablet et al., Reference Fablet, Dorenlor, Eono, Eveno, Jolly, Portier, Bidan, Madec and Rose2012b) similar to those observed in our study.
The activation of the immune system by poor hygiene conditions was associated with a modification in circulating concentrations of metabolites, notably lower fasting FFA and higher glucose during Period 1. Fasting FFA is generally considered as an indicator of lipid mobilisation from adipose tissues (Mersmann and MacNeil, Reference Mersmann and MacNeil1985). The lower FFA concentrations observed in poor conditions suggest that lipolysis was lower in pigs housed in poor hygiene conditions as previously reported in pigs during an acute inflammation induced by a lipopolysacharride (Guo et al., Reference Guo, Liu, Sun, Huang, Albrecht, Zhao and Yang2015). In our study, poor hygiene induced a chronic inflammatory state, during which FFA uptake by tissues could be also increased (Mersmann and MacNeil, Reference Mersmann and MacNeil1985). Inflammatory response induces the release of pro-inflammatory cytokines that may disrupt the insulin signalling pathway leading to relative insulin insensibility (Collier et al., Reference Collier, Dossett, May and Diaz2008). Moreover, amino acids (AA) release by protein breakdown could be used for neoglucogenesis to fuel the immune cells (Bruins et al., Reference Bruins, Deutz and Soeters2003). These two processes could have accounted for the higher glycaemia observed for pigs housed in poor conditions compared with pigs in good conditions during Period 1. Immune and inflammatory responses induce dramatic changes in protein and AA metabolism (Le Floc’h et al., Reference Le Floc’h, Deblanc, Cariolet, Gautier-Bouchardon, Merlot and Simon2004), which could explain the observed differences in plasma protein concentrations between experimental groups found only during the recovery period. Plasma total proteins are composed of albumin (70%), APP and immunoglobulins, whose concentrations vary during the immune response. For instance, total plasma immunoglobulins was increased by 25% following immunisation (Hasselquist and Nilsson, Reference Hasselquist and Nilsson2012), whereas serum albumin concentrations were 15% lower for pigs with poor health status than for healthy pigs (Kampman-van de Hoek et al., Reference Kampman-van de Hoek, Sakkas, Gerrits, van den Borne, van der Peet-Schwering and Jansman2015). Protein concentrations were higher for pigs leaving poor hygiene conditions than for those previously housed in good conditions during Period 2. This did not seem related solely to the immune system stimulation. Indeed, the sum of albumin, immunoglobulins and haptoglobin were below the total plasma proteins concentrations measured in pigs in poor conditions, suggesting that 10 to 20 g/l of the total of plasma proteins were not identified. Further studies are required to assess if this could be related to a specific protein metabolism associated to compensatory growth during Period 2.
In our study, the reduction in growth rate observed during Period 1 was not associated with a decrease in ADFI for pigs housed in poor conditions. These results contrasted with previous studies showing that poor hygiene housing conditions decreased ADFI (Le Floc’h et al., Reference Le Floc’h, Melchior and Obled2014b). Altogether, the above results suggest that the reduction in growth rate observed during Period 1 for pigs in poor conditions was not related to a decrease in feed intake and might be due to changes in metabolism induced by the immune system stimulation (Le Floc’h et al., Reference Le Floc’h, Deblanc, Cariolet, Gautier-Bouchardon, Merlot and Simon2004). Body weight gain during Period 2 tended to be higher for pigs previously housed in poor conditions indicating that pigs were able to express partial compensatory growth after the poor hygiene challenge has ceased. Alternatively, pigs previously housed in good conditions may have grown slowly during Period 2 because of cross-contamination by pigs housed in poor conditions during Period 1 as discussed previously.
Differences in responses to the hygiene challenge depending on the genetics
Our initial assumption that the efficient line, LRFI, would be the least able to cope with poor hygiene conditions was not supported by our results. Indeed, in poor conditions, LRFI pigs were able to maintain their growth to a better extent than the HRFI pigs during Period 1, and the health of the most efficient pigs was less affected by the challenge. These results are in accordance with recent findings showing that growth of a LRFI pig line was less impaired by a PRRS virus infection in comparison with a HRFI line (Dunkelberger et al., Reference Dunkelberger, Boddicker, Serão, Young, Rowland and Dekkers2015).
Our results further show that the influence of poor hygiene conditions on blood immune indicators was different according to RFI lines. Plasma haptoglobin concentration was higher in poor than in good conditions for both lines, but this response was lower and seemed to last for a shorter time in the LRFI line than in the HRFI line. Haptoglobin kinetics are generally regarded as reflecting the duration and the severity of diseases (Sorensen et al., Reference Sorensen, Tegtmeier, Andresen, Pineiro, Toussaint, Campbell, Lampreave and Heegaard2006), so this line-associated response suggest a lower impact of poor hygiene conditions in LRFI pigs, which was also illustrated by lower lung lesion scores. Interestingly, the difference in blood granulocyte count between the two conditions was of greater amplitude in LRFI pigs. In addition, during Period 2, the hygiene challenge enhanced the response to the influenza vaccine, as previously reported in another porcine genotype (Pastorelli et al., Reference Pastorelli, Le Floc’h, Merlot, Meunier-Salaün, van Milgen and Montagne2012). Poor hygiene of housing conditions, through stimulation of pig immune system at early growing stage, may have promoted a more reactive immune response. This positive effect was observed only in poor-LRFI pigs, as demonstrated by their higher anti-flu IgG at W10 and W12. These results indicate that the specific humoral immune response of the LRFI line was more reactive. Higher PRRS virus-specific IgG antibodies associated with a trend for a lower viral load were similarly observed for a LRFI line during a viral challenge (Dunkelberger et al., Reference Dunkelberger, Boddicker, Serão, Young, Rowland and Dekkers2015). The higher granulocytes levels during Period 1 and the higher anti-flu IgG observed at Period 2 associated with the lower systemic inflammatory response, as indicated by lower plasma haptoglobin concentrations, for poor-LRFI pigs suggest a better ability of poor-LRFI to mount an efficient immune response that may explain their lower lung lesion scores.
Genetic and phenotypic correlations between immune and performance traits have already been reported in pigs (Clapperton et al., Reference Clapperton, Diack, Matika, Glass, Gladney, Mellencamp, Hoste and Bishop2009). Contrasted immune responses of the present study could be associated to differences in efficiency of the protective functions of the immune response, and also to additional differences in nutrient and energy costs required to cope with poor hygiene. High nutrient costs are generally associated with the inflammatory response, mainly related to the high quantities of specific AA required for liver APP synthesis which are supplied by muscle proteolysis (Kampman-van de Hoek et al., Reference Kampman-van de Hoek, Sakkas, Gerrits, van den Borne, van der Peet-Schwering and Jansman2015). Hence, the better ability of the LRFI line to sustain its growth during Period 1 may be partly explained by a lower nutritional cost associated with a shorter inflammatory response. Moreover, our results revealed that LRFI pigs had greater ADFI when housed in poor hygiene conditions. Thus, it is possible that the higher nutrients needed to fuel the immune system in poor conditions were, at least, partially compensated by an increase in nutrient intake for the poor-LRFI pigs.
During Period 1, a hygiene condition by line interaction was observed on plasma glucose concentrations suggesting a line difference in the ability to restore glucose homoeostasis. Similarly, Merlot et al. (Reference Merlot, Gilbert and Le Floc’h2016) reported that the postprandial plasma glucose concentrations were greater for HRFI compared with LRFI piglets the day after the induction of a non-infectious pulmonary challenge. Differences in glucose storage in the form of glycogen and lipids have also been observed between LRFI and HRFI lines (Faure et al., Reference Faure, Lefaucheur, Bonhomme, Ecolan, Meteau, Coustard, Kouba, Gilbert and Lebret2013). Whether these basal and challenge-induced differences between lines in nutrient metabolism are responsible for their differences in growth and health status remain to be assessed.
Conclusion
Our initial hypothesis was that pigs selected for high efficiency would be more susceptible to disease in a resource-limiting situation because of the higher priority given to growth for nutrient utilisation. Our results did not support this view, because deviations in growth and deterioration of health were lower for LRFI pigs than for HRFI pigs when housed in poor hygiene conditions. These changes were associated with distinct immune responses, differences in blood metabolites concentrations and in modulation of feed consumption between lines. Further investigations are required to decipher if the better ability of the LRFI to cope with poor hygiene is linked to a use and re-diversion of nutrients in a more effective way, to a better nutrient acquisition, and/or to a more effective immune response.
Acknowledgements
This study has received funding from the European Union’s Seventh Framework Programme for research, technological development and demonstration under grant agreement No. 613574 (PROHEALTH project). The authors are grateful to the staff of the laboratory and experimental pig facilities from INRA UMR PEGASE and GenESI as well as M. Hassouna (UMR SAS Rennes) and S. Lagadec (CRAB Rennes). A. C. was funded by INRA Phase division, Region Bretagne and PROHEALTH.
Supplementary material
To view supplementary material for this article, please visit https://doi.org/10.1017/S1751731117001379