


How can citizens motivate their elected representatives to work in their interest? In a complex world where attributing responsibility for outcomes is difficult, one efficient option is for voters to reward incumbent officials for good times and punish them for bad ones, thereby motivating incumbents to deliver good times. This decision rule, often called retrospective voting, offers a way for citizens to control elected officials without in-depth knowledge of important political matters. Voters can simply ask, am I better off financially? Has my welfare improved?Footnote 1
For retrospective voting to effectively motivate incumbents, however, citizens must be competent evaluators of past performance. Research points to several apparent departures from optimal political retrospection. In this article, we study three such departures: Voters (1) focus on recent rather than cumulative incumbent performance (Achen and Bartels Reference Achen and Bartels2004b; Fair Reference Fair1978; Kramer Reference Kramer1971); (2) are influenced by events unrelated to incumbent performance, such as natural disasters (Achen and Bartels Reference Achen and Bartels2004a; Cole, Healy, and Werker Reference Cole, Healy and Werker2011; Healy, Malhotra, and Mo Reference Healy, Malhotra and Mo2010); and (3) can be manipulated by rhetoric, framing, and marketing (Hetherington Reference Hetherington1996; Iyengar and Kinder Reference Iyengar and Kinder1987; Lenz Reference Lenz2012).Footnote 2
To understand these phenomena, we test whether individuals exhibit these three behaviors in a decision-making context that mimics real-world elections but takes the simplified form of an incentivized experimental game, allowing us to rule out competing explanations for these apparent biases. In this game, participants assessed performance under conditions much easier than those voters face in elections. The “performance” participants observed consisted of payments from a computer “allocator.” The computer randomly drew the allocator's type, which was just the expected average payment in each of the game's 32 periods. Because we did not tell participants their allocator's type, they had to infer that type solely from the payments, and each period's payments were equally informative. After observing the payments for 16 periods, participants faced a choice, similar to an election, in which they could keep or discard their allocator. Depending on their decision, either their first allocator or a new one, drawn at random, then paid them for each of the last 16 periods of the game: Their choice directly affected their total compensation.Footnote 3
Using three randomized interventions, we find evidence of all three departures from optimal evaluation of cumulative performance noted above. These deviations arose even though participants had financial incentives to behave optimally. Participants (1) overweighted later performance when they learned that they faced an “election” late in the game, (2) were influenced by irrelevant information even when they were told that the information was irrelevant, and (3) could be swayed by rhetoric to focus on later, rather than on overall, performance.
Our design departs from observational studies of retrospective voting and from previous experimental studies of choice in two important ways. The first is transparency. We explicitly inform each participant about where their income comes from, how their income relates to their allocator's type, and how their choices affect the income they receive. This transparency therefore removes many potential confounders of the relationship between a voter's received stream of benefits and the optimal choice to keep or retain the incumbent that occur in real elections. For example, in our game, participants know that the payouts they receive in each round are equally informative about the allocator's type, so there is no uncertainty about the relative value of information revealed at different points in time. Additionally, in contrast to real-world elections, the optimal decision rule follows from simple and known parameters of the game, the concept of incumbent effort (Barro Reference Barro1973; Ferejohn Reference Ferejohn1986) is irrelevant, and the distributions of incumbent and challenger types are revealed and held constant. This transparency also allows us to describe bias-free decision rules and compare behavior to that theoretically derived baseline.Footnote 4
More importantly, the transparency of our experiments allows us to understand whether suboptimal decision making is a function of the complexity of the real world (e.g., competing candidate claims, social pressures, emotional rhetoric, distorted and multidimensional information environments, etc.), or is instead due to basic limitations in individuals’ retrospective abilities. As we note later, for each of the apparent biases we study, there are multiple potential explanations for the patterns observed by scholars. We identify those explanations and exclude them by design with our simplified experimental game, leaving cognitive limitations as an explanation for the biases. Because avoiding these biases should be straightforward in our simple, transparent experiments, we believe this a “least likely” setting for finding these biases.
Second, the evaluation in this game is a costly measure of behavior, a key difference from many other experiments of choice. By choosing to keep or discard an incumbent, each player makes a decision that directly affects the income they receive, and that income induces preferences over outcomes.Footnote 5 In contrast, other laboratory experiments ask participants to evaluate objects of the experiment with opinions and survey responses whose content has no material consequence. By providing a financial incentive to make an optimal choice, our design encourages (though it does not enforce) reflection and engagement with the decision task at hand.Footnote 6 We believe that the real, if modest, financial incentive to pay attention in our experimental setting mimics the real, if modest, incentives for voters to understand their own interests when voting in mass elections.
After describing the game in detail, we present the design and results of three experiments. In our first experiment, we vary the timing of awareness about the choice to retain or discard an incumbent allocator. We find that those informed about the choice later in the game give greater weight to payments received after becoming aware of the upcoming choice relative to participants informed earlier on. This result shows that even in this simple setting, participants are unable to recollect and use information about incumbent performance presented only moments earlier, providing evidence that variation in citizen attentiveness (i.e., election salience) may explain voters’ tendencies to overweight incumbent performance proximate to an electoral choice.
In our second experiment, we test the mechanism connecting irrelevant events such as natural disasters to election outcomes. We add a random lottery to our game that is separate from participants’ round-by-round payments and inform participants that the lottery payment is unrelated to their allocator's type. This isolates the lottery's outcome from any reasonable measure of incumbent performance. Nevertheless, even after accounting for actual incumbent performance, a participant who receives a positive outcome in the lottery is more likely to retain their incumbent than one who receives a negative lottery outcome. This evidence suggests that irrelevant shocks would continue to influence voters’ choices even if they received the shock separately and knew that the shock was unrelated to incumbent performance.
Finally, in our third experiment, we investigate whether rhetoric can alter the information citizens incorporate into their retrospective decision making. We find that unobtrusive framing manipulations alter participants’ retrospective assessments: Those asked to reflect on their satisfaction with their incumbent allocator focus less on average allocator performance than those asked to think about the average payment received from their incumbent allocator.
Taken together, our findings have several important implications. First, they point to key limitations in voters’ ability to use a retrospective decision rule. Even in our simple and transparent game, participants exhibit biases similar to those measured in real-world elections. Complexity, and the attendant uncertainty about incumbent responsibility, information flows, the relationship between current and future performance, etc., may therefore be unnecessary to generate key biases observed in real electoral environments. These biases seem endemic in human behavior and are not limited to politics (see, e.g, Ariely and Carmon Reference Ariely and Carmon2000; Redelmeier and Kahneman Reference Redelmeier and Kahneman1996; Varey and Kahneman Reference Varey and Kahneman1992). Showing that these biases persist even in our simple and incentivized game suggests that they stem from basic cognitive limitations.
Second, our results reveal the need for, and limitations of, correctives for bias in retrospective decision making. For example, if the tendency to reward (punish) incumbents for good (bad) events beyond their control is rooted in ambiguity about an incumbent's responsibility for the outcome, then providing voters with information about who is responsible for different outcomes may improve choices. The results of our second (lottery) experiment, however, show that this may not eliminate the tendency to allow irrelevant information to affect evaluations of incumbents. Indeed, it remains uncertain exactly how best to mitigate this contamination, a topic we return to in the Conclusion.
Third, these patterns of voter biases are likely to explain, in part, distortionary and pernicious incumbent behavior. In particular, scholars have noted that incumbents appear to undertake policy efforts that generate “good news” close to elections at the expense of overall voter welfare. Our results show that these efforts, including excessive focus on election-year income growth at the expense of inflation (Achen and Bartels Reference Achen and Bartels2004b; Tufte Reference Tufte1978), may originate in an accurate perception of the weight voters give to information about incumbent performance revealed close to an election. Indeed, in electoral systems where incumbents can choose when to call elections, these results imply that the episodic nature of voter attentiveness may be exploited by calling elections when times are good (see, e.g., Palmer and Whitten Reference Palmer and Whitten2000). Finally, campaign rhetoric actively seeks to manipulate which elements of incumbent performance are brought to bear in voter evaluations (Vavreck Reference Vavreck2009), an effort that our results show may be a fruitful exercise for politicians.
EXPERIMENTAL OVERVIEW: AN INCENTIVIZED GAME
Our three experiments share a common framework, with each intervention deviating only slightly from this structure. We first present the common design, and then describe each intervention in turn. We recruited U.S. residents over the age of 18 to participate in an online experiment through Amazon.com's Mechanical Turk platform (hereafter MTurk).Footnote 7 Individuals were paid $0.25 or $0.50 for their initial participation and offered the opportunity to earn bonuses that averaged $0.80. Between March 24 and May 24, 2011, 2,992 participants earned an average of $1.21 for a task that took about 8 minutes.Footnote 8 To replicate experiment 2, we recruited an additional 1,010 participants between February 16 and March 6, 2012 (we describe differences between the initial experiments and this replication in the supplemental Online Appendix, available at http://www.journals.cambridge.org/psr2012015).
After we obtained informed consent, we removed 31% of potential participants who failed either of two screener questions we asked. Each screener question required a respondent to read the text of a question carefully and provide a nonobvious response in order to pass.Footnote 9 Next, we introduced participants to the game. We explained that the computer would assign them an allocator who would pay them tokens (convertible to cash at the rate of 50,000 tokens for $1) in each of 32 rounds on the basis of the allocator's type and a random noise parameter. We informed participants that the allocator's type was drawn from a uniform distribution ranging from 950 to 1450 and that the payments the allocator awarded in each period would be drawn from a normal (bell-shaped) distribution with a mean at the allocator's type.Footnote 10 Participants did not know the type (numerical value) of their allocator and could only make inferences about their allocator's type from the payments they received in each round.
We told participants that, although the computer assigned them an initial allocator for rounds 1 through 16, they would have the opportunity to keep or discard that initial allocator after round 16. If they chose to replace this initial allocator, the computer would assign a new allocator whose type was drawn at random from the same uniform distribution as the initial allocator and whose payout rule (the mapping of types to payouts) was identical to the one used by the initial allocator. Alternatively, they could choose to keep their initial allocator and that allocator would continue to assign tokens in the same manner for the remaining 16 rounds. The basic task in all experiments was for participants to determine whether to keep or replace their initial allocators after viewing the first 16 rounds of payments. Each participant's bonus payment was a linear function of the tokens he or she was allocated across each period, and so each participant had a monetary incentive to maximize token payouts by choosing an allocator of the highest possible type for the second 16 rounds.Footnote 11
For each round, we presented participants’ payments on a separate web page.Footnote 12 Although our three experiments modified aspects of the game to test different propositions about incumbent evaluation, the optimal decision rule for risk-neutral participants across experiments remained constant: Keep the incumbent allocator if the average payment in rounds 1–16 was greater than 1200 and replace the incumbent allocator if the average payment in rounds 1–16 was less than 1200.Footnote 13 We did not explicitly state this rule to participants, but because the type of each allocator is drawn from the uniform distribution between 950 and 1450, the average allocator is of type 1200. Further, because each payment is also drawn from a normal distribution with a mean equal to the allocator's type, the payment average is an unbiased estimate of the allocator's type. If the payment average exceeds 1200 tokens, the allocator is more likely to be above-average rather than below-average type and should therefore be retained.Footnote 14 Because of variation in risk preferences, fully rational and informed individuals may depart from the 1200-token cutpoint strategy (with those who are more risk-averse retaining for lower averages, and those who are more risk-seeking discarding for higher averages). We allow for variation in individual-level risk preference in our analysis.
THE USE OF AMAZON.COM'S MECHANICAL TURK
We recruited participants for our experiments from a novel subject pool: Amazon.com's Mechanical Turk. Given this novelty, it is important to examine the desirability of this method of subject recruitment and experimental administration. Recent social science assessments of the MTurk subject pool conclude that it is generally a reasonable substitute for other convenience samples often used in experimental settings. For example, Berinsky, Huber, and Lenz (Reference Berinsky, Huber and Lenz2012; henceforth BHL) evaluate the external and internal validity of research using MTurk samples, comparing them to typical convenience samples used in experiments (other Internet panels, undergrad volunteers, recruits off the street) as well as nationally representative Internet surveys (e.g., Knowledge Networks) and face-to-face surveys (ANES and CPS). BHL conclude that MTurk samples are more diverse than typical experimental samples and not substantially different on many demographic and political variables from nationally representative samples. They also find that three well-known experiments replicate with MTurk samples.
In addition to BHL, several peer-reviewed articles now validate MTurk in other fields, reaching similar conclusions. In an article published in Perspectives on Psychological Science, Buhrmester, Kwang, and Gosling (Reference Buhrmester, Kwang and Gosling2011) conclude that MTurk participants are slightly more representative of the U.S. population than are standard Internet samples and are significantly more diverse than typical American college samples, and that data obtained using MTurk are at least as reliable as those obtained via traditional methods. Paolacci, Chandler, and Ipeirotis (Reference Paolacci, Chandler and Ipeirotis2010) reach similar conclusions in an article recently published in Judgment and Decision Making. Finally, the journal Experimental Economics has published an evaluation of MTurk for economic experiments (Horton, Rand, and Zeckhauser Reference Horton, Rand and Zeckhauser2010) that also successfully replicates previous studies including incentivized games, and reaches similar conclusions about the strengths of MTurk for experimental studies.Footnote 15
At the same time, a potential concern about the MTurk pool is that participants may be motivated to earn money quickly. For this reason, political surveys in which workers do not face the prospect of having their work rejected by the supervisor for poor quality may attract particularly inattentive workers (as, of course, would requiring students to complete work for course credit or any other pool where subjects are offered incentives to complete surveys or other research tasks without the quality of the effort being evaluated by the requester). In our experiments, this could be a problem because the retrospective tasks reward attentiveness and because optimal behavior requires recollecting incumbent performance. Prior research shows that MTurk workers seem more attentive than other subject pools. For example, in one study reported in BHL, participants were asked to identify the political office held by a person mentioned in a story they had just read. The format of this question was multiple choice with five possible responses. On the MTurk study, 60% of the respondents answered the question correctly. An identical question concerning the same article was also included on experiments run through Polimetrix/YouGov and Survey Sampling International (SSI). The correct answer rates on those platforms were markedly lower than in the MTurk sample—49% on Polimetrix/YouGov and 46% on SSI.
Nonetheless, we believe that these general concerns about attentiveness—which exist for any sample—are less of a concern in our experimental setting for three reasons. First, as we noted earlier, we excluded 31% of potential participants for failing to read screening questions carefully, which likely reduced the proportion of inattentive participants. Second, unlike most MTurk survey tasks, our task explicitly rewarded attention by informing participants that their behavior would affect their earnings and explaining how they could maximize those earnings. Thus, participants knew they would make less money, in expectation, by failing to pay careful attention.Footnote 16 Our incentives therefore serve both to focus participants in the decision-task on the observable measure of incumbent performance and to motivate attention more generally. Finally, we believe that natural variability in attentiveness resembles natural variability in attention to politics outside the experimental setting, where numerous studies have documented widespread inattentiveness to politics (Delli Carpini and Keeter Reference Delli Carpini and Keeter1996; Zaller Reference Zaller1992).
Of course, important concerns remain about the MTurk sample. We cannot validate that all participants who passed our screeners remained attentive throughout the experiment or that our incentives generated full engagement (which, we note, would tend to bias against finding any results for our interventions). For this reason, it would be ideal to replicate these results in other settings. More generally, in the nonexperimental setting, other factors (e.g., elite cues) may allow participants to compensate for their lack of careful attention, a possibility we take up when discussing extensions to our experimental framework in the Conclusion.
BASELINE PATTERNS OF BEHAVIOR
Before discussing the results of our manipulations, we first describe average patterns of participant behavior in our game. In particular, we assess how well participants incorporated information contained in the payments history into their decision to retain their incumbent allocator. We find that participants did respond to the payments, but not optimally (assuming risk-neutral preferences). We first consider the (risk-neutral) cutpoint strategy, in which participants retain any incumbent whose average allocation exceeded 1200 tokens and discard all others. In Figure 1, we plot on the x-axis the proportion of participants retaining their incumbent allocator in each experiment after round 16 by whether average payments were greater or less than 1200 tokens. Participants receiving less than 1200 tokens on average retained their incumbent allocators about 60% of the time in each experiment. By contrast, participants receiving on average more than 1200 tokens in the first 16 rounds retained their incumbent allocator about 80% of the time in each experiment. Although the 20-point gap is relatively large and statistically significant, it is obviously smaller than the 100-point gap that perfect adoption of the 1200-token average payment cutpoint would yield.Footnote 17 Failing to follow this cutpoint strategy was costly. Participants whose behavior is consistent with the 1200-token cutpoint strategy on average earned about $0.17 more than those who did not, which is almost 43% of the $0.40 a participant would average in the final 16 rounds with a random draw from the allocator distribution.
Allocator Retention Rate by Experiment and Whether Average Payments in Rounds 1 to 16 Exceed 1200 Tokens
Notes: Each point is the observed proportion of participants who chose to keep their initial allocator after the 16th round by whether their average payments were above or below 1200 tokens. Ninety-five percent confidence intervals are calculated based on the variability of a sample proportion given the observed retention rate and the count of participants in each intervention. N for each experiment is 965, 1003, and 1024, respectively.

If participants did not adopt the 1200-token cutpoint rule, what strategy did they adopt? Our analysis shows that in the aggregate, participants responded relatively smoothly to average payments: The more the allocators paid, the more likely participants were to retain them. This pattern is apparent in Figure 2, where we plot the relationship between average payments in rounds 1 to 16 (the horizontal axis) and the retention rate (the vertical axis). We present this relationship with a separate line for each experiment, using a smoothed local polynomial fit. The figure shows that, in each experiment, participants were more likely to retain their incumbent allocators as their average payments increased. Retention rates are less than 50% when average payments are below 800 tokens and above 75% when they exceed 1200 tokens. We note, however, that the relatively high retention rates (approximately 60%) for those participants whose average allocator payment was 1000 tokens could imply a high level of risk aversion: In those cases, a replacement allocator would be expected to be inferior only 10% of the time.
Allocator Retention Rate by Experiment and Average Payments in Rounds 1 to 16
Notes: Using local polynomial fits, the lines present the proportion of participants retaining their allocators (vertical axis) by the average payments received in rounds 1 to 16 (horizontal axis). Each line represents one of the three experiments presented in this paper. N for each experiment is 965, 1003, and 1024, respectively.

We next turn to describing the designs and results for the three experiments. The graphical analysis presented here forms the basis of our analysis of the effects of the experimental interventions. We present an overview of the three experiments, highlighting their commonalities and differences for the reader's reference, in Figure 3.
Experiment Design Overview and Interventions

Experiment 1: End Bias in Retrospective Assessments
Our first experiment is motivated by trying to understand why voters seem to evaluate incumbents on the basis of election-year economic outcomes rather than cumulative economic performance (Achen and Bartels Reference Achen and Bartels2004b; Fair Reference Fair1978; Kramer Reference Kramer1971). One explanation is that voters focus on election-year outcomes intentionally because they perceive later growth as more informative about the incumbent's quality than earlier growth. They may also see the election-year economy as more informative about an incumbent's ability to produce postelection growth (e.g., MacKuen, Erikson, and Stimson Reference Mackuen, Erikson and Stimson1992). Alternatively, voters may lack an appropriate benchmark for incumbent performance, but media coverage and campaign communication may focus their attention on contemporaneous conditions.
We examine another possibility for the greater influence of later events, one not rooted in purposive voter behavior or the informational environment. Evidence from psychology experiments indicates that people do not generally keep track of the utility they experience, nor can they accurately recollect it. Instead, they often substitute an alternate attribute of their experience that is salient, such as how that experience ended or the peak pleasure or pain experienced (Ariely and Carmon Reference Ariely and Carmon2000; Kahneman, Wakker, and Sarin Reference Kahneman, Wakker and Sarin1997; Redelmeier and Kahneman Reference Redelmeier and Kahneman1996; Varey and Kahneman Reference Varey and Kahneman1992).Footnote 18 Similarly, we hypothesize that citizens do not naturally keep a “running tally” of performance (e.g., cumulative income growth) over the course of an incumbent's term. Instead, as an election approaches, the choice among candidates becomes more salient and voters become more attentive to readily available measures of incumbent performance (Valentino and Sears Reference Valentino and Sears1998).Footnote 19 Attentiveness is important in this account if voters are indeed unable to recollect, after becoming attentive, earlier incumbent performance (e.g., growth in earlier years of a president's term). Put simply, voters might rely on total performance had they kept track of it, but because they do not, they instead rely on the election-year economy (see also Healy and Lenz Reference Healy and Lenz2012).
To support the claim that variation in attentiveness is a viable explanation for a focus on recent events in incumbent evaluations, we examined the 2000 Annenberg National Election Survey, a large nationally representative U.S. telephone survey, where respondents interviewed between April 2000 and November 2000 (Election Day) were asked about their interest in the 2000 presidential campaign.Footnote 20 The proportion of respondents who were very interested in the campaign doubled from about 20% in April, May, and June to around 40% in November. This survey result indicates that interest in the campaign increases as the event of an election becomes more proximate.
In this experiment, we assess whether an individual who becomes aware of a future choice close to that decision is able to recollect information presented very recently to form a comprehensive evaluation of the incumbent's performance, or instead relies disproportionally on information presented after learning of the future choice. We did so by manipulating when the participant became aware of her task of evaluating the allocator. Specifically, although all 623 participants in our experiment were informed that after 16 rounds they would have the opportunity to keep their incumbent allocators or to replace them, we manipulated in which of two periods they learned about this future choice. We randomly informed 205 respondents about the upcoming choice before period 1 (prior to any payouts being allocated) and the remaining 418 after period 12.Footnote 21
Much as politics seems to become more salient further into a president's term, participants in the latter manipulation became aware they faced a choice later in the game. This manipulation is, of course, somewhat blunt. Whereas most citizens are probably aware of future elections even if they are not attentive to politics, those informed of their choices “late” in our experiment do not, prior to this announcement, even know that a choice is approaching. Nonetheless, manipulating awareness of this choice allows us to induce variation in attentiveness to (and the salience of) incumbent performance.Footnote 22 If variation in attentiveness explains the apparent focus in real-world elections on later-period economic growth, then our manipulation induces that variation. This experiment also speaks to electoral systems without fixed election dates, such as the British system, where the upcoming choice really is often unknown until an election is called.
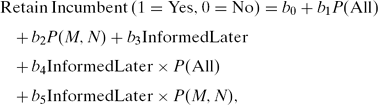
We therefore examine whether those learning “late” were as able as those learning “early” to incorporate overall incumbent performance into their retention decisions, or if instead they gave greater weight to payments awarded after they were induced to become attentive to incumbent performance. We note that if our financial incentives were too weak to encourage engagement, then the resulting lack of engagement would bias against finding differences across conditions, because all participants would presumably focus on the measure of incumbent performance least taxing to construct—end-round performance. To test these hypotheses, we formally describe our expectations. We estimate models where we predict a participant's decision to retain or discard an incumbent allocator as a function of the allocator's cumulative performance, denoted P(All); performance in “later” rounds, denoted P(M, N) for performance from round M to N, and our treatment intervention. Informed Later takes the value 0 for informed before round 1 and 1 for informed after round 12. Theoretically, we expect not an average effect of the treatment, but instead that becoming aware later will diminish the effect of overall average performance (P(All)) and increase the weight given to later performance (P(M,N)). In a regression framework, this model is written as
 $ \begin{eqnarray}
&&{\rm Retain\, Incumbent}\,(1 = {\rm Yes},0 = {\rm No}) = b_0 + b_1 P({\rm All}) \nonumber\\
&&\quad+\, b_2 P(M,{\rm }N) + b_3 {\rm InformedLater} \nonumber\\
&&\quad+\, b_4 {\rm InformedLater} \times P({\rm All})\nonumber\\
&&\quad +\, b_5 {\rm InformedLater} \times P(M,{\rm }N),
\end{eqnarray}
$
We have left unspecified the functions P(All) and P(M, N). We consider three measures of cumulative and late-term performance. The first is a linear average measure of performance, with P a(All) the average tokens awarded per period in rounds 1 to 16 and P da(13, 16) the average deviations in rounds 13 to 16 from that overall average. Higher measures of P a(All) imply, in expectation, a higher incumbent type. We calculate P da(13, 16) as deviations from that average because we want to know whether incumbents who over- or underperform in later periods relative to their average are treated differently. The second measure of performance we use is P c(), which is performance relative to the 1200-token cutpoint. P c(All) is 1 when average tokens awarded per period across all periods are greater than 1200 and 0 otherwise, whereas P c(13, 16) is 1 when average tokens awarded per period in rounds 13–16 are greater than 1200 and 0 otherwise. Finally, the third measure of performance is a binned specification of later round performance relative to earlier performance, P b(13, 16), which is less sensitive to outliers than P da(). P b(13, 16) is 1 when deviations in rounds 13–16 from a respondent's overall average payments, P a(All), are in the top tercile, −1 when they are the bottom tercile, and 0 otherwise. Positive values of P b(13, 16) therefore indicate an allocator whose end round performance was in the top third relative to its average, whereas negative values indicate those allocators whose relative end-round performance was in the bottom third of the distribution.
As this model specification makes clear, we may find differences across treatment in the effect of either end-round or cumulative performance. Before proceeding to formal statistical analysis, we investigate these patterns graphically. To test for a greater effect of end-round performance when informed later, we compare the rates of retention for allocators whose end-round performance was in the top, bottom, or middle tercile (P b()) relative to their total performance. If end-round performance is given greater weight when informed later, once we account for overall average performance, those whose later-round performance was “lucky” (P b(13, 16) = 1) should be retained at higher rates than those whose later-round performance was “unlucky” (P b(13, 16) = −1).Footnote 23
In Figure 4, we present these results by the round in which we informed participants about their upcoming choice. We plot the probability of retaining the allocator (vertical axis) by average payments across all 16 periods (the horizontal axis). The top panel displays the results for those informed before round 1. As expected, it shows no consistent sign of overweighting later payments: “Lucky” participants with top-tercile end payments (solid line) retained their allocators at rates similar to “unlucky” ones with bottom-tercile end payments (dashed line), with middle-tercile end payments somewhere in between (dotted line). The lines are similar and converge at the average incumbent type of 1200.
Experiment 1, Effect of Payments in Final Four Rounds on Retention Rate by Instructions Round and by Average Payments in Rounds 1 to 16
Notes: Using local polynomial fits like those shown in Figure 2, this figure presents the proportion of respondents retaining their allocators (vertical axis) by average allocator payments in rounds 1 to 16 (horizontal axis). This relationship is presented separately for two randomized interventions: whether respondents were informed of their upcoming opportunity to discard or keep their initial allocator before the 1st round or after the 12th round. In each panel, we separately plot this relationship by terciles of average deviations in the final four rounds. The bottom panel shows that those who learned in round 12 about the upcoming round-16 retention decision overweighted later-round payments relative to their average payments in rounds 1 to 16: the solid line denoting a lucky final four rounds is consistently above the dashed and dotted lines denoting an unlucky and middling final four rounds. By contrast, those receiving instructions before round one (top panel) were not unduly influenced by payments in rounds 13 to 16. Plotted N for the two interventions is 72, 61, and 72 (bottom, middle, top tercile, top panel), and 147, 133, and 138 (bottom, middle, top tercile, bottom panel).

When participants learned about the election later, however, we do see evidence of overweighting later-round performance. In the bottom panel, “Lucky” participants whose average payment deviations in rounds 13–16 were in the top tercile are between 10 and 20 percentage points more likely to retain their incumbent allocator than “unlucky” and middling participants whose average award in those rounds was in the bottom or middle tercile relative to their overall average (dashed and dotted lines). This pattern is consistent across the entire range of average allocator payments. Substantively, this result means that when these individuals became aware of a future choice late in the game, they were apparently unable to recollect accurately information presented very recently, and instead relied disproportionately on information presented after they learned of the upcoming choice.Footnote 24
This graphical analysis is limited because it does not permit calculations of statistical significance and collapses a range of end-range performance into only three categories. We now demonstrate that similar results hold in formal statistical analysis. Using OLS and probit regressions, Table 1 present estimates from Equation (1) for the three separate definitions of incumbent performance introduced earlier.Footnote 25 In column (1), we report estimates using the cutpoint definition of incumbent performance relative to the 1200-token threshold. The coefficient (b 1) on Average1–16 > 1200 is a positive and statistically significant 0.240, indicating that on average an allocator who provides more than 1200 tokens is 24 percentage points more likely to be retained than one who allocates less than that amount. Additionally, the coefficient (b 2) on Average13–16 > 1200 is 0.066 but is not statistically significant. The point estimates suggest that, after overall performance is accounted for, an allocator who awards more than 1200 tokens in rounds 13–16 is about 6.5 percentage points more likely to be retained.
Experiment 1, Predicting Incumbent Allocator Retention by Instructions Round

Notes: Variables labeled average payment deviations in subset of rounds measure the average deviation in these rounds from the average payments in rounds 1 to 16. All coefficient significance tests are one-tailed. Standard errors in brackets.
*significant at 10%; **significant at 5%; ***significant at 1%.
Theoretically, however, we are more interested in whether the effect of the average and end-round performance varies with when a participant became aware of the upcoming election. In this specification, these coefficients are in the predicted direction but not statistically significant. The coefficient (b 4) on the interaction between InformedLater and overall performance is −0.047, but is not statistically significant (p < .30, one-tailed). The point estimate suggests that the effect of whether total average payments are above 1200 is depressed slightly for those learning later. Similarly, the coefficient (b 4) for the interaction between InformedLater and later round performance is a positive 0.043, but also is not statistically significant (p < .32, one-tailed).
Given that not all respondents seem to have adopted the 1200-token cutpoint, we also considered specifications with a continuous measure of overall average performance (P a(All)) and two different measures of later-period deviations from average performance. In column (2), we present a model where later-term performance is calculated as the average deviation in periods 13–16 from the total average (P da(13, 16)), and in column (3), it is calculated as the same deviations categorized into tercile bins (P b(13, 16)). In these specifications, the estimates of b 5 provide stronger evidence that informing participants later about the election induces end bias. Per the column (2) specification, a positive 100-token average deviation from the overall average increases an allocator's retention rate by an additional 2.8% (p < .10, one-tailed test) when the participant is informed later, and in column (3), employing the binned specification, the effect of being in the top rather than middle tercile increases the allocator's retention rate by an additional 7.2% (p < .05) when the participant is informed later. In corresponding models estimated using Probit (columns (5) and (6)), indications of statistical significance are more favorable. In contrast, in these specifications, there is no evidence that the effect of total average performance varies when a respondent in informed later; b 4 is positive but close to zero.Footnote 26
To put these numbers about the effect of end-round payments in perspective, we focus on the column (2) specification and consider different payment streams for a participant informed after round 12. Suppose a player's allocator kept its average award constant, but gave out 800 more tokens in rounds 13–16 and 800 fewer tokens in rounds 1–12. By this specification, this would increase the allocator's retention by about 7.0 percentage points.Footnote 27 To achieve the same 7.0-point increase in retention rate without changing payments in rounds 13 to 16 would require increasing the overall payment stream by about 1470 tokens.Footnote 28 So when a participant is made aware later, a token paid late rather than early is worth about 1.8 tokens in earlier periods.
Altogether, these results point to a basic limitation in people's ability to retrospect accurately. With a relatively straightforward task—evaluating an allocator after 16 periods compared to a defined alternative when there is a clear link between the allocator's type and performance—individuals did not exhibit a great deal of bias toward recent events in evaluating an incumbent. However, when we presented the timing and nature of the choice later in the stream of information, participants relied somewhat more on information presented to them closer to that decision. A limitation is that our estimates of end bias are imprecise and sensitive to model specification, suggesting that our analysis is somewhat underpowered. Nonetheless, our findings show that, in the absence of full attention to the nature and timing of a choice, people do not seem to retain a cumulative measure of incumbent performance. Further, when participants do focus on the choice, they cannot reconstruct this average from memory even though they saw the information only moments earlier, and instead substitute a suboptimal attribute—performance after learning of the task—to guide the decision. Our finding thus provides one explanation for a long-observed regularity in democratic elections, one that raises concerns about voters’ abilities to hold politicians accountable.
Experiment 2: Irrelevant Information
Our experimental framework also allows us to study another potential source of bias—how voters respond to irrelevant but salient information when evaluating an incumbent. Random and uncontrollable events, such as droughts, hurricanes, shark attacks, and even sporting event outcomes appear to influence voters’ decisions to retain incumbent politicians (Achen and Bartels Reference Achen and Bartels2004a; Cole, Healy, and Werker Reference Cole, Healy and Werker2011; Healy, Malhotra, and Mo Reference Healy, Malhotra and Mo2010).Footnote 29 Analyzing presidential elections from 1896 through 2000, for example, Achen and Bartels (Reference Achen and Bartels2004a) find that moderate deviations from ideal moisture levels in a state decrease the incumbent president's party's vote share by 0.7 percentage points, whereas extreme droughts or wet spells decrease it by about 1.5 percentage points. In broad strokes, these findings show that voters seem to incorporate into their retrospective evaluations information that is arguably irrelevant to understanding the competence and effort of incumbent politicians.
Although these random events appear to influence voters, we do not know why. One possibility is that voters hold incumbents responsible for those events because they believe incumbents could have prevented them or could have sought to ameliorate their effects. In the event of a damaging flood, for instance, voters may believe that the incumbent could have invested more heavily in flood prevention or provided more effective disaster assistance (Gasper and Reeves Reference Gasper and Reeves2011; Healy and Malhotra Reference Healy and Malhotra2010). A second possibility is that voters may know the incumbent is not responsible for a bad event, but may be unable to take that information into account when making a decision. In particular, when random events affect material well-being or some other outcome a voter cares about, those effects may alter voter decisions on the basis of those proxies. For example, if a flood reduces income, voters probably cannot readily discern how much of the reduction stems from the unpredictable flood and how much stems from the incumbent's general management of the economy. In this case, the voter's problem is one of signal extraction: Because distinguishing the incumbent's responsibility for shocks in income relative to all other events is exceedingly difficult, rational voters may still rely on the combined signal even knowing it is affected by (many) uncontrollable events.Footnote 30 Rational voters act on the basis of a knowingly imperfect heuristic because doing otherwise is too costly.
In the first of these explanations, voters think incumbents are responsible for preventing and/or responding successfully to unpredictable events. In the second, voters only attribute blame or reward for unpredictable events because they lack distinct signals. We consider a third explanation: The observed behavior arises from intrinsic limitations in humans’ capacity for retrospective evaluation. Voters may hold incumbents accountable for uncontrolled events even when they believe the incumbent is not responsible (for the event or its correction) and even when they receive distinct signals. Voters may lack the ability to isolate information about incumbent performance from unrelated information (see Baddeley Reference Baddeley1992 on the limitations of working memory). In particular, individuals cannot mentally retain separate measures of incumbent performance and other outcomes. This “contamination” may also originate in the effect of emotional states on decision making. In particular, random events such as disasters may influence mood, which in turn influences how voters evaluate incumbents.Footnote 31 Researchers have found that people often transfer emotions in one domain to evaluations and judgments in a separate domain (Forgas Reference Forgas, Frijda, Manstead and Bem2000).Footnote 32 Regardless of the mechanism, this third possibility implies that voters’ retrospective abilities are sufficiently limited so that they punish incumbents for uncontrollable events even under conditions where attribution of responsibility is clear—that is, the outcome is clearly not something the incumbent can affect and it is presented separately from the incumbent's contribution to voter welfare.
To assess this third explanation, we conducted a second experiment in which we examined whether a separate income shock influences participants’ decisions to retain or replace their incumbent allocator even when we made it clear that the allocator bore no responsibility for that shock. We started with the same basic setup as in experiment 1, except that we informed all participants before round 1 that they would make an evaluation of an incumbent after round 16. We also informed participants at that time that they would participate in a lottery in either round 8 or 16, which we assigned with probability 0.5. We stated that, when the lottery took place, they would be randomly awarded 5000 tokens with probability 0.3, be awarded 0 tokens with probability 0.4, or lose 5000 tokens with probability 0.3. A total of 1,003 subjects participated in experiment 2.
Like the real-world disasters studied previously, our lottery simulates a random shock to income before an election. We took two steps, however, to remove other explanations for the influence of these shocks. First, to avoid problems of signal extraction, we presented the lottery payment and the allocator's payment separately and on different parts of the web page on which we presented the experiment. In a round with a lottery, participants saw that their allocator had paid them, for example, 1248 tokens, and then that they participated in a lottery in which they won 5000 tokens. Second, we told participants that the lottery payments were unrelated to their allocator's type, so that the participant would have no reason to act on the lottery in evaluating the incumbent. We did this twice. This statement initially appeared in bold face as the last sentence of the instructions page from before period 1 describing the lottery. We then repeated this information when the lottery outcome was revealed. Specifically, above their lottery payout, in bold face, was this statement: “Your payouts from the lottery are unrelated to your Allocator's type.”
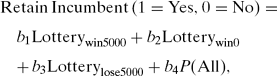
Despite these elements of our design, we find that the lottery outcome affected participants’ decision to retain or discard their allocators. To demonstrate this, we first present findings for the three lottery payout conditions (+5000, 0, or −5000) pooled across when the payments were awarded (in round 8 or 16). In a regression framework, this model is written as
 $ \begin{eqnarray}
&&{\rm Retain\, Incumbent}\,(1 = {\rm Yes},0 = {\rm No}) = \nonumber\\
&&\quad b_1 {\rm Lottery}_{{\rm win}5000} + b_2 {\rm Lottery}_{{\rm win}0}\nonumber\\
&&\quad +\, b_3 {\rm Lottery}_{{\rm lose}5000} + b_4 P({\rm All}),
\end{eqnarray}
$
The left panel of Figure 5 displays the average retention rate for these three conditions with 95% confidence intervals, setting aside average payments because they are orthogonal to treatment. On average, participants who won 5000 tokens retained their allocators at a rate of 0.79 (79% of the time), higher than the 0.70 rate in the 0 lottery condition and the 0.66 rate in the −5000 condition (5000 vs. 0 and 5000 vs. −5000, p < .01 for tests of proportions, 0 versus −5000, p < .38). The right panel of Figure 5 presents the average retention rate for each lottery payout separately by when the lottery took place (round 8 or 16). In addition to confirming the influence of the lottery outcome on participants’ retention decisions, these data reveal two other patterns. First, the lottery may have had a greater influence on participants when it occurred just before they decided to retain their allocator. The difference in retention rates between winning 5000 tokens rather than losing that amount is 0.15 in round 16 but only 0.10 in round 8, but this difference in differences is not statistically significant (p < .52). Second, winning matters more than losing. Participants who lost 5000 in rounds 8 and 16 retained their incumbents at rates of 0.67 and 0.66, respectively, only marginally lower than those who received 0 tokens, which were 0.72 and 0.68, respectively. By contrast, winning 5000 tokens increased the probability that the incumbent was retained, relative to winning 0, by eight or ten percentage points in rounds 8 or 16.
Experiment 2, Effect of Lottery Winnings and Losses on Retention Rate
Notes: Each point is the observed proportion of participants who chose to keep their initial allocator after the 16th round, by lottery outcome. This figure shows that lottery outcomes influenced participant decisions to retain. Allocators are most likely to be retained when lottery payments are positive, less likely to be retained when they are zero, and least likely to be retained when they are negative. Ninety-five percent confidence intervals are calculated based on the variability of a sample proportion given the observed retention rate and the count of participants in each intervention. For the left panel, N from top to bottom is 309, 405, and 289, respectively. For the right panel, it is 145, 164, 211, 194, 139, and 150, respectively.

We also find that the lottery outcome affected participants’ retention decisions across the entire range of allocator payments. In Figure 6, we present allocator retention rates (vertical axis) for lottery winners (the solid line), losers (the dashed line), and those without a lottery payment (dotted line) in either lottery round by the average payout in rounds 1–16 (the horizontal axis). This tendency to judge incumbents on lottery outcomes is consistent across the range of average allocator payouts. Those who won 5000 tokens retained their allocators at higher rates than those who lost 5000 or neither won nor lost, even when their average payout was less than 1200 tokens. We again see that winning seems to influence behavior more than does losing. The regression analysis presented in Table A.2 in the Online Appendix confirms this graphical presentation: Using both the average and cutpoint measures of overall incumbent performance and both OLS and probit regressions, we find that winning the lottery rather than losing it increases participants’ retention rates by about 12 percentage points.Footnote 33
Experiment 2, Effect of Lottery Winnings and Losses on Retention Rate by Average Payments in Rounds 1 to 16
Notes: Using local polynomial fits like those shown in Figure 2, this figure presents the proportion of respondents retaining their allocators (vertical axis) by average allocator payments in rounds 1 to 16 (horizontal axis). The relationship between average payments and the retention decision is plotted separately by lottery payment. This figure shows that lottery winners retained their allocators at higher rates than did lottery losers across all average payment levels. N = 309 (solid), 405 (dotted), and 289 (dashed).

To assess the robustness of this result, we undertook a replication of this experiment in which we verified that participants understood (1) the relationship between allocator type and average payments and (2) that the lottery outcome was unrelated to the allocator's type.Footnote 34 When we restrict our analysis of the effect of the lottery to those who demonstrated understanding of both concepts, we continue to find that the lottery has a statistically significant effect on the decision to retain or discard the allocator (although the magnitude of this effect is reduced). This demonstrates that those who were attentive to the task at hand and understood the nature of the game nonetheless exhibited the bias we seek to understand. (This analysis appears in Tables A.7 and A.8 in the Online Appendix.)
Additionally, in the replication, we also varied the stakes in the experiment, paying 25% of participants twice as much, per token, as our original participants. These results allow us to assess whether our earlier results are due to the relatively small stakes involved. We find that the behavior of those playing for larger stakes is not distinguishable from that of those playing for smaller amounts. In our replication of experiment 2, we find that winning 5000 tokens versus losing 5000 tokens in the lottery (we eliminated the zero lottery condition in this replication for statistical power) increased the probability that the allocator was retained by 12.3 percentage points (column (3), Online Appendix Table A.7), controlling for overall average payments. For those assigned to receive twice as many dollars per token, the effect of the lottery was larger but not statistically different from those with lower stakes. We also find that those in the higher-stakes condition did not respond more to total average payments (the coefficient on the interaction of average payments and higher stakes is 0.013, with a standard error of 0.016).
Finally, in reanalysis of our original data, we considered the possibility that our results arose only because subjects paid little attention to the game, clicking through the screens quickly and only remembering the tokens they received, regardless of their source. To do so, we examined whether the lottery effect increased among those who finished the game quickly or decreased among those who took their time, but found no change in the effect. Participants took an average of 4 minutes to reach the retention decision. We examined the lottery effect in the top, middle, and bottom thirds of the time to this decision. The lottery effect appeared to be larger among the slowest third, not smaller, as the attentiveness alternative explanation would predict, although these differences are generally not statistically significant. We present these results in Online Appendix Table A.4.
In sum, experiment 2 supports the view that irrelevant events influence citizens’ evaluation of incumbents. Moreover, it shows that this influence seems to remain even when the consequences of the irrelevant event, such as a random lottery, are isolated from measures of incumbent performance and when participants are explicitly notified that the outcome of the random event is unaffected by the allocator's performance. The continuing influence of the lottery on the retention decision has implications for our understanding of why voters appear to respond to irrelevant information when evaluating incumbent politicians. We attempt to exclude by design the possibility that our participants might rationally blame the incumbent for the outcome or be unable to isolate that outcome from other measures of incumbent performance. If we succeeded, then our evidence again points to limitations in people's ability to accurately retrospect—in this case, their inability to ignore irrelevant information when evaluating a stream of performance data about an incumbent.
Experiment 3: Influence of Rhetoric
In our third experiment, we investigate whether political rhetoric can influence the information people use to assess an incumbent politician's performance. During campaigns, candidates can emphasize different aspects of performance. When campaigning against the incumbent President Jimmy Carter in the 1980 election, for instance, Ronald Reagan famously asked, “Are you better off now than you were four years ago?” His question may have prompted voters to compare their cumulative experience under Carter to where they stood at the end of the previous of administration. By contrast, in his 1960 campaign, John F. Kennedy told voters, “The question you have to decide on November 8 is, is it good enough? Are you satisfied?” His question asked voters to consider their current conditions. In our experiments, the incentive is always to focus on the full set of payments. Can a question focusing on one potential decision rule over another change the weight participants give to payments received at different points in time?
In an intriguing set of experiments on nonpolitical retrospective assessments, Zauberman, Diehl, and Ariely (Reference Zauberman, Diehl and Ariely2006) found that this type of priming shaped evaluations. In one study, they showed participants factory defect rates from a production line and then asked them for evaluations using one of two questions. The first was similar to Kennedy's, which they called the hedonic question: “Looking back at information you just observed, how satisfied are you with the average rejection rate of production line A over the past year?” The second was more similar to Reagan's, which they called the informational question: “Looking back at the information you just observed, what was the average rejection rate of production line A over the past year?” The hedonic prime, they reasoned, may induce end bias by focusing attention on contemporaneous satisfaction (an end-state, much like current pain or pleasure), whereas the informational prime encourages reflection on the entire set of defect rates. Consistent with this expectation, they found that defect rates at the end of the year influenced evaluations more in the hedonic condition than in the informational condition.Footnote 35
Following a similar approach, in our third experiment we primed participants with informational or hedonic questions immediately prior to the retention decision. We used the same structure as in experiments 1 and 2, informing all participants about their future retention choice before round 1. The experiment 3 intervention occurs after round 16 payments are awarded, but before the choice to keep or replace the current allocator. We assigned participants with equal probability to one of three conditions. In the control condition, participants proceeded directly to the retention choice, as in the other two experiments. In the hedonic condition, we asked, “Looking back over the first 16 rounds, how satisfied were you with your Allocator?” with five closed-end responses ranging from “very satisfied” to “very unsatisfied.” After answering that question, participants proceeded to the retention decision. Finally, in the informational intervention, we asked, “Looking back at the tokens you received, what would you estimate was the average amount given to you by your Allocator during each of the first 16 rounds?” and presented an open-end text box in which participants could type a response. After answering that question they proceeded to the retention decision.
Our analysis of data from this experiment is similar in form to our analysis of experiment 1. Our two treatments are Hedonic and No Prime (the excluded category is the Informational prime), and our theoretical expectation is that relative to the Informational prime, those who received the Hedonic prime should give more weight to end round performance and less weight to overall average performance. Formally, we estimate the model,
 $ \begin{eqnarray}
&&{\rm Retain}\,{\rm Incumbent}\,(1 = {\rm Yes},0 = {\rm No}) = b_0 + b_1 P({\rm All})\nonumber\\
&&\quad +\, b_2 P(M,N) + b_3 {\rm Hedonic} + b_4 {\rm NoPrime}\nonumber\\
&&\quad +\, b_5 {\rm Hedonic} \times P({\rm All}) + b_6 {\rm NoPrime} \times P({\rm All}) \nonumber\\
&&\quad+\, b_7 {\rm Hedonic} \times P(M,N) + b_8 {\rm NoPrime} \times P(M,N), \nonumber\\
\end{eqnarray}
$
We note that in this experiment we told all respondents before round 1 about the upcoming choice and presented them with a clear and incentivized decision that merited attention to average payments across all rounds. Additionally, because our treatment is a single question of no actual consequence (against an incentivized decision and payment stream), we argue this experiment presents a difficult case to detect the effects of rhetoric. In actual election campaigns, in contrast, candidates often repeat their rhetorical arguments with far greater frequency and there is no ex ante correct way to choose among those claims. Nonetheless, the two primes do appear to have caused participants to give somewhat different weight to both average payments and payments in later periods.
Although our parameter estimates are imprecise, we find some evidence that rhetoric can influence decision-making. We being with a graphical presentation of our data in Figure 7, which presents local polynomial fits of the probability of retention (vertical axis) against average payments in rounds 1–16 (the horizontal axis). As before, we do so separately by terciles of deviations in rounds 13–16 from overall average payments. We plot separate local polynomial fits for participants with large positive deviations (“lucky,” solid line), large negative deviations (“unlucky,” dashed line), and middling deviations (“middling,” dotted line). In the top panel, the hedonic prime case, we see suggestive evidence that allocators whose later round performance was superior to their overall performance are more likely to be retained than allocators whose later round performance was below their average or consistent with that average. Across the entire range of average payouts, the solid line is consistently above the dashed line, with an average gap of about 5 percentage points. As in experiment 1, those whose had an allocator with later round performance close to their total average (middling, the dotted line) seem to behave similarly to those who had an allocator who performed below type (unlucky, dashed line). In contrast, participants assigned to the informational prime (middle frame) showed no consistent differences between above- and below-average payments in rounds 13–16: The solid and dashed lines overlap for average payments below 1200 and are very close together above that number. Finally, those in the no prime condition appear to exhibit, relative to the informational prime, a degree of end bias that is similar to that exhibited by those in the hedonic prime condition, although not for lower levels of average allocator payments.
Experiment 3, Effect of Payments in Final Four Rounds on Retention Rate by Prime and by Average Payments in Rounds 1 to 16
Notes: Using local polynomial fits like those shown in Figure 4, this figure presents the proportion of respondents retaining their allocators (vertical axis) by average allocator payments in rounds 1 to 16 (horizontal axis). Each panel presents this relationship for a priming condition (the random intervention), and presents them separately by terciles of average deviations in the final four rounds. The figure suggests that under the hedonic prime condition (top panel), those who received later-round payments that were much above their average payments in rounds 1 to 16 (solid line) retained their allocators at higher rates than those who received later payments much below or near their average in rounds 1 to 16 (dashed and dotted lines). In contrast, those in the informational prime condition (middle panel) and the no prime condition (bottom panel) were not unduly influenced by later-round payments. Plotted N for the three interventions is 113, 116, and 115 (bottom, middle, top tercile, top panel), 117, 108, and 110 (bottom, middle, top tercile, middle panel), and 111, 117, and 117 (bottom, middle, top tercile, bottom panel).

It therefore seems that the hedonic prime, which simply asked participants to consider how satisfied they were with their allocators before making a retention decision, led participants to weight the most recent rounds more heavily than an informational prime focusing on total average payments. Figure A.2 in the Online Appendix provides evidence that the informational condition may also have resulted in an increase in the weight given to cumulative average performance relative to participants assigned to the hedonic or no prime conditions. To investigate this pattern further, Table 2 presents regression models estimated using Equation (2) to examine the effect of the priming interventions. As before, we present results using three separate measures of average and end-round performance. Results are displayed for estimates from models using the 1200 token cutpoint (column (1)), the continuous measure of average performance and later round deviations from that average (column (2)), and the binned tercile deviations from that average as used in the graphical presentation (column (3)), with parallel models using probit in columns (4) through (6).
Experiment 3, Predicting Incumbent Allocator Retention by Prime

Notes: Variables labeled average payment deviations in subset of rounds measure the average deviation in these rounds from the average payments in rounds 1 to 16. Excluded category is informational prime. All coefficient significance tests are one-tailed. Standard errors in brackets.
*significant at 10%; **significant at 5%; ***significant at 1%.
In all six models in Table 2, the coefficients are in the predicted direction—the hedonic prime seems to increase the weight given to later round performance and decrease the weight given to overall average performance—but indications of statistical significance are mixed. Per the column (1) and (4) specifications, for example, the hedonic prime decreases the effect of whether the cumulative average is above 1200 by about half, with a one-sided p-value less than .10 in column (1) and .09 in column (4). In columns (2), (3), (5), and (6), which employ the continuous measure of average performance, the coefficients imply that the hedonic intervention decreased the effect of average performance by between a quarter and a third, and the relevant p-values (one-tailed tests) are, respectively, .12, .12, .09, and .09. Although we focus here for theoretical reasons on the comparison of the hedonic and informational conditions, the no prime condition also appears to have generated behavior very similar to the hedonic prime, depressing the effect of average performance by an even larger degree than the informational prime.Footnote 36
Turning from total average payments to later-round payments, the point estimates are in the expected direction in all six columns of Table 2, but they are imprecisely estimated. Relative to the informational prime, the hedonic prime approximately doubles the effect of later-round performance for each measure. For example, in column (1), once one accounts for whether the overall average is above 1200, if the average in rounds 13–16 is above 1200 it is predicted to increase the probability that the allocator is retained by about 7.8 percentage points in the informational prime case. That number doubles to 15.8 in the hedonic prime case, but the p-value of that increase is .16 (one-tailed), and the same specification estimated using probit in column (4) yields a p-value of .19. In the remaining columns, the p-values on the interaction of the hedonic prime and the measure of later round performance are .27 (column (2)), .34 (3), .29 (5), and .34 (6). The no prime condition exhibits inconsistent effects. In all cases, it appears to increase the effect of end-round performance relative to the informational prime, but none of these figures approaches statistical significance, and the magnitudes of the effects are often smaller than the effect of the hedonic prime.
We use the column (2) estimates to put these results into context. In that specification, increasing the average number of tokens awarded by an allocator from 1100 to 1200 would increase the probability that the allocator is retained by 17.2 percentage points in the informational condition, but only 6.2 points in the hedonic prime case. In the informational prime case, each end-round token is worth about 1/3 of an overall average token,Footnote 37 whereas in the hedonic case, it is worth about 1.3 average tokens.Footnote 38 Finally, if we think about the effect of shifting tokens from earlier to later rounds, the same comparison we performed for experiment 1, shifting 800 tokens in payments from round 1–12 to 13–16 would increase the probability that the allocator is retained by 1.6 percentage points in the informational case, and 4 points in the hedonic case (as we noted earlier, this last comparison is not statistically significant).Footnote 39 In the supplemental Online Appendix, we also show similar results when we employ different definitions of late rounds.
In sum, these results suggest that rhetorical choices by candidates, media, and other political discussants may modify the way voters respond to a stream of information about incumbent performance. The imprecision of our estimates calls for replication with larger samples. This caution aside, participants deviated from optimal behavior even in our transparent, simple, and incentivized game. Moreover, the intervention of a couple dozen words seems to have exacerbated these deviations.
DISCUSSION AND CONCLUSION
Given citizens’ limited incentives to attend to public affairs (Downs Reference Downs1957), scholars have argued that retrospective voting provides an efficient option for controlling politicians. In this article, we presented the results of three experiments on citizens’ ability to retrospect accurately about performance. We conducted these experiments using an incentivized game that mimicked elements of real world elections, but in a simplified form that should have made retrospective voting notably easier. This approach allows us to eliminate potential confounding explanations for observed deviations from optimal retrospective decision-making in real elections. Nonetheless, we find evidence of three important deviations from optimal retrospection, replicating deviations researchers have found in observational studies without experimental controls: participants overweighted recent performance when made aware of the choice to retain an incumbent closer to election rather than distant from it (experiment 1), allowed unrelated events that affected their welfare to influence evaluations of incumbents (experiment 2), and were influenced by rhetoric to focus less on cumulative incumbent performance (experiment 3). The results of experiment 2 are most clear, whereas analysis of experiments 1 and 3 demonstrate greater imprecision in statistical estimates.
These findings have important implications and point to areas of focus for subsequent research. In particular, they indicate that biases in retrospection do not originate solely in the complexity of the real world. Despite eliminating many factors that might exacerbate errors in decision-making (uncertainty about the relative value of information about incumbent performance arriving at different points in time, the pooling of signals about incumbent performance with information about unrelated information, etc.), we nevertheless found deviations from optimal retrospective decision-making. Our results, therefore, imply that deviations arise from limitations in humans’ ability to retrospect about performance—a worrisome finding for democratic accountability.
We note that this conclusion requires an assumption: We infer participants’ limitations from their behavior, when in fact we observe only their tendencies in the simplified setting of our experiment. Citizens may not lack these abilities in all circumstances. Of course, voting in large elections in modern democratic states is more complex. Moreover, compared to our game, incentives to cast informed votes may be even weaker in mass elections because of the negligible probability of casting a decisive vote. These arguments imply that the tendencies we observe in the experimental setting may be more widespread outside of the research setting.
The argument that retrospective voting is efficient is based in part on the assumption that retrospective voting is relatively easy. As Fiorina (Reference Fiorina1981, 5) put it, “[Citizens] need not know the precise economic or foreign policies of the incumbent administration in order to see or feel the results of those policies. . . . In order to ascertain whether the incumbents have performed poorly or well, citizens need only calculate the changes in their own welfare.” Given the biases we find, retrospective voting seems more challenging for citizens than is sometimes assumed.
Indeed, the tendency to exhibit these biases in the experimental setting may explain, in part, why incumbents embrace certain governing and campaign strategies. For example, experiments 1 and 3 imply that manipulating the election-year economy (Achen and Bartels Reference Achen and Bartels2004b; Tufte Reference Tufte1978) and directing campaign rhetoric on the here and now improve an incumbent's odds of reelection, regardless of cumulative performance. Similarly, experiment 2 suggests that incumbents who surround themselves with symbols of good times (e.g., winning sports teams, babies, etc.) may do so because voters are unable to separate their evaluations of an incumbent from information about other outcomes.
Ideally, our findings would point to potential cures for these biases, cures that could facilitate democratic accountability. The experiment about irrelevant events, however, implies that correcting retrospective biases may not be easy. That experiment suggests that neither uncertainty about an incumbent's responsibility nor difficulties in signal extraction are necessary to explain the influence of irrelevant events. Thus, policies that clarify incumbent responsibility or provide distinct signals may not improve citizens’ judgments. Similarly, rhetorical interventions seem to have effects on how incumbents are evaluated even in a highly simplified environment with right and wrong answers about retention, and a clear linkage between incumbent performance and participant well-being.
Other interventions, however, may be more successful. For example, would voters be less responsive to these unrelated events or rhetoric if they were juxtaposed with a measure of cumulative incumbent performance (e.g., the real-world equivalent of presenting our participants with average payouts when they were deciding to retain or discard their allocators)? In the experimental setting, would this type of intervention mitigate the influence of later knowledge about a future decision task (experiment 1) or priming (experiment 3)? Before proposing that media and other information sources provide these (or other) correctives for voter inattentiveness and campaign rhetoric, it would be wise to first investigate their effectiveness. Our experiments provide a framework for doing so.
More generally, the design we use of a stylized and incentivized election game offers promise for investigating many other influences on decision-making. For example, although we have focused on retrospective evaluations, one could consider how participants behave when candidates make promises about future performance that they may or may not meet. Alternatively, is a focus on recent events exacerbated by differences in (induced) emotional states or by placing participants under cognitive loads? By building on our basic design, future research can rule out many alternative explanations that confound observational research.
Of course, our existing experiments are not without their limitations. We cannot verify that the payments induced careful attention among all participants, and our results are subject to concerns about experimental-demand effects. Given the imprecision of some estimates, we cannot always reject the null of no effect at standard levels of significance. We have replicated the results of our lottery experiment, but replications using other subject recruitment pools and a better understanding of participants’ comprehension and engagement with the decision task at hand would further allay concerns. Nonetheless, our key results are an important contribution: Citizens deviate from optimal retrospection even in an experimental setting that promotes optimal retrospective behavior without distractions or confounders. We show that end bias in retrospective evaluations can be enhanced by rhetoric or variation in induced attentiveness, documenting in an experimental setting a common finding in the empirical analysis of elections. Similarly, we find that irrelevant events influence participants in our games even when they should not, replicating an alleged effect found in actual elections. In sum, our experiments reveal that some of the biases apparent in citizen evaluations of incumbents are not caused solely by the complexity of the political world, pointing instead to inherent limits in citizens’ ability to motivate incumbent performance.
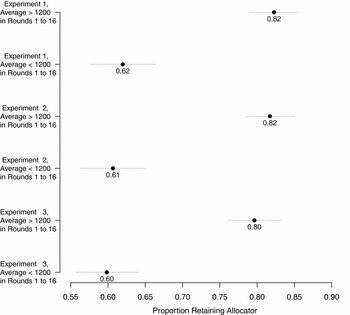
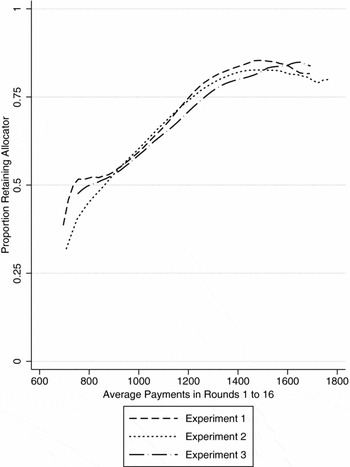
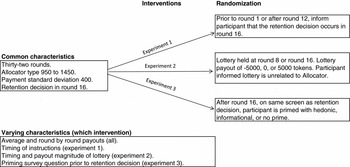
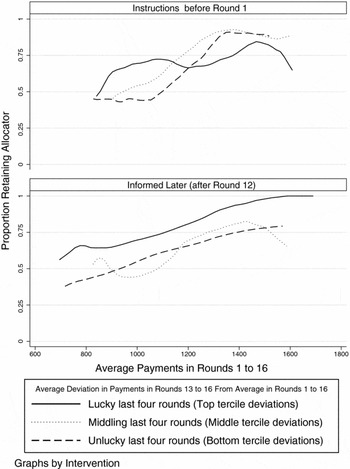
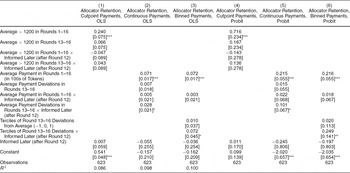
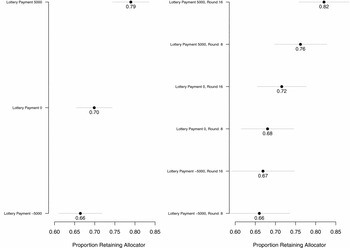
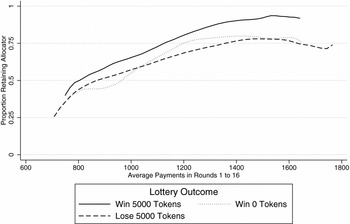
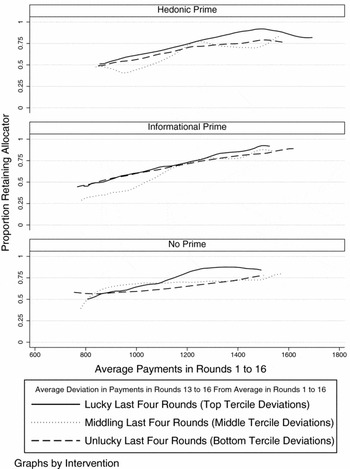
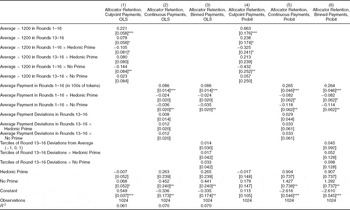




Comments
No Comments have been published for this article.