INTRODUCTION
Cassava (Manihot esculenta Crantz) is one of the most important food sources in the world, providing energy to around 800 million people, mainly in the tropics (Ceballos et al. Reference Ceballos, Okogbenin, Pérez, López-Lavalle, Debouck and Bradshaw2010; FAO 2013; Khumaida et al. Reference Khumaida, Ardie, Dianasari and Syukur2015). The species can be adapted to adverse climatic conditions, especially in regions with low rainfall levels and low fertility soils, thus making the crop essential for communities living in these regions (Nwokoro et al. Reference Nwokoro, Orheruata and Ordiah2002) and serving as an excellent agricultural alternative to meet the growing global demand for food (Soto et al. Reference Soto, Ortiz, Perlaza-Jiménez, Vásquez, Lopez-Lavalle, Mathew, Léon, Bernal, Ballvora and López2015).
Cassava is produced throughout Brazil but mainly in the north and northeast regions, using different crop production systems and landraces, which generally present low yield potential. One of the most surprising characteristics of cassava is its wide range of moisture tolerance from high rainfall in the Amazon to regions with a large water deficit such as the semi-arid areas of the Brazilian Northeast. In addition to the consumption of roots, industrial demand for cassava starch is very high (Jansson et al. Reference Jansson, Westerbergh, Zhang, Hu and Sun2009) for use in the food, textile, pharmaceutical, paper, cosmetics, building materials and ethanol industries (Tonukari Reference Tonukari2004; Radhika et al. Reference Radhika, Sheela, Devi, Sreekumar, Kumar and Chakrabarti2014).
Cassava, like other crops, is affected by pests and diseases caused by bacteria, viruses, fungi, phytoplasmas and oomycetes (Soto et al. Reference Soto, Ortiz, Perlaza-Jiménez, Vásquez, Lopez-Lavalle, Mathew, Léon, Bernal, Ballvora and López2015). In Brazil, several diseases affect crop yield, such as cassava root rot (CRR), caused by a complex of soil pathogens (Bandyopadhyay et al. Reference Bandyopadhyay, Mwangi, Aigbe and Leslie2006; Alleyne et al. Reference Alleyne, Gilkes and Briggs2015; Vilas Boas et al. Reference Vilas Boas, Hohenfeld, Oliveira, Santos and de Oliveira2016), that can affect up to 100% of production. Among the most common soil pathogens related to root rot are: Fusarium oxysporum, Pythium sp., Rhizoctonia solani, Streptomyces saran and Scytalidium lignicola (Mazzola & Gu Reference Mazzola and Gu2002; Silva et al. Reference Silva, Medeiros, Bezerra, Silva, Barros and Santos2013; Barros et al. Reference Barros, Medeiros, Notaro, Moraes, Silva, Nascimento and Moreira2014). In Brazil, the most prevalent fungi are Phytophthora spp., commonly associated with cassava soft rot, and Fusarium spp., associated with cassava dry rot root, compromising 30–70% of production losses, respectively (Barros et al. Reference Barros, Medeiros, Notaro, Moraes, Silva, Nascimento and Moreira2014).
The search for resistant cassava varieties is one of the major objectives of breeding programmes (Bi et al. Reference Bi, Aileni and Zhang2010; Kaweesi et al. Reference Kaweesi, Kawuki, Kyaligonza, Baguma, Tusiime and Ferguson2014; Carmo et al. Reference Carmo, da Silva, Oliveira and de Oliveira2015; Hokanson et al. Reference Hokanson, Ellstrand, Dixon, Kulembeka, Olsen and Raybould2016; Vilas Boas et al. Reference Vilas Boas, Hohenfeld, Oliveira, Santos and de Oliveira2016) because it is a viable and low-cost alternative to chemical control, especially for low-income farmers. Chemical control is expensive and often inefficient, particularly for soil pathogens, as is the case of root rot disease. On the other hand, recent results indicate progress in the identification of sources of resistance to CRR (Vilas Boas et al. Reference Vilas Boas, Hohenfeld, Oliveira, Santos and de Oliveira2016).
A number of different breeding strategies have been proposed for the introduction of resistance in cassava in recent decades: such as the evaluation and selection of local varieties, introduction of germplasm, intra- and inter-specific hybridization, use of double haploids, genetic transformation and mutation, the main method of improvement used in cassava involves the crossing of contrasting genotypes and selection of the best individuals through clonal propagation (Ceballos et al. Reference Ceballos, Kulakow and Hershey2012, Reference Ceballos, Kawuki, Gracen, Yencho and Hershey2015; Oliveira et al. Reference Oliveira, Resende, Santos, Ferreira, Oliveira, Silva and Aguilar-Vildoso2012). However, it is necessary to use new breeding strategies to ensure higher and continuous genetic gains over succeeding breeding generations.
Molecular polymorphisms have been used to support conventional breeding, aimed at increasing the accuracy and precocity for selecting individuals of interest in order to minimize extensive phenotypic evaluations, which are usually costly and time-consuming (Mengistu et al. Reference Mengistu, Kidane, Catellani, Frascaroli, Fadda, Pè and Dell'Acqua2016). In cassava, molecular polymorphisms have been used to diagnose diseases, for analysis of genetic diversity, for determination of post-harvest physiological deterioration, for molecular-assisted selection and for genomic selection (Oliveira et al. Reference Oliveira, Resende, Santos, Ferreira, Oliveira, Silva and Aguilar-Vildoso2012, Reference Oliveira, Ferreira, Santos and Oliveira2014; Ceballos et al. Reference Ceballos, Kawuki, Gracen, Yencho and Hershey2015; Ferguson et al. Reference Ferguson, Koga, Johnson, Koga, Hirsch, Becerra López-Lavalle and Messier2015; Wolfe et al. Reference Wolfe, Rabbi, Egesi, Hamblin, Kawuki, Kulakow, Lozano, Carpio, Ramu and Jannink2016). From the molecular point of view, these studies have been increasingly accessible to diverse crops due to the important revolution in the development of high-performance, low-cost genotyping systems. Among these markers, single-nucleotide polymorphisms (SNPs) have become extremely popular in plant molecular genetic studies due to their abundance in the genome and automation in the genotyping process (Mammadov et al. Reference Mammadov, Aggarwal, Buyyarapu and Kumpatla2012).
Although there have been important methodological advances in the use of molecular markers in cassava breeding, little progress has been made in the association between the molecular polymorphism and the phenotypic resistance of germplasm to CRR disease. In contrast, associative mapping or the genome-wide association study (GWAS) has become the main method to identify genes associated with agronomic traits, especially those of complex nature, such as resistance to diseases (Iquira et al. Reference Iquira, Humira and François2015). In these studies, molecular polymorphisms provide information for the detection of genomic regions linked to quantitative traits and further allow for the exploration of natural or induced genetic variations (Elshire et al. Reference Elshire, Glaubitz, Sun, Poland, Kawamoto, Buckler and Mitchell2011; Poland & Rife Reference Poland and Rife2012; Dell'Acqua et al. Reference Dell'Acqua, Zuccolo, Tuna, Gianfranceschi and Pè2014; Rabbi et al. Reference Rabbi, Hamblin, Kumar, Gedil, Ikpan, Jannink and Kulakow2014).
Genome-wide association study is based on linkage disequilibrium (LD) and has become a promising strategy to identify genes associated with soil diseases in species such as soybean (Li et al. Reference Li, Guo, Niu, Wang, Cui, Sun, Zhao and Xing2016; Zhang et al. Reference Zhang, Song, Cregan and Jiang2016), maize (Zila et al. Reference Zila, Ogut, Romay, Gardner, Buckler and Holland2014), wheat (Zegeye et al. Reference Zegeye, Rasheed, Makdis, Badebo and Ogbonnaya2014; Zanke et al. Reference Zanke, Ling, Plieske, Kollers, Ebmeyer, Korzun, Argillier, Stiewe, Hinze, Neumann, Eichhorn, Polley, Jaenecke, Ganal and Röder2015; Arruda et al. Reference Arruda, Brown, Brown-Guedira, Krill, Thurber, Merrill, Foresman and Kolb2016), sugarcane (Singh et al. Reference Singh, Banerjee, Khan, Yadav, Kumar, Duttamajumder, Lal, Patel, Guo, Zhang and Paterson2016) and beans (Wu et al. Reference Wu, Wu, Xu, Wang, Lu and Li2015). It draws the most from historical recombination events to identify the genetic loci that control complex traits using high-density markers and that allow for the selection of parents to create segregant populations and the selection of highly significant SNPs for use as fixed effects on genomic selection models (Begum et al. Reference Begum, Spindel, Lalusin, Borromeo, Gregorio, Hernandez, Virk, Collard and McCouch2015).
Although the genetic diversity of cassava shows the wide natural phenotypic diversity that can be used in the genetic improvement of this species, progress in molecular breeding has been limited mainly to insufficient genomic studies (Rabbi et al. Reference Rabbi, Hamblin, Gedil, Kulakow, Ferguson, Ikpan, Ly and Jannink2015). Therefore, it is necessary to identify genomic regions associated with traits of greater interest in order to contribute to the selection of elite plants in breeding programmes. Therefore, the current work aimed to investigate the effect of molecular polymorphisms in resistance of cassava to root rot disease using GWAS. The evaluations were carried out in a set of diversified cassava accessions to provide a comprehensive view of the cassava population structure and its association with some agronomic traits in cassava. Additionally, genetic diversity, dynamics of LD and their effects on GWAS associated with resistance to root rot disease in cassava were analysed.
MATERIAL AND METHODS
Plant material
A total of 263 accessions were analysed, belonging to the Cassava Germplasm Bank (CGB) of Embrapa Mandioca e Fruticultura (Cruz da Almas – Bahia – Brazil), from Brazil (22 different states), as well as Colombia, Venezuela, Nigeria and Thailand. These accessions, composed of landraces and improved varieties, were genotyped and used in the evaluation of resistance to the damage caused by dry root rot (DRR), soft root rot (SRR) and black root rot (BRR) diseases in cassava (Supplementary Table S1).
Experimental design and phenotypic data
The roots used in the evaluation of resistance to damage caused by pathogens in root rot disease were from field trials that followed the cultural practices usually applied to cassava (Souza et al. Reference Souza, Farias, Mattos and Fukuda2006). The planting was carried out at the experimental station of Embrapa Mandioca e Fruticultura (Cruz da Almas – Bahia – Brazil) during the rainy season (March to August). The spacing used was 0·90 m between rows and 0·80 m between plants. Each plot constituted two rows with eight plants, totalling 16 plants per plot (Souza et al. Reference Souza, Farias, Mattos and Fukuda2006; Freitas et al. Reference Freitas, Santos and Oliveira2016; Vilas Boas et al. Reference Vilas Boas, Hohenfeld, Oliveira, Santos and de Oliveira2016). Assessments were done in the crop years of 2011, 2012 and 2013 (first and second halves (semesters) of 2011 and 2012 and second semester of 2013). These five evaluation periods were considered independent environments and a minimum of three environments was considered for each accession. The incomplete block design was used in five environments with one observation per plot. Planting was carried out on well-drained soils with no history of root rot disease.
Evaluations for root rot disease were carried out in 2011 and 2012 (first and second semesters) and 2013 (second semester). These five evaluation periods were considered independent environments and the number of evaluated genotypes varied within the seasons. The harvest was carried out manually between 10 and 12 months after planting and, for all trials, there was standardization regarding the size and shape of the roots (20–25 cm in length and 4–6 cm in diameter), respecting the intrinsic characteristics of each germplasm accession.
The isolates used in the inoculations were divided according to the pathogen group and symptoms produced in cassava roots, according to: DRR (Fusarium solani, F. oxysporum and Fusarium lateritium), SRR (Phytophthora dreschsleri and Phytophthora melonis) and BRR (Family Botryosphaeriaceae – Neoscytalidium hyalinum, Lasiodiplodia theobromae and Lasiodiplodia euphorbicola). A mix of the most aggressive isolates from each group of pathogens was used in the inoculations. The pathogen aggressiveness was previously identified by assessing disease severity in different cassava varieties using several DRR, SRR and BRR species, according to Vilas Boas et al. (Reference Vilas Boas, Hohenfeld, Oliveira, Santos and de Oliveira2016).
To identify sources of resistance to CRR disease, whole roots were washed and disinfected with sodium hypochlorite solution (1%). Subsequently, small holes (approximately 3–4 mm deep) were made in the middle of the roots. The fungi were grown on potato-dextrose agar and oomycetes in V8 medium modified with β-Sitosterol. After that, the roots were inoculated at the point of perforation with 100 µl of spore suspension adjusted to 2 × 10⁵ macroconidia/ml. A simulated inoculation (water only) was also used as a control, based on the methodology described by Onyeka et al. (Reference Onyeka, Dixon and Ekpo2005). After inoculation, the roots were placed in trays containing wet cotton, wrapped in plastic bags (wet chamber) and stored at 26 ± 2·0 °C for 10 days. The experimental design was in randomized blocks with 6–18 replicates per accession (plots represented by one root with three inoculation points, enough to simulate field conditions).
At the time of evaluation, the roots were cut longitudinally and digitally photographed. ImageTool v.3·0 software (UTASCSA, University of Texas Health Science Center, San Antonio, TX, USA) was used as a tool to analyse the symptoms of root rot disease. To calculate the area colonized by the pathogen, two measures were taken: the first regarding the severity of root rot in the peel and the second for severity in the pulp.
The genetic values were predicted by mixed-model analysis and best linear unbiased prediction (BLUP) (Resende Reference Resende2002) and then used in GWAS. The model y = Xr + Tb + Zg + Wi + e was used for the evaluation of the accessions in an incomplete block design in five environments with one observation per plot, where y is the vector of observations, r is the vector of the environments’ effects (random) added to the overall average, b is the block effect within the environment (random), g is the vector of genotypic effects (random), i is the vector of genotype–environment (G × E) effects (random), and e is the vector of residues (random). X, T, Z and W represent the matrix of incidence of the environment, block, accessions and G × E genotype effects, respectively. The empirical BLUP predictors of genotypic values free of the interaction were given by
 $\hat {\rm \mu} $
+
 $\hat g$
i where
 $ \hat{\rm \mu} \; $
is the overall means of all environments, and
 $\hat g$
i is genotypic effect free of the G × E interaction.
Estimates of variance components were obtained via restricted maximum likelihood, and individual broad-sense heritability (
 $h_{\rm g}^2 $
) was obtained according to
 $h_{\rm g}^2 = {{\hat \sigma _{\rm g}^2} / {\hat \sigma _{\rm g}^2 + \hat \sigma _{\rm p}^2 + \hat \sigma _{\rm e}^2}} $
, where
 $\hat \sigma _{\rm g}^2 $
= genotypic variance;
 $\hat \sigma _{\rm p}^2 $
= phenotypic variance and
 $\hat \sigma _{\rm e}^2 $
= environment variance.
The package Corrgram in R software (R Core Team 2015) was used to estimate the correlations between BLUPs of the severity of root rot diseases in the peel and pulp according to the Pearson coefficient. Correlations between root rot diseases were shown according to similar patterns of disease severity, based on the complexity of resistance and the mechanism of action of the pathogens, which can act jointly or independently.
Genotypic data
The DNA was extracted from leaves of the 263 cassava accessions according to the protocol using cetyltrimethylammonium bromide described by Doyle & Doyle (Reference Doyle and Doyle1990). The DNA concentration was adjusted to 60 ng/μl, and its quality checked by digesting 250 ng of the 10 DNA samples with the restriction enzyme EcoRI (New England Biolabs, Boston, MA, USA) at 65 °C for 2 h. Then the DNA samples were taken to the Genomic Diversity facility at Cornell University, USA (http://www.biotech.cornell.edu/brc/genomic-diversity-facility) for library preparation, sequencing and bioinformatics analysis. The basic genotyping by sequencing (GBS) protocol is described by Elshire et al. (Reference Elshire, Glaubitz, Sun, Poland, Kawamoto, Buckler and Mitchell2011). In summary, the DNA was digested with an ApeKI enzyme, a type II restriction endonuclease that recognizes a degenerate five-base sequence (GCWGC, where W is A or T), and creates a 5′ overhang (3 bp). The linkage between ApeKI-cut genomic DNA and adapter was made after the digestion of the samples and the 192-multiplex samples for sequencing. The GBS was performed using Genome Analyser 2000 (Illumina, Inc., San Diego, CA, USA).
Genome-wide association study and linkage disequilibrium analysis
A priori, the SNPs were submitted to a quality control where all indels and SNPs with >0·10 missing data and minor allele frequency <0·05 were excluded from the analysis. Then the data were imputed using the missForest package (R software; R Core Team 2015). missForest adopts a strategy that does not require prior information ordering of markers and is indicated for species that have an incomplete or no reference genome. Briefly, the SNP imputation was performed by regressing each variable against all other variables and then predicting missing data for the dependent variable using the fitted forest. Its accuracy has already been tested and performance was found to be superior to other methods and consistent in different data sets (Rutkoski et al. Reference Rutkoski, Poland, Jannink and Sorrells2013).
Linkage disequilibrium was estimated using the correlation coefficients (r 2) between the pairs of loci in each chromosome, and then the distribution pattern for the whole genome was visualized using graphs generated by the LDheatmap package (R software; R Core Team 2015). To investigate the decline of LD, r 2 values were plotted as a function of genetic distance, in base pairs (bp), using non-linear regression according to Weisberg (Reference Weisberg2005).
The association analyses were performed with 14·094 SNPs using the genome association and prediction integrated tool package (R software; Lipka et al. Reference Lipka, Tian, Wang, Peiffer, Li, Bradbury, Gore, Buckler and Zhang2012; R Core Team 2015). Based on the principle component analysis analysis, K (number of sub-populations) was used to construct the Q matrix and as a covariate variable (fixed effect) to account for effects due to population structure. The kinship matrix (K) was calculated according to VanRaden (Reference VanRaden2008) and used in a mixed linear model (MLM) as the variance–covariance matrix between the individuals to improve the statistical power of the GWAS model. Moreover, the optimum compression MLM and P3D options (i.e. genetic variance and residual variance for each marker previously determined; Wang et al. Reference Wang, Tian, Pan, Buckler and Zhang2014) were used to reduce the computational time and speed up the statistical power in GWAS.
The efficient mixed-model association algorithm (Kang et al. Reference Kang, Zaitlen, Wade, Kirby, Heckerman, Daly and Eskin2008) was implemented to reduce computational time when estimating the components of variance for each marker in the model. The associations between genotype and phenotype were determined using MLM, considering the following equation:
 $$\; Y = X\beta + Zu + e$$
where: Y is an n × 1 vector of observed phenotypes; β is a q × 1 vector of fixed effects (principal components used for population structure estimation, from SNP markers); u is the vector of random genetic effects; e is the random vector of residual effects; X is the incidence matrix (n × q) relating the individuals to the fixed marker effects β; Z is an n × t incidence matrices for u, which is the random effect of the mixed model with
 ${\rm Var}\,{\rm (}u{\rm )} = _{\rm k}^2 $
; where K is the t × t kinship matrix, and e is an n × n matrix of residual effect,
 ${\rm Var}\,{\rm (}e{\rm )} = _{\rm e}^2 I$
, and the phenotypic variance–covariance matrix can be represented as
 $V = _{\rm g}^2 ZKZ{\rm ^{\prime}} + _{\rm e}^2 I$
.
The MLM allows the elimination of type I errors, avoiding spurious associations (Zhang et al. Reference Zhang, Ersoz, Lai, Todhunter, Tiwari, Gore, Bradbury, Yu, Arnett, Ordovas and Buckler2010; Wang et al. Reference Wang, Tian, Pan, Buckler and Zhang2014). Significant associations between the markers and the phenotype were estimated using the −log10 P-value, and the Bonferroni correction was adopted for multiple tests, at P < 0·05.
In silico annotation of single-nucleotide polymorphisms
The putative biological functions of significant SNPs were determined by searching the sequences of the SNPs against proteins related to disease resistance in the Phytozome database (http://www.phytozome.net), in which the homology search was performed using blastx.
RESULTS
Variation and correlation between the severity of pathogens causing root rot disease
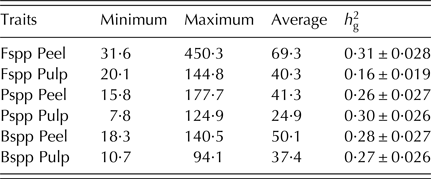
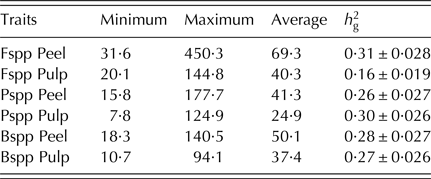
Quite a large variation was seen among the evaluated accessions for BLUPs of CRR severity in the peel and pulp (Table 1). However, the pathogens causing dry rot (Fusarium species) were more aggressive in comparison with those causing soft rot (Phytophthora species) and black rot (Botryosphaeriaceae family species). Hereafter, the pathogens causing DRR, SRR and BRR diseases will be named Fspp, Pspp and Bspp, respectively. In addition, the severity of these pathogens was higher in the peel compared with the root pulp.
Average, minimum and maximum values (mm2) of the best linear unbiased prediction (BLUP) and individual broad-sense heritability of the genotypic effects (
 $h_{\rm g}^2 $
) for resistance to cassava root rot disease caused by Fusarium spp. (Fspp), Phytophthora spp. (Pspp) and Botryosphaeriaceae (Bspp) species in the peel and pulp of the roots
Estimates of individual broad-sense heritability of genotypic effects (
 $h_{\rm g}^2 $
) were of medium magnitude for all groups of pathogens, with similar estimates for Fspp Peel, Pspp Peel, Pspp Pulp, Bspp Peel and Bspp Pulp, while the estimate for Fspp Pulp was half that of the others (Table 1).
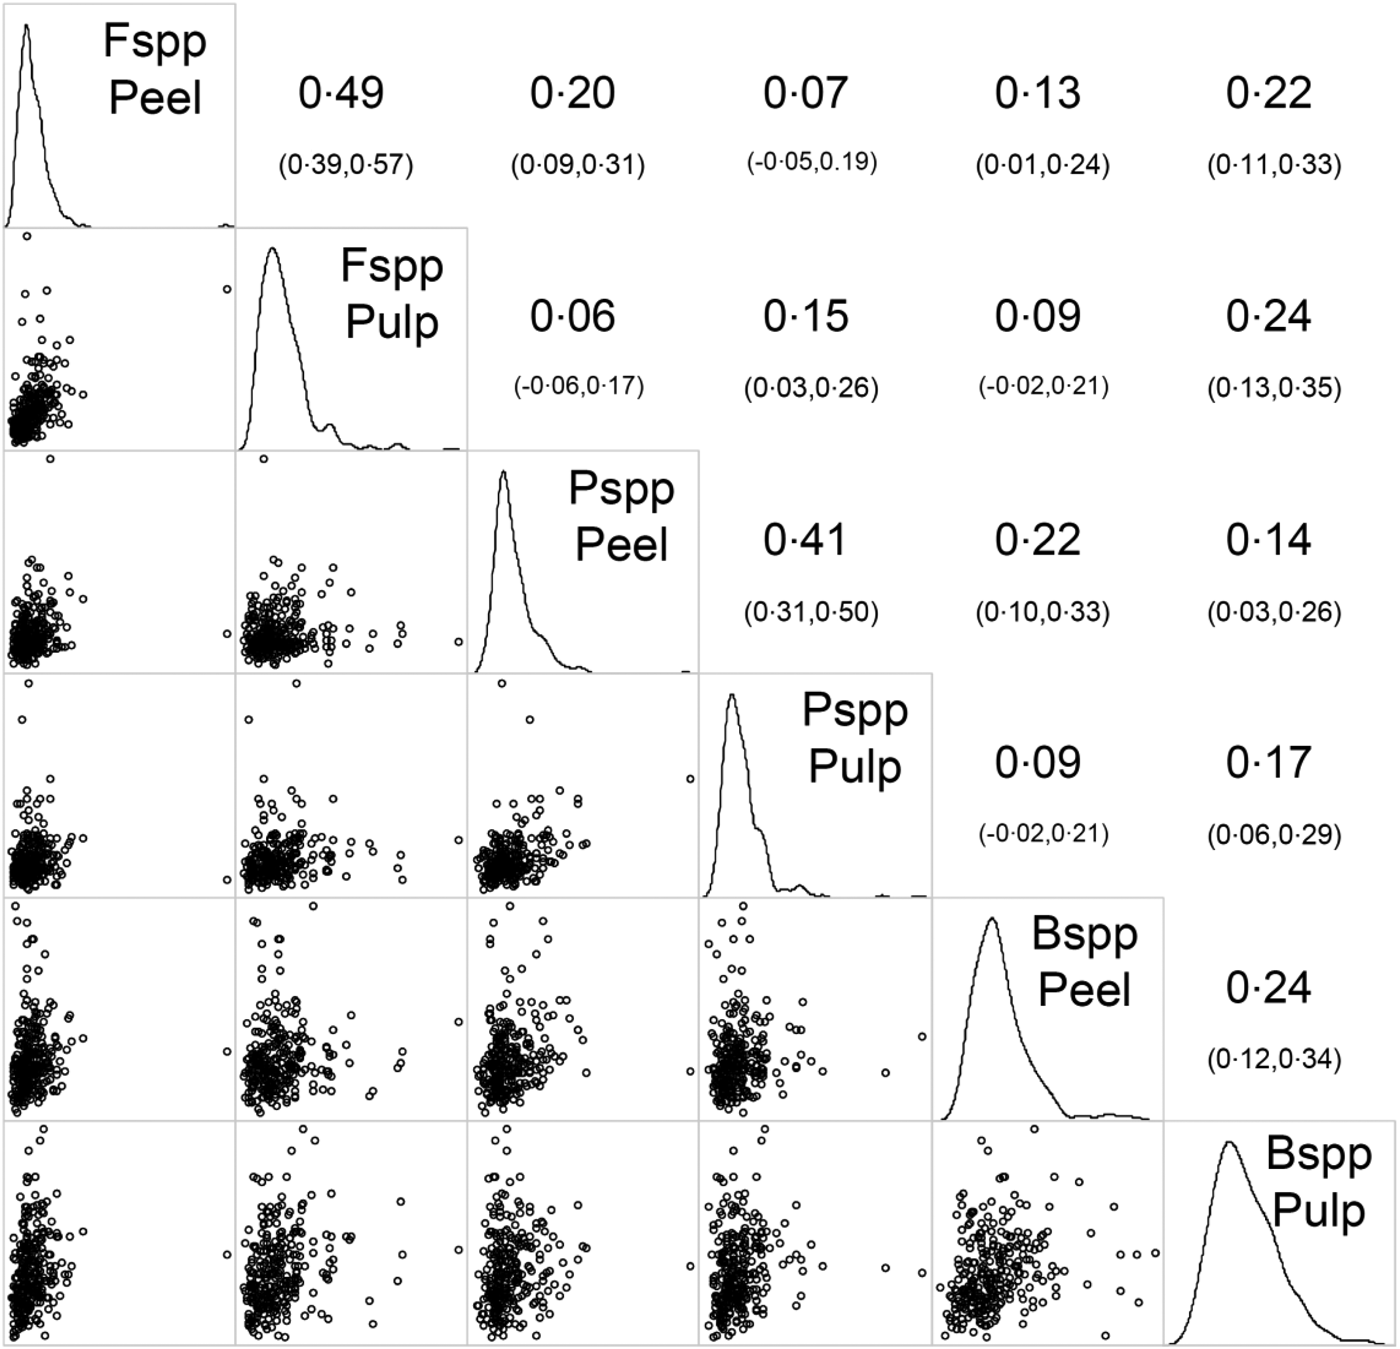
According to the BLUP distribution for resistance to CRR, most of the accessions were highly susceptible (distribution in the right on the graphs of Fig. 1). Only BRR (Bspp in the pulp) presented a distribution closer to normal. In relation to Pearson's correlation estimates, positive associations were identified among all pairs of diseases considering both peel and root pulp evaluations (Fig. 1). The highest correlations (>0·40) were observed for the same pathogen group but in different root parts; for example, Fspp Peel v. Fspp Pulp (0·49) and Pspp Peel v. Pspp Pulp (0·41). These data indicate the low correlation between the pathogens causing root rot disease in cassava and that this is more interesting between different parts of the plant, which may indicate a presence of different mechanisms of resistance.
Correlogram of the best linear unbiased predictor (BLUP) for resistance to cassava root rot disease caused by Fusarium spp. (Fspp), Phytophthora spp. (Pspp) and family Botryosphaeriaceae (Bspp) in the peel and pulp of the roots. The numbers refer to Pearson coefficients with a 95% confidence interval (in parentheses).

Population structure and linkage disequilibrium of single-nucleotide polymorphisms
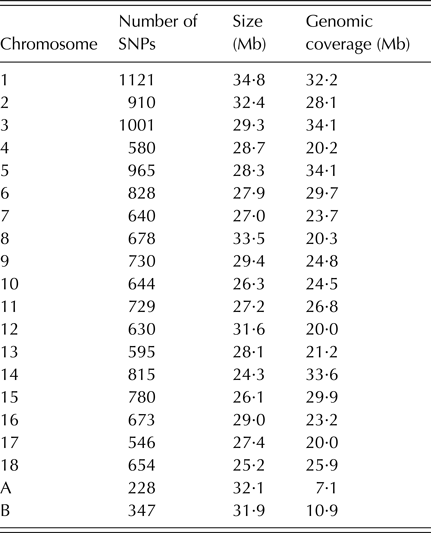
The SNP markers were distributed on the 18 chromosomes of M. esculenta with an average of 26·2 SNP/Mb. Distribution of the SNPs was not uniform and there was variation within the chromosomes, with a minimum of 20·0 SNP/Mb on chromosome 12 and a maximum of 31·1 SNP/Mb on chromosome 3 (Table 2). In addition, 575 SNPs were identified in genomic fragments not yet mapped in the cassava genome, whose genomic coverage was lower in relation to the other chromosomes.
Coverage of the single-nucleotide polymorphism (SNP) markers on different cassava chromosomes
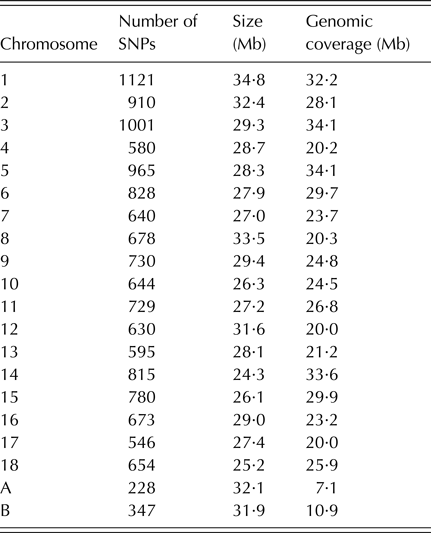
A and B refer to chromosome fragments not yet mapped in the cassava genome.
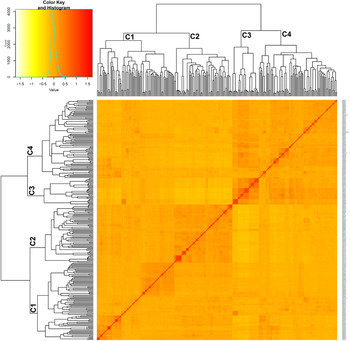
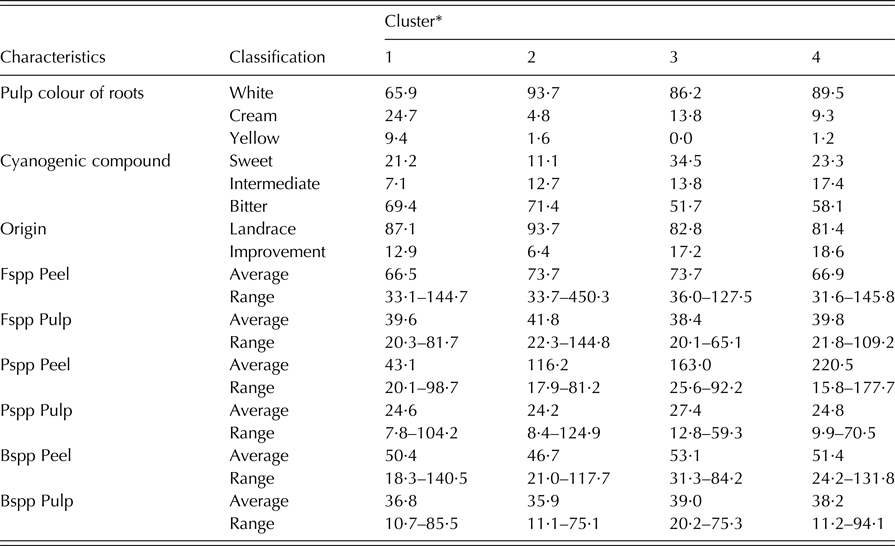
The clustering of the 263 cassava accessions based on the kinship matrix (VanRaden Reference VanRaden2008) was used to represent the population structure. Four major genetic clusters were identified (Fig. 2). However, there was no clear distinction between cassava germplasm considering similar characteristics in terms of root pulp colouration (white, cream and yellow), classification of cyanogenic compounds (sweet, intermediate and bitter) and origin of the material (landrace or improvement variety) (Table 3). Considering the genomic kinship matrix, no clear distinction in cassava accessions based on the major or minor susceptibility to root rot pathogens was observed, except for soft rot (Pspp) in the peel, where there is a trend towards the greater susceptibility from group 1 to 4 (Table 3).
Relationship between cassava accessions based on the genomic kinship matrix. The four main groups are represented (C1 to C4), having a unimodal distribution of kinship values in different groups. Colour online.

Characteristics of the four clusters of cassava accessions based on the kinship matrix obtained with 14·094 single-nucleotide polymorphism (SNP) markers
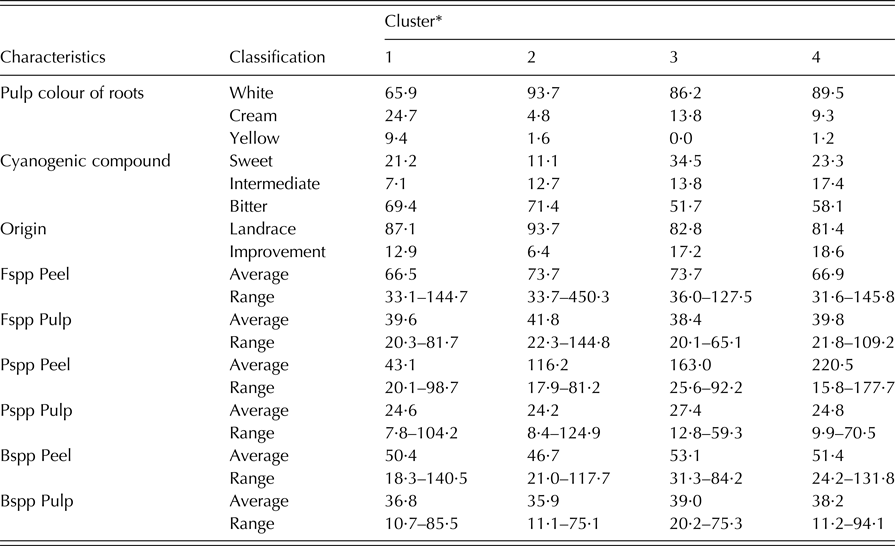
* According to the clustering of Fig. 2.
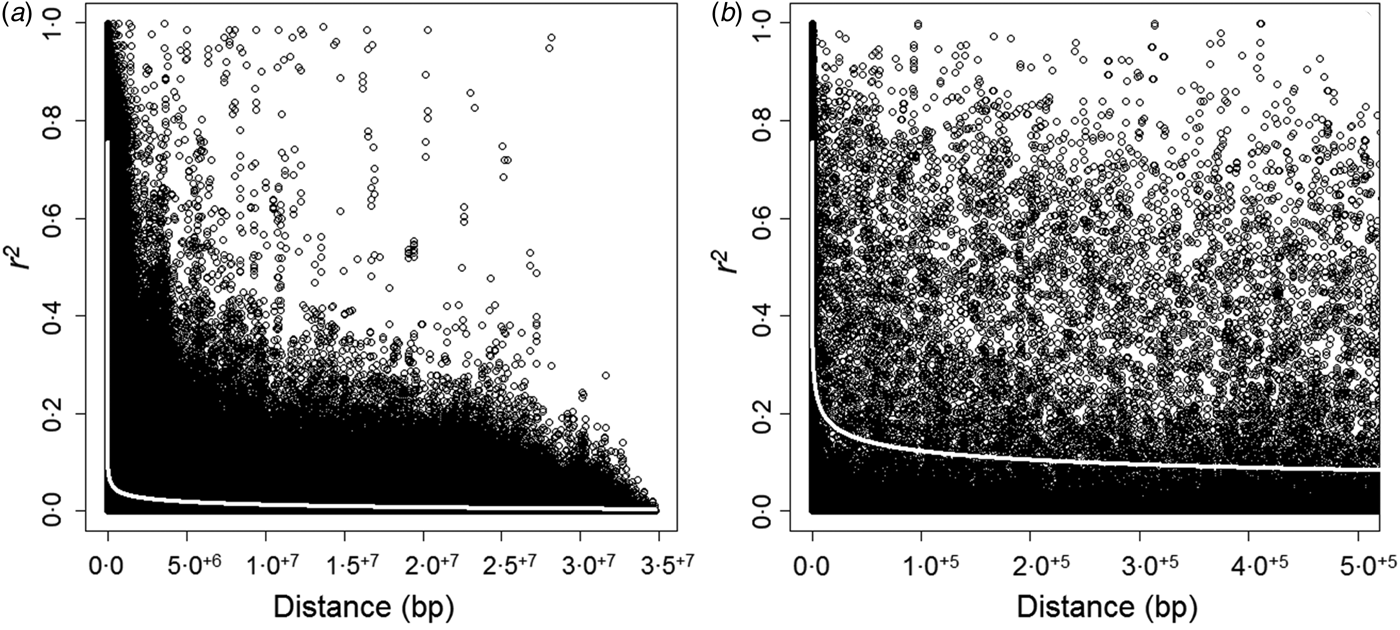
Considering only significant r 2 values (P < 0·001) as informative, it was observed that about 0·04 among all pairs of loci met these restrictions. Significant intra-chromosomal r 2 values ranged from 0·08 to 0·99, with an average of 0·22. Considering only the SNP pairs in significant LD, 0·32 had r 2 > 0·2, while 0·11 and only 0·02 presented r 2 > 0·5 and 0·9, respectively. Linkage disequilibrium declined rapidly as a function of genetic distance (base pairs), and, on average, the intra-chromosomal LD reduced with r 2 = 0·2 near to 15 kb (Fig. 3).
Decline of linkage disequilibrium (LD− r 2) between SNPs pairs as a function of physical distance in base pairs (bp). (a) LD overview on all chromosomes, and (b) LD zoom based on distance up to 500 kb. The horizontal line indicates the adjustment of the nonlinear regression for LD along the cassava genome.

Association analysis
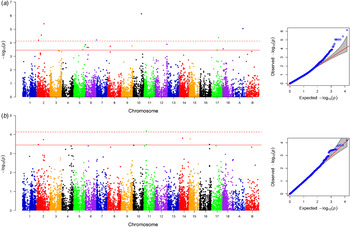
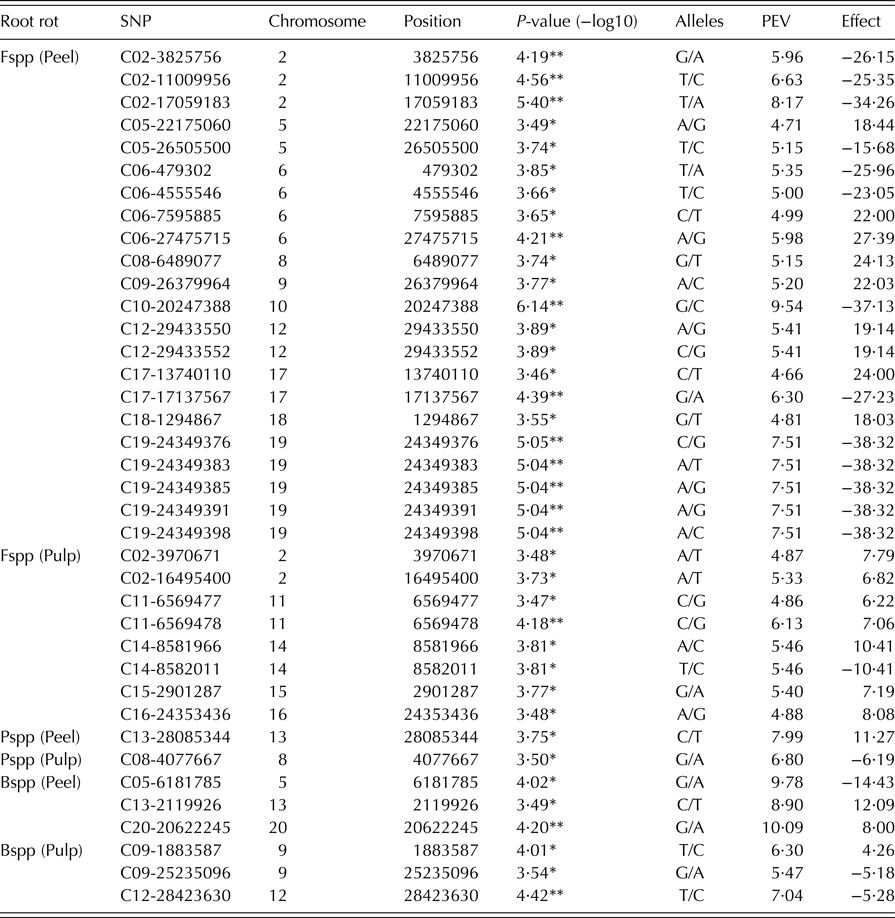
Thirty-eight SNPs were significantly associated with the three classes of CRR evaluated. These SNPs were clustered into 31 loci located on different chromosomes, since SNPs with a difference of up to 1 kb were considered single loci (Table 4). The largest number of significant SNPs (22) was identified for the root rot severity caused by Fspp in the peel. These 22 SNPs were distributed in 17 loci, on chromosomes 2, 5, 6, 8, 9, 10, 12, 17, 18 and ‘A’ fragments (Fig. 4). However, for the severity of Fspp in the root pulp, eight SNPs were identified in six different loci present in chromosomes 2, 11, 14, 15 and 16. Even with significant SNPs on chromosome 2 for DRR in the peel and pulp, it was observed that they are placed in different genomic regions. The most significant association for DRR in the peel was observed for SNP C10-20247388 (P-value (−log10) = 6·14).
Manhattan plot indicating SNPs associated with dry root rot (Fspp) in the peel (a) and pulp (b) of cassava roots. The location of the SNPs on each chromosome (a and b refer to unmapped SNPs) on the x-axis and the association test (−log10 (p)) on the y-axis are represented. The dashed line indicates the level of Bonferroni correction at 1% significance and the solid line at 5% significance. The table to the right refers to the quantile–quantile (QQ) plot of the P-values observed and expected from the association analysis. Colour online.

Single-nucleotide polymorphism (SNP) markers associated with cassava root rot disease
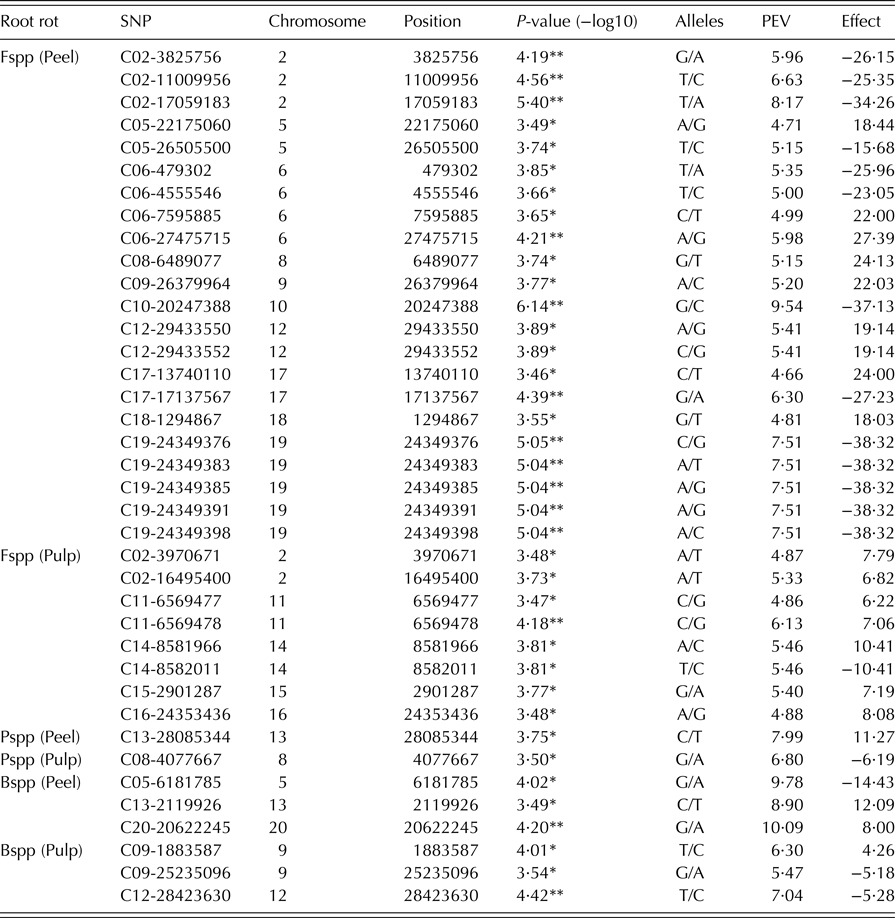
PEV, predictive error variance.
*, **: SNPs significantly associated at P < 0·05 and P < 0·001 of probability by the Bonferroni test, respectively. Pathogens causing dry root rot (Fspp), soft root rot (Pspp) and black root rot (Bspp).
Cassava accessions with the G allele in this SNP presented, on average, a −37·13 mm2 lesion. For DRR disease in the pulp, the SNP C11-6569478 (P-value (−log10) = 4·18) was the most significant, in which accessions with the G allele presented, on average, a −7·06 mm2 lesion. Considering
 $h_{\rm g}^2 $
of 0·31 ± 0·028 and 0·16 ± 0·019 for Fspp in the peel and pulp, respectively, a high number of SNPs significantly associated due to the quantitative nature of these traits are expected. The SNPs explained from 0·05 (13·7 Mb on chromosome 17) to 0·10 (20·2 Mb on chromosome 10) of the phenotypic variation for Fspp in the root peel as well as 0·05 (3·9 Mb on chromosome 2) to 0·06 (6·6 Mb on chromosome 11) of the phenotypic variation for Fspp in the pulp (Table 4).
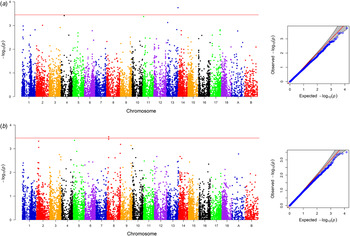
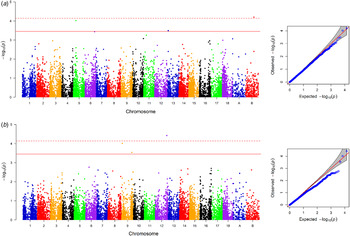
For Pspp severity in the root peel and pulp, a significant SNP was identified on chromosomes 13 and 8, respectively, which explained 0·08 and 0·07 of the phenotypic variation (Fig. 5). Single-nucleotide polymorphisms C13-28085344 and C08-4077667 demonstrated that accessions having T and G alleles showed, on average, smaller lesions at 11·27 and 6·19 mm2, respectively (Table 4). For Bspp severity in the root peel, three SNPs were identified on chromosomes 5 and 13 and genomic fragments B, which explained 0·10, 0·09 and 0·10 of the phenotypic variation, respectively. Accessions with G, T and A alleles for the SNPs C05-6181785, C13-2119926 and C20-20622245, respectively, presented lesions of smaller size in relation to the other accessions (−14·4, −12·1 and −8·0 mm2, respectively) for Bspp severity in the root peel. Three SNPs for Bspp in the root pulp were also identified, associated with two loci present on chromosomes 9 and 12 that explained about 0·05–0·07 of the phenotypic variation of root pulp severity (Fig. 6).
Manhattan plot indicating SNPs associated with soft root rot (Pspp) in the peel (a) and pulp (b) of cassava roots. The location of the SNPs on each chromosome (a and b refer to unmapped SNPs) on the x-axis and the association test (−log10 (p)) on the y-axis are represented. The solid line indicates the level of Bonferroni correction at P < 0·05. The table to the right refers to the quantile–quantile (QQ) plot of the P-values observed and expected from the association analysis. Colour online.

Manhattan plot indicating SNPs associated with black root rot (Bspp) in the peel (a) and pulp (b) of cassava roots. The location of the SNPs on each chromosome (a and b refer to unmapped SNPs) on the x-axis and the association test (−log10 (p)) on the y-axis are represented. The dashed line indicates the level of Bonferroni correction at 1 P < 0·001 and the solid line at P < 0·05. The table to the right refers to the quantile–quantile (QQ) plot of the P-values observed and expected from the association analysis. Colour online.

The C, G and T alleles of the SNPs C09-1883587, C09-25235096 and C12-28423630, respectively, were responsible for reducing the size of Bspp lesions in the root pulp at 4·3, 5·2 and 5·3 mm2, respectively (Table 4). Considering that
 $h_{\rm g}^2 $
is of low magnitude and very similar among root rot pathogens (Table 1), it was expected that a greater number of SNPs would be significant for pathogens causing soft and BRR, as occurred with DRR caused by Fusarium.
The genetic control of resistance to CRR seems to be quite complex, considering that with the exception of chromosome 19 in the 24·3 Mb region, in which five SNPs closely associated with Fssp in the peel were observed, the other significant SNPs associated with SRR, BRR and DRR were independent and distributed among 14 of the 18 cassava chromosomes. Therefore, the current results suggest that determination of the genetic bases of resistance to root rot caused by these groups of pathogens should be analysed in an individualized way. In addition, the small number of studies on CRR, particularly in the identification of genes or genomic regions associated with resistance, makes it difficult to compare with previously mapped quantitative trait loci (QTL) in the genome of the species.
In silico analysis of single-nucleotide polymorphisms associated with resistance to cassava root rot
Of the 38 SNPs associated with CRR, 19 have biological functions known and available in Phytozome v.11. Specifically for DRR in the peel, four SNPs associated with proteins without functional annotation were identified, including ten annotations of proteins related to different biological processes such as apoptosis proteins, transcription and translation activation, biosynthetic reactions, cellular signalling cascades, cycle regulation, cells regulating signal transduction, programmed cell death, RING finger domains, phosphatase domain, protein tyrosine kinase, regulation of various physiological programmes including pathogen defence, senescence and trichome development. In the case of DRR in the pulp, three SNPs associated with proteins related to the β-oxidation pathway of fatty acid metabolism, catalytic processes and cellular processes, including division, proliferation, apoptosis and differentiation, were identified (Supplementary Table S2).
For SRR in the peel and pulp, proteins associated with protein recycling from endosomes to the late Golgi and cellular component organization or biogenesis, respectively, were identified. In the case of BRR in the peel, annotations were identified for two SNPs, one of them whose function is unknown and the other associated with the RNA metabolic process, response to endogenous stimulus, response to stress and signal transduction. In contrast, two SNPs associated with BRR in the pulp are related to processes involving translation factors, DNA repair, DNA replication and chromosomal stability (Supplementary Table S2).
DISCUSSION
Severity and genetics of the resistance to cassava root rot
Among the major cassava diseases, root rot has received little research attention; therefore, sources of resistance, pathological and molecular interaction have not been studied much. In several situations, the symptoms of soil diseases are not visible, and thus their impact is not so immediately perceived in comparison to the foliar diseases (Bandyopadhyay et al. Reference Bandyopadhyay, Mwangi, Aigbe and Leslie2006). Losses in root yield range from 30 to 70% (Barros et al. Reference Barros, Medeiros, Notaro, Moraes, Silva, Nascimento and Moreira2014) depending on the pathogen and environmental conditions. Control of soil diseases based on the use of resistant cultivars has been the most economical and reliable approach to controlling CRR, especially when associated with preventive cultural practices (Vilas Boas et al. Reference Vilas Boas, Hohenfeld, Oliveira, Santos and de Oliveira2016). Therefore, studies related to the search for sources of resistance and genes related to the interaction with cassava are of fundamental importance to guide breeding programmes during the selection process.
The current results showed that the severity of CRR was not similar among the different groups of pathogens (DRR, BRR and SRR), and the greater aggressiveness of Fusarium species may be related to better adaptation of the pathogen to the host species during infection, compared with the other pathogens, thus providing a greater severity of symptoms. Indeed, Nyaka et al. (Reference Nyaka, Kammegne, Ntsomboh, Mbenoun, Zok and Fontem2015) found that among the main fungi involved in CRR, there was a prevalence of Fusarium genus to the detriment of other pathogens (0·50 of fungus sampled).
Differential responses of root rot severity were observed in the different genotypes and also in different parts of the root (peel and pulp). Oliveira et al. (Reference Oliveira, Hohenfeld, Santos, Haddad and de Oliveira2013) also reported the possibility of different levels of resistance among cassava genotypes associated with different levels of Fusarium aggressiveness. When studying the prevalence and severity of root rot pathogens in cassava in West Africa, Banito et al. (Reference Banito, Kpémoua, Bissang and Wydra2010) also verified differentiated reactions when the pathogens were inoculated in roots and stems. The virulence tests on cassava stems and roots revealed that Botryodiplodia theobromae was extremely virulent when inoculated on stems, whereas Fusarium sp., Sclerotium rolfsii and Pythium sp. were more virulent in the roots. Indeed, Vilas Boas et al. (Reference Vilas Boas, Hohenfeld, Oliveira, Santos and de Oliveira2016) suggested that chemical and physical barriers may be involved in the process of defence against pathogens, resulting in differential responses to the severity of symptoms in different parts of plants.
In relation to
 $h_{\rm g}^2 $
, the estimates were similar for the different groups of pathogens (0·26–0·31), with the exception of Fspp in the pulp (0·16) (Table 1). These estimates of heritability were of lower magnitude compared to reports for other cassava diseases; for instance, cassava mosaic disease (CMD) resistance. Manu-Aduening et al. (Reference Manu-Aduening, Peprah and Agyeman2013) evaluated progenies from crosses between 19 landraces varieties of Ghana with a resistant variety (TME11) and reported heritability varying from 0·81 to 0·92 for resistance to CMD. In another study, Parkes et al. (Reference Parkes, Fregene, Dixon, Boakye-Peprah and Labuschagne2013) reported heritability estimates of median magnitude (0·66) for CMD and bacteriosis in cassava. Therefore, the current results indicate that the nature of cassava resistance to root rot disease is complex and with a strong environmental influence compared with CMD and bacteriosis. Generally, resistance is associated with the performance of several small-effect genes, making investigation complex, especially when there are several species of pathogens involved, such as in the case of CRR disease. Understanding of the various causal agents associated with complex diseases requires specificity in the understanding of resistance mechanisms (sporulation rate and aggressiveness of each pathogen group) as well as interactions with other pathogens (Bandyopadhyay et al.
Reference Bandyopadhyay, Mwangi, Aigbe and Leslie2006). According to Pariaud et al. (Reference Pariaud, Ravigné, Halkett, Goyeau, Carlier and Lannou2009), many of the components of pathogenic aggressiveness are determined by several genes.
Population structure and linkage disequilibrium
The clusters formed by the kinship matrix show no relationship with agronomic characteristics presented by the cassava accessions, such as the colour of the root pulp, classification of cyanogenic compounds and origin of the material. One reason that may explain the difficulty in clustering cassava accessions based on phenotypic characteristics is the existence of recent and historical hybridizations among accessions belonging to the different clusters that make it difficult to select genotypes with better adaptation to different environments. In fact, because cassava is native to Brazil, the high genetic diversity dispersed in the national territory causes differences in root preference; for example, it is common to find accessions of cassava with yellow pulp and varying levels of cyanogenic compounds.
The same happens with white roots. In addition, during the development of cassava breeding programmes in Brazil, several landraces showing an adaptation worthy of recommendation as a variety for cultivation were collected and evaluated in other production regions. In this case, the landraces have not reached hybridization but only a regionalized introduction and recommendation, so their origin as the improved or local material is not very clear. Regardless of the low association between clustering of the genomic kinship matrix with certain agronomic attributes and resistance to root rot disease, the discovery of extensive variation in cassava germplasm due to the formation of four main genetic groups represents an important advance in GWAS in this species and in planning future breeding programmes to capture maximum genetic diversity.
Genome-wide association study basically refers to the identification of QTL based on a statistically significant association between a given phenotype and the molecular marker as a result of LD between the marker and at least one QTL (Gupta et al. Reference Gupta, Rustgi and Kulwal2005). Recently, GWAS has been a promising tool in the study of QTLs, since natural populations can be used instead of biparental crosses in order to allow the detection of recombination events in a historical-evolutionary context (Flint-Garcia et al. Reference Flint-Garcia, Thuillet, Yu, Pressoir, Romero, Mitchell, Doebley, Kresovich, Goodman and Buckler2005). However, before initiating GWAS, it is important to analyse the distribution of markers, LD and the population genetic structure.
The intra-chromosomal distribution of the SNPs was non-uniformly organized, which probably reflects the history of recombinations that occurred over time in cassava germplasm. In the present study, an average of 700 SNPs was identified by chromosome. Recently, when analysing genomic regions associated with resistance to cassava mosaic geminiviruses, Rabbi et al. (Reference Rabbi, Hamblin, Kumar, Gedil, Ikpan, Jannink and Kulakow2014) found, on average, 256 SNPs by cassava chromosome. Comparison of SNP polymorphism between different studies is difficult, considering that the frequency of SNP detected in the genome seems to be largely dependent on the nature of the genomic region and the individuals studied. In contrast, according to Kawuki et al. (Reference Kawuki, Ferguson, Labuschagne, Herselman and Kim2009), in cross-pollinated crops sensitive to inbreeding, such as cassava, high DNA polymorphism is expected, in part due to a large number of loci maintained in the heterozygous state. The high-density and unequal distribution of SNPs contribute to explaining the pattern of LD in a species, which may affect the accuracy of GWAS (Yan et al. Reference Yan, Shah, Warburton, Buckler, McMullen and Crouch2009).
In addition to the discovery of extensive genetic diversity, LD decay near 15 kb (r 2 = 0·2) in cassava suggests that GWAS should allow for high-resolution mapping of genes associated with root rot. In other crops, LD decay has been reported to be very close to that observed in the present study, such as date palm (Hazzouri et al. Reference Hazzouri, Flowers, Visser, Khierallah, Rosas, Pham, Meyer, Johansen, Fresquez, Masmoudi, Haider, El Kadri, Idaghdour, Malek, Thirkhill, Markhand, Krueger, Zaid and Purugganan2015) and cranberry (Covarrubias-Pazaran et al. Reference Covarrubias-Pazaran, Diaz-Garcia, Schlautman, Deutsch, Salazar, Hernandez-Ochoa, Grygleski, Steffan, Iorizzo, Polashock, Vorsa and Zalapa2016), whose estimates are around 10 and 13 kb, respectively. Linkage disequilibrium decay determines the power of QTL detection in associative mapping studies and indicates that the marker density is required to identify significant associations. According to Meuwissen et al. (Reference Meuwissen, Hayes and Goddard2001), a minimum LD of r 2 = 0·20 is required for the use of genomic selection to have an accuracy >0·85.
Genome-wide association study
The inheritance of resistance to CRR disease tends to be complex due to the strong environmental influence and possible pathogenic interactions with cassava varieties as well as the differential expression of symptoms in different parts of the roots. Therefore, GWAS is one of the best tools for studying complex traits (Riedelsheimer et al. Reference Riedelsheimer, Czedik-Eysenberg, Grieder, Lisec, Technow, Sulpice, Altmann, Stitt, Willmitzer and Melchinger2012). Accordingly, to investigate the natural genetic diversity of resistance to CRR and to identify genomic regions associated with the disease, high-density GWAS analysis was performed using 14·094 SNPs in a collection of 263 accessions of M. esculenta.
The analysis identified 38 significant SNPs, 22 of which are related to the root rot severity caused by Fspp in the root peel, with distribution on nine chromosomes (2, 5, 6, 8, 9, 10, 12, 17 and 18), while, for Fspp severity in the root pulp, eight SNPs were identified in six different loci present on chromosomes 2, 11, 14, 15 and 16. This difference in the number of SNPs associated with Fusarium does not seem to be associated with the complexity of the character since the
 $h_{\rm g}^2 $
of Fspp in the root pulp is practically half of the Fspp in the root peel (0·16 ± 0·019 and 0·31 ± 0·028, respectively) but presented a smaller number of SNPs associated with the resistance.
The other eight SNPs are associated with Pspp in the peel (1), Pspp in the pulp (1), Bspp in the peel (3) and Bspp in the pulp (3). Other reports have demonstrated that alternative methods of inoculation may result in the presence of different SNPs associated with resistance to the same pathogen. Bonhomme et al. (Reference Bonhomme, André, Badis, Ronfort, Burgarella, Chantret, Prosperi, Briskine, Mudge, Debelle, Navier, Miteul, Hajri, Baranger, Tiffin, Dumas, Pilet-Nayel, Young and Jacquet2014) evaluated a collection of 179 Medicago truncatula accessions for resistance to Aphanomyces euteiches using two complementary phenotyping techniques (in vitro and climatic chamber) and identified 44 significant SNPs associated with 32 candidate loci, of which 20 loci were detected only with the in vitro technique, seven loci were detected only in the climatic chamber trial and only five were common to both methods. These results indicate that the choice of inoculation method and even of the different parts of the plant to be evaluated can influence the phenotype and consequently result in complex associations at the molecular level. Therefore, specifically in the case of CRR, it will be necessary to select resistant genotypes considering the specificity of the rot groups (SRR, DRR and BRR) and the different parts of the root to guarantee high selective accuracy.
The detection of a higher number of SNPs associated with Fusarium, compared with Phytophthora and species of the family Botryosphaeriaceae, may indicate a greater complexity of the interaction of this pathogen with cassava. An imbalance in the number of associated markers with disease resistance in other plants has been reported in the literature. For example, Kertho et al. (Reference Kertho, Mamidi, Bonman, McClean and Acevedo2015) carried out GWAS in wheat to identify resistance to leaf rust caused by Puccinia triticina (Pt) and stripe rust caused by Puccinia striiformis f. sp. tritici (Pst). These authors identified 65 and eight significant markers associated with leaf rust and stripe rust, respectively, being 31 and three QTLs for resistance to Pt and Pst, respectively. However, the use of the panel of higher SNPs density in the cassava genome may contribute to the mapping of other possible regions associated with resistance to Phytophthora (SRR) and species of the family Botryosphaeriaceae (BRR). Additional investigations using QTL mapping in biparental (contrasting) populations and further comparative analysis with other inoculation methods and even field-level assessments on soils highly infested by CRR may provide more information on genes and genomic regions that may explain greater part of the phenotypic variation.
Most of the significant SNPs associated with SRR, BRR and DRR were independent and distributed on virtually all cassava chromosomes (14 of the 18 chromosomes). This result seems to be consistent with the uneven distribution of resistance gene analogues (RGAs) in different cassava chromosomes, thus providing evidence of multigene inheritance for the resistance of some cassava diseases (Lozano et al. Reference Lozano, Hamblin, Prochnik and Jannink2015; Soto et al. Reference Soto, Ortiz, Perlaza-Jiménez, Vásquez, Lopez-Lavalle, Mathew, Léon, Bernal, Ballvora and López2015). Recently, Louis & Rey (Reference Louis and Rey2015) demonstrated that tolerance to the South African cassava mosaic virus in the resistant variety (TME3) is associated with a high proportion of RGA transcripts relative to the total differentially expressed genes compared with the susceptible variety (T200).
The present results provide useful information for understanding the genomic structure and mechanisms of action of root rot pathogens in cassava. The SNPs identified in the present study can be used as selection markers for the SNP alleles most associated with the disease in order to increase the resistance levels of the cassava elite varieties.
In silico analysis of single-nucleotide polymorphisms associated with resistance to cassava root rot
Functional annotations of SNPs associated with CRR revealed important genomic regions for positional cloning. From the 19 SNPs related to annotated biological functions, seven of them have functions associated with the plant defence and response to the attack of pathogens (C02-17059183, C02-3825756, C05-6181785, C05-26505500, C06-4555546, C08-6489077 and C18-1294867). Four other SNPs (C06-479302, C06-27475715, C09-26379964 and C16-24353436) relate to protein kinases, an important family of proteins with multiple functions, including disease resistance (Zegeye et al. Reference Zegeye, Rasheed, Makdis, Badebo and Ogbonnaya2014). The other annotations of SNPs associated with CRR are related to general metabolic processes such as RING finger domains; RNA metabolic process, oxidation pathway of fatty acid metabolism, catalysis, cellular component organization, recycling of proteins; transcription regulation, chromosomal stability and DNA repair and replication.
Other authors have reported the involvement of kinases in resistance to diseases in tomato (Andolfo et al. Reference Andolfo, Sanseverino, Aversano, Frusciante and Ercolano2014), Solanum (Zaitsev et al. Reference Zaitsev, Naroditsky and Khavkin2002) and wheat (Marone et al. Reference Marone, Panio, Ficco, Russo, De Vita, Papa, Rubiales, Cattivelli and Mastrangelo2012). In cassava, Louis & Rey (Reference Louis and Rey2015) evaluated the effect of immunity-related genes, including RGA on tolerance and recovery of plants infected with South African cassava mosaic virus; they identified that the contrasting varieties for virus resistance tend to express different RGAs in different sub-cellular targets and that amide-like indole-3-acetic acid and leucine-rich repeat-kinase were the types of resistance protein analogue domains conserved only in the resistant variety (TME3). Therefore, it is very likely that SNPs associated with CRR are associated with protein domains with a function in resistance induction.
In summary, this is one of the first studies on the use of GWAS in understanding the resistance of CRR, in which 38 SNPs associated with the severity caused by DRR (Fusarium), SRR (Phytophthora) and BRR (species of the family Botryosphaeriaceae) were identified. This research may contribute to further investigations into the existence of causal variants in candidate genes that may affect varietal resistance levels and then provide a basis for cloning of genes related to the resistance to these pathogens in order to understand the complicated molecular mechanism of cassava resistance to root rot disease. However, complementary studies should focus on candidate gene resequencing, fine QTL mapping, complementation studies, panel analysis of cassava germplasm with large numbers of accessions and validation of candidate gene expression in different genetic backgrounds and environments.
SUPPLEMENTARY MATERIAL
The supplementary material for this article can be found at https://doi.org/10.1017/S0021859617000612.
The authors thank the Fapesb, CAPES and CNPq for the financial assistance and scholarship support.