Global climate change has human health implications, both directly and indirectly. Increasing environmental temperatures increase risk for heat-related illness and injury. These direct heat-related health impacts can affect worker productivity and result in short- and long-term morbidity and even death.Reference Arbury, Jacklitsch and Farquah 1 – Reference Kjellstrom, Holmer and Lemke 4 Global climate change will increase the frequency and severity of natural disasters. 5 It is critical that disaster responders be prepared to operate in high heat environments and that actions are taken to prevent or mitigate heat-related health impacts that could decrease disaster responders’ effectiveness and result in adverse health outcomes.
The Deepwater Horizon (DWH) oil spill disaster response was impacted by heat. On April 20, 2010, the BP DWH offshore oil drilling rig exploded 50 miles off the Louisiana coast. 6 This resulted in the largest marine oil spill in US history, spilling more than 200 million of gallons of oil into the Gulf of Mexico and impacting 5 states (Texas, Louisiana, Mississippi, Alabama, and Florida). 7 The interagency disaster response was led by the US Coast Guard (USCG) and included approximately 47 000 responders at the height of the response. 6 While the official response lasted until December 2010, 6 much of the most intensive efforts occurred during the summer months of 2010. That summer was one of the 3 hottest summers for the southern United States in 117 years of recording. 8
A National Institute for Occupational Safety and Health (NIOSH) Health Hazard Evaluation of DWH Response Workers, conducted in June through August of 2010, found that “in most work sites evaluated, the conditions for heat stress were present, significant, and often the most pressing concern for the health and safety of response workers.”Reference King and Gibbins 9 Use of personal protective equipment (PPE), such as respirators and full-body Tyvek coveralls, may have increased heat stress beyond that caused by the environmental conditions. Heat was recognized by response leadership as a critical concern. On June 8, 2010, the Unified Area Command published a heat stress management plan that provided guidance on hydration, acclimatization, and work-rest cycles that differentiated recommendations based on use of certain types of PPE.Reference Michaels and Howard 10 , 11
Heat stress refers to conditions that impact an individual’s body temperature, which include air temperature, radiant temperature, humidity, air movement, clothing, and the metabolic heat generated by physical activity.Reference Kjellstrom, Holmer and Lemke 4 Heat-related illness includes a spectrum of conditions including heat cramps, heat syncope, heat exhaustion, heat injury, and heat stroke.Reference Epstein, Druyan and Heled 12 These conditions include a wide range of potential symptoms, including muscle cramps, nausea and vomiting, heat rash, lightheadedness or loss of consciousness, and confusion and other mental status changes. 13 Risk factors for heat-related illness include lack of acclimatization to a hot environment, poor physical fitness, obesity, sleep deprivation, excessive alcohol use, and certain medical conditions and medications. 13 – Reference Wallace, Kriebel and Punnett 15 While older age is considered a risk factor for heat-related illness in the general population, 13 US military surveillance has found younger males to be at increased risk. 16 US military surveillance has also found that those of Asian and Pacific Islander ethnicity are at increased risk. 16
There are different ways to quantify environmental heat. Wet bulb globe temperature (WBGT) is considered the gold standard. WBGT was developed in the 1950s for use in US military training in order to prevent heat injuries.Reference Budd 17 WBGT incorporates inputs that reflect 4 components of the thermal environment: air temperature, radiant temperature, humidity, and air movement.Reference Budd 17 While WBGT information may be readily available in certain settings, such as military training or high-heat workplaces, it is generally not available to the public. The heat index (HI), or apparent (“feels like”) temperature, is based on air temperature and humidity. 18 The HI has become widely available to the public through weather services and mobile applications. A study comparing WBGT and HI suggested that HI could substitute for WBGT as a measure of heat stress and standard for setting exposure limits, but may not perform as well as WBGT in environments with high radiant heat.Reference Iheanacho 19
Heat categories and recommendations to prevent heat-related illness for workers have been developed based on WBGT and HI. These include guidelines on fluid consumption, acclimatization, and work-rest cycles that depend on the level of heat stress.Reference Epstein, Druyan and Heled 12 The US military uses WBGT-based recommendations, 20 as seen in Supplemental Figure 1. The Occupational Safety and Health Administration has developed HI-based recommendations, 18 which have a different number of heat categories, different color scheme, and less prescriptive guidance for preventive measures, as seen in Supplemental Figure 2. Preventive guidance should take into account the type of clothing worn and PPE used. 13 , Reference Bernard 21 , Reference Bernard, Luecke and Schwartz 22
While there has been extensive study of heat stress and heat-related illness in occupational settings, few prior studies have focused on these conditions during disaster responses.Reference Garbern, Ebbeling and Bartels 23 During the 1993 Midwest floods response, which occurred in high heat and humidity conditions, heat-related injury was the most commonly reported injury among National Guard responders.Reference Dellinger, Kachur and Sternberg 24 A cross-sectional survey study of US Coast Guard responders to hurricanes Katrina and Rita in 2005 found that as many as 30% of responders reported heat stress–related symptoms.Reference Rusiecki, Thomas and Chen 25 A study of aid station visits during the 2010 DWH response found increased risk of exertional heat illness, as well as other acute injuries, on days with higher WBGT.Reference Garzon-Villalba, Mbah and Wu 26 In a disaster response scenario, health care visits likely only capture the tip of the iceberg of those with heat-related symptoms. Those with symptoms who do not seek care may experience physical or cognitive impairment that could decrease their mission effectiveness and result in safety risks to themselves and others.
Given the paucity of studies in the literature focused on heat stress and heat illness in a disaster response setting, we investigated the relationship between environmental heat exposure and heat-related symptoms among USCG responders to the DWH disaster. The relationship was analyzed using both WBGT- and HI-based heat exposure metrics, since WBGT is considered the gold standard but HI may be the only available metric in a disaster response scenario. Additionally, we evaluated the impact of use of PPE, which may have further increased heat stress.
METHODS
Study Design and Population
We evaluated cross-sectional data from a subset of responders in the DWH Oil Spill USCG Cohort.Reference Rusiecki, Alexander and Schwartz 27 The cohort includes responders (N=8696) that were USCG active duty or Selected Reserve personnel involved for at least 1 day between April 20 and December 17, 2010. Responders completed 1 or 2 computer-based surveys postdeployment. Those who completed the first released survey, which was administered June 25 through October 31, 2010, and contained a section on “heat stress,” were potentially eligible for the present study (N=3657). Those with deployments that extended beyond December 17, 2010 (N=1) or who reported a deployment location completely outside of the Gulf of Mexico region (eg, they worked at USCG headquarters in Washington, DC) (N=8) were excluded. Of the remaining 3648 study subjects, a small number (N=115, 3%) reported multiple deployments. This analysis is based only on surveys related to their first deployment.
This study was approved by the institutional review boards at the Uniformed Services University of the Health Sciences, the US Coast Guard, and the University of North Carolina, Chapel Hill.
Exposure Assessment
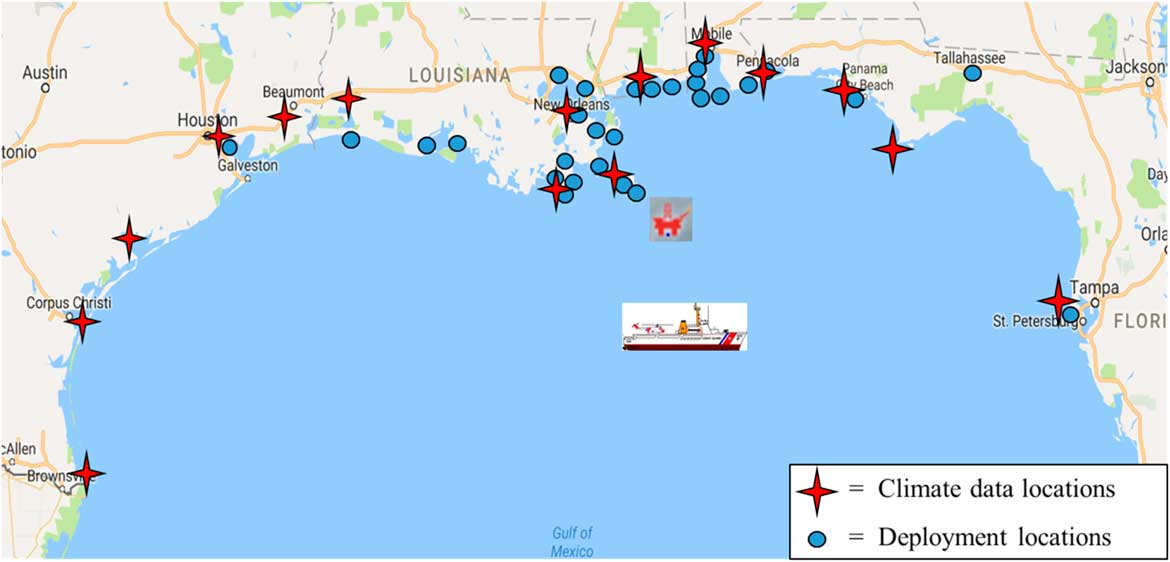
Environmental heat exposure was assessed using climate data together with deployment timing and location data from the postdeployment survey. Hourly WBGT and HI measurements from 15 airfields around the Gulf of Mexico (Figure 1) from April 20 to December 17, 2010, were provided by the US Air Force Weather Center. Daytime (7:00 am to 7:00 pm) hourly temperatures were used to generate daily WBGT mean, WBGT median, WBGT maximum, HI mean, HI median, and HI maximum for each location. Subjects’ reported locations and dates of deployment were linked with heat metrics from the nearest climate data location in order to generate means of the daily WBGT mean, median, and maximum and daily HI mean, median, and maximum experienced during each subject’s deployment. For subjects reporting multiple deployment locations, temperature metrics were based on a mean of the temperature measurements from all of the climate data locations closest to their deployment locations. Those who reported deployments on USCG cutters (N=210) were assigned the mean of all 15 climate data locations as a “whole-of-the-Gulf” estimate, since their exact location was unknown. Two additional temperature metrics were generated—the overall maximum single-day mean WBGT and mean HI experienced—in order to capture the hottest day of each subjects’ deployment.
Climate Data Locations and Reported Deployment Locations

The temperature metrics were dichotomized into lower and higher categories. The WBGT metrics were dichotomized at 85°F (29°C) for the variables based on means and medians, and 88°F (31°C) for the mean of the maximums and the maximum single-day mean temperature experienced, which correspond with cut points of WBGT heat categories used by the US military (Supplemental Figure 1). 20 The HI metrics were dichotomized at 95°F (35°C) for the variables based on means and medians, and 100°F (38°C) for the mean of the maximums and the maximum single-day mean temperature experienced. The HI cut-points do not correspond with any formal heat categorization scheme, but were chosen at approximate midpoints of the HI metric distributions.
The reported amount of time spent outdoors was also considered in determining environmental heat exposure and was based on a 5-point Likert scale item that queried “how often were you working in an outdoor environment?” The possible answers were “Never,” “Rarely,” “Sometimes,” “Most of the time,” or “All of the time.” This information was available for 2843 of the 3648 subjects (those who also completed a second survey instrument, launched in November 2010). For the remaining 805 subjects, time spent outdoors was imputed based on reported mission(s) performed, using the most common responses (ie, the mode) among the full cohort to the time outdoors question for each reported mission. Responders who reported a single mission were assigned the mode of time spent outdoors for that mission, while those who reported multiple missions were assigned a mean of the mode of time spent outdoors across all of their missions. Finally, the time spent outdoors was dichotomized to low (never, rarely, sometimes) and high (most of the time, all of the time) categories. Both the dichotomous time spent outdoors and dichotomous temperature metrics were combined to create a series of 4-level categorical variables indicating increasing levels of environmental heat exposure: lower time outdoors, lower temperature; lower time outdoors, higher temperature; higher time outdoors, lower temperature; and higher time outdoors, higher temperature.
Use of PPE that had potential to increase heat stress was considered as a potential modifier of the main effect and as an independent exposure. A “high-heat PPE” metric was defined as reported use (ever vs. never) of any of the following during the DWH response: Tyvek coveralls, respirator, personal flotation device, waders, protective headgear, or hard hat. Survey responders marked all types of PPE they used during their deployment, without further detail on how often they were used.
Health Effects/Symptoms
Symptoms were based on responses to questions in the heat stress section of the survey. The primary outcome was a composite “heat-related symptoms” metric, which included reporting of any of the following items: cramps/nausea, confusion, loss of consciousness/fainting, heat rash, dry/hot skin, heat stress “other,” or sought medical treatment for heat stress. Some of these items were also considered individually, as described below.
Statistical Analysis
All statistical analyses were conducted using Stata IC/14.2 for Windows. Descriptive statistics were generated for demographics, deployment characteristics, lifestyle factors, exposures and outcomes. Associations of deployment mission(s) performed and self-reported heat-related symptoms were evaluated with Pearson chi-square tests.
To investigate associations between environmental heat exposure categories and heat-related symptoms, we used Poisson regression with robust error variance to estimate prevalence ratios (PR) and 95% confidence intervals (CI) because of the cross-sectional nature of the data and the relatively high prevalence of the outcomes.Reference Zou 28 , Reference Thompson, Myers and Kriebel 29 We adjusted our models for potential confounding factors that were associated, in bivariate models, with both exposure and outcome at P<.2. These included age, gender, ethnicity, average amount of sleep per night, and reported exposure to oil or carbon monoxide (both queried as ever vs. never). We calculated the PR and 95% CI for reporting at least one heat-related symptom (ie, the composite heat-related symptoms measure) in relation to increasing levels of environmental heat exposure for each of the WBGT- and HI-based environmental heat exposure variables. The same regression model was used to evaluate associations between environmental heat exposure and individual symptoms of interest; however, for these analyses the environmental heat exposure categories were considered as 3-category metrics with categories of increasing heat exposure defined as lower time outdoors and any temperature, higher time outdoors and lower temperature, and higher time outdoors and higher temperature. Cramps/nausea and heat rash were the individual symptoms chosen due to their potential for operational impact and adequate counts of those reporting the symptoms to allow statistical analysis.
We evaluated the impact of use of high-heat PPE as a potential effect modifier and as a main effect. We examined associations between environmental heat exposure and heat-related symptoms in models stratified by individuals’ reported use of high-heat PPE. We tested this interaction by including a multiplicative interaction term between high-heat PPE and the environmental heat exposure measures. These models were adjusted for age, gender, ethnicity, average amount of sleep per night, and reported exposure to oil or carbon monoxide.
As an independent exposure, we examined the association of use of high-heat PPE with the composite heat-related symptoms measure as well as with several individual symptoms, comparing individuals who reported use of high-heat PPE to those who did not. These analyses were conducted using 2 regression models: model 1 adjusted for age, sex, ethnicity, and sleep, and model 2 included these and reported oil and carbon monoxide exposure. We adjusted for oil and carbon monoxide exposure in the second model because these are expected to be independently associated with both high-heat PPE use and heat-related symptoms, and thus may confound associations between PPE use and symptoms. However, inclusion of these predictors of PPE use in models may result in over-adjustment; therefore, we present results both adjusted for and not adjusted for these chemical exposures.
RESULTS
Descriptive characteristics of the study population are shown in Table 1. Most (84%) of the subjects were male, 59% were under 35 years of age, and almost half were in the lower enlisted ranks. The median deployment length was 51 days, with a range of 1 to 204 days. More than half of the subjects reported spending most or all of their deployment work time outdoors. More than two-thirds experienced a maximum single-day mean HI of greater than 100°F (38°C) during their deployment. Oil exposure was reported by 24% of subjects. Use of high-heat PPE was reported by 60% of subjects. Less than 1% of responders reported having sought medical treatment for heat stress (N=26), yet 437 (12%) reported any heat-related symptoms.
Characteristics of 3648 US Coast Guard Deepwater Horizon Responders

a WBGT, wet bulb globe temperature; HI, head index; PPE, personal protective equipment.
b AI, American Indian; AN, Alaska Native; NH, Native Hawaiian; PI, Pacific Islander.
c Numeric rank/grade level: E, enlisted; W, warrant officer; O, officer.
d Use of any of the following: Tyvek suit, respirator, waders, personal flotation device, protective headgear, or hard hat.
e Answered yes to any of the following: confusion, loss of consciousness/fainting, cramps/nausea, heat rash, dry/hot skin, heat stress “other,” or sought medical treatment for heat stress.
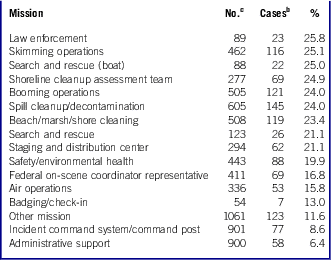
Table 2 shows the percentage of those who reported performing specific missions and also experiencing any heat-related symptoms (limited to missions reported by at least 50 responders). Missions with the highest numbers and proportions of individuals reporting heat-related symptoms included law enforcement, search and rescue by boat, booming and skimming operations, shoreline cleanup, and spill cleanup/decontamination. Missions with the lowest proportions of individuals reporting heat-related symptoms included administrative and command post.

a Includes missions reported by at least 50 responders.
b Answered yes to any of the following: confusion, loss of consciousness/fainting, cramps/nausea, heat rash, dry/hot skin, heat stress “other,” or sought medical treatment for heat stress.
c Number of subjects who reported performing mission (subjects could report more than 1 mission).
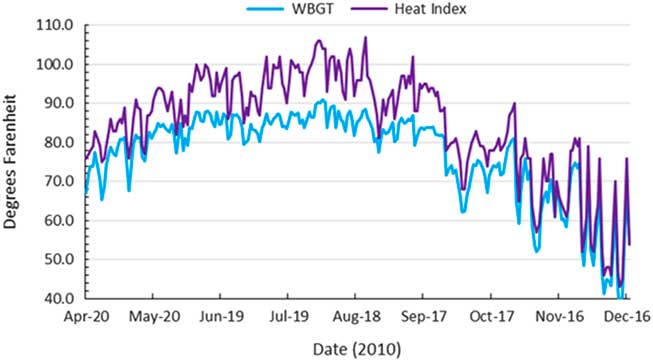
Figure 2 provides an example of the daily temperature trends (both WBGT median and HI median) at a central location (New Orleans, Louisiana) through the duration of the response. The median daily WBGT was higher than 85°F (29°C) and the median daily HI higher than 95°F (35°C) from early June through mid-September.
Daily Median Wet Bulb Globe Temperature and Heat Index for New Orleans, Louisiana.

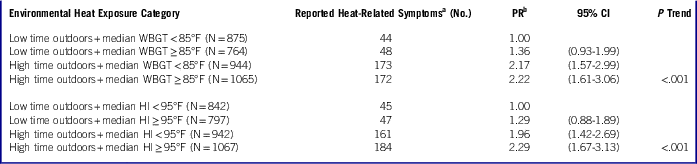
Increasing levels of environmental heat exposure, assessed as both WBGT and HI, were associated with increased prevalence of reporting any heat-related symptoms (Table 3). Responders in the highest environmental heat exposure categories had more than twice the prevalence of heat-related symptoms than did those in the lowest exposure categories (WBGT: PR=2.22 [95% CI: 1.61, 3.06]; HI: PR=2.29 [95% CI: 1.67, 3.13]). Results were similar using all 8 categorical exposure variables (Supplemental Table 2). All analyses showed a significant exposure-response trend (P<.001). Results did not change substantively in analyses restricted to the 2843 responders with self-reported (vs. imputed) time spent outdoors (data not shown).
Associations Between Environmental Heat Exposure (Median WBGT- and Median HI-Based Categories) and Reporting of Any Heat-Related Symptoms a

a Answered yes to any of the following: confusion, loss of consciousness/fainting, cramps/nausea, heat rash, dry/hot skin, heat stress “other”, or sought medical treatment for heat stress.
b Adjusted for age, sex, ethnicity, sleep, oil exposure, and carbon monoxide exposure.
Associations of environmental heat exposure with cramps/nausea (N=120) and heat rash (N=216) are shown in Supplemental Table 2. We observed a PR of 2.34 (95% CI: 1.33, 4.10) for cramps/nausea for the highest WBGT median–based environmental heat exposure category compared to the lowest, and there was a significant exposure-response trend (P=.004). We observed a similar PR of 2.47 (95% CI: 1.40, 4.33) for this outcome using the HI-median based environmental heat exposure category, also with a significant exposure-response trend (P=.002). Associations were also observed between environmental heat exposure and heat rash (WBGT median–based category: PR=1.73 [95% CI: 1.19, 2.52]; HI median–based category: PR=1.87 [95% CI: 1.29, 2.72]) and exposure-response trends were significant (P=.008 for WBGT-based and P=.001 for HI-based categories).
Results of analyses stratified by use of high-heat PPE are shown in Table 4. The strata were notably uneven in numbers of subjects and numbers of those with symptoms, with many more in the stratum that used high-heat PPE. Among responders who did not use high-heat PPE, the highest WBGT median–based environmental heat exposure category was associated with an elevated PR of 2.23 (95% CI: 1.10, 4.51). Contrary to expectation, among responders who did use high-heat PPE, the corresponding PR was a more modestly elevated 1.64 (95% CI: 1.14, 2.36). Results were similar using the HI median–based environmental heat exposure categories (Table 4). Tests for interaction were statistically significant for use of high-heat PPE and both WBGT median-based (P = .041) and HI median-based (P = .036) categorical environmental heat exposure variables (modeled as ordinal). Results for stratified analyses using all of the environmental heat exposure metrics can be found in Supplemental Table 3.
Associations Between Environmental Heat Exposure (WBGT Median– and HI Median–Based Categories) and Reporting of Any Heat-Related Symptoms a Stratified by Use of High-Heat Personal Protective Equipment (PPE) b

a Answered yes to any of the following: confusion, loss of consciousness/fainting, cramps/nausea, heat rash, dry/hot skin, heat stress “other,” or sought medical treatment for heat stress.
b Use of any of the following: Tyvek suit, respirator, waders, personal flotation device, protective headgear, hard hat.
c Adjusted for age, sex, ethnicity, sleep, oil exposure, and carbon monoxide exposure.
Finally, use of high-heat PPE was considered as an independent exposure. Supplemental Table 4 shows that across a range of heat-related symptoms, over 80% of responders reporting these symptoms also reported use of high-heat PPE. The prevalence of reporting any heat-related symptoms was higher among those who used high-heat PPE compared to those who did not (PR=3.97 [95% CI: 3.07, 5.15]), after adjustment for age, gender, ethnicity, and sleep. The PR remained significantly elevated, but was attenuated, in models additionally adjusted for oil and carbon monoxide exposure (PR=2.30 [95% CI: 1.74, 3.03]). Most individual symptoms were also strongly associated with use of high-heat PPE in models both with and without adjustment for oil and carbon monoxide exposure (Supplemental Table 4).
DISCUSSION
The DWH disaster response involved many potential occupational exposures with health implications, including environmental heat and use of PPE. Our study found increased prevalence of reported heat-related symptoms in USCG DWH disaster responders who experienced higher environmental heat, after adjustment for several important factors. We observed modification of the effect of environmental heat on heat-related symptoms by use of high-heat PPE, with greater magnitude of association among those who did not use PPE compared to those who did. When high-heat PPE was considered as an independent exposure, it was associated with increased prevalence of reported heat-related symptoms.
While the NIOSH Health Hazards Evaluation identified few medical encounters clearly related to heat illness, symptoms consistent with heat stress were some of the most commonly reported.Reference King and Gibbins 9 Similarly, our study found that only 26 individuals out of 3648 reported having sought medical treatment for heat stress, but almost 17 times as many reported experiencing any heat-related symptoms. The numbers of those reporting heat-related symptoms varied across missions performed, with higher reporting among those who performed missions with greater time spent outdoors, with higher likelihood of using PPE, and that were more physically taxing. Not surprisingly, those who performed more administrative and indoor missions had lower reporting of heat-related symptoms.
Many reports credit the overall attention to heat as a health risk, and specifically the Heat Stress Management Plan implemented by the Unified Area Command on June 8, 2010, with preventing any heat-related deaths or severe heat illness in DWH responders.Reference Michaels and Howard 10 , 11 The Heat Stress Management Plan included recommendations for work-rest cycles, which were based on whether certain PPE was used. 11 For example, those using coveralls or respirators were advised to rest for 40 minutes for each 20 minutes worked, while all others were to rest 20 minutes for every 40 minutes worked. 11 This plan did not include specific temperature–based guidance such as that found on WBGT-based heat category recommendations (Supplemental Figure 1), but more stringent standards may have been applied at individual workplaces (eg, it was noted that in some areas a 10:50 work-rest cycle was implemented).Reference King and Gibbins 9
We evaluated the impact of PPE use in 2 ways. Stratifying by use of high-heat PPE, surprisingly we found weaker associations between environmental heat exposure and heat-related symptoms in those who used high-heat PPE than in those who did not. This may indicate that preventive guidance was enforced more strictly for those using types of PPE that increased heat stress. However, these results should be considered with caution given the small numbers of individuals in the strata that did not use high-heat PPE. When considered as an independent exposure, use of high-heat PPE was significantly associated with the composite heat-related symptoms metric as well as individual symptoms, after adjustment for important factors. We recognized that PPE use was highly associated with exposure to oil and carbon monoxide and that a multivariate model including those exposures may over-adjust for confounding. Indeed, the magnitude of association was attenuated, but remained significantly elevated, when exposure to oil and carbon monoxide was included in the model. It should be noted that, generally, individuals are unlikely to know if they have been exposed to carbon monoxide, a colorless and odorless gas. This survey item likely served as a proxy for exposure to motor exhaust or perceived exposure to hazardous gases. Additionally, our PPE analysis is limited by unknown intensity of use (ie, how often, how many hours per day) among those who reported using types of PPE that may have increased heat stress.
Our study is unique in its use of individualized heat exposure metrics derived from climate data from 15 different locations and reported amount of time spent outdoors, providing categorical estimates of the environmental heat experienced throughout the course of subjects’ deployments. Prior studies evaluating the association of heat exposure and health outcomes in disaster responders have focused on acute heat exposure rather than cumulative, and have not individualized the heat exposure. Garzon-Villalba et al. identified 1701 cases of exertional heat illness seen at DWH aid stations between May 2010 and March 2011 and correlated them with daily temperatures.Reference Garzon-Villalba, Mbah and Wu 26 There was increased risk of exertional heat illness and other acute injuries when the WBGT (as determined for the region based on 2 climate data sites) was higher on the day of or day before the aid station visit.Reference Garzon-Villalba, Mbah and Wu 26
This study had several strengths and limitations. A strength was that we were able to compare associations based on several WBGT- and HI-based categories of environmental heat exposure and demonstrate similar results. The cross-sectional survey study design had both strengths and limitations. The survey allowed greater capture of heat-related symptoms experienced by responders than did medical visit data. While accuracy of recall of such symptoms is likely to diminish over time, 95% of surveys were completed within 30 days of the last day of deployment. The cross-sectional study design limited our ability to assess the temporality of exposures and outcomes. We lacked certain information on potential risk factors for heat-related illness, such as alcohol use, body mass index, and physical fitness level. This concern is somewhat lessened by the fact that our study subjects were all USCG members, who must meet health and fitness standards for service retention. However, there is risk of a “healthy worker effect” given the USCG study population, which may limit generalizability to other disaster responders. Another limitation is the nonspecific nature of the symptoms that were queried by the survey. Some of them could be associated with other exposures that were encountered by many DWH disaster responders. We adjusted for reported oil and carbon monoxide exposure in our main analyses in order to attempt to mitigate this issue. Finally, the clinical and operational impacts of the symptoms in those who reported them are unclear; future efforts should attempt to clarify these impacts.
CONCLUSIONS
Among USCG responders to the 2010 DWH oil spill, those who experienced higher levels of environmental heat had higher prevalence of reported heat-related symptoms. Those who used PPE that may have increased heat stress also reported more heat-related symptoms. It is possible that these heat-related symptoms could have been prevented with more aggressive preventive guidelines based on environmental heat thresholds. We utilized environmental heat exposure categories based on both WBGT and HI metrics and found similar results, which suggests that either WBGT- or HI-based prevention guidelines may be appropriate to use in disaster responses. Future efforts to develop HI-based recommendations that are structured similarly to the existing WBGT-based standards are warranted, so either could be rapidly implemented depending on the temperature metric available.
Recently, the Lancet Commission on Health and Climate Change identified climate change as the greatest global health threat of the 21st century.Reference Costello, Abbas and Allen 30 , Reference Watts, Adger and Ayeb-Karlsson 31 Disaster response operations that are complicated by environmental heat are likely to occur with increasing frequency due to the impacts of global climate change, thus heat exposure is increasingly becoming an important occupational hazard for disaster responders. The changing global scenario was a motivation for carrying out our study and is a compelling imperative for further study of environmental heat impacts on disaster responders and refinement of preventive guidelines.
Acknowledgements
The authors would like to thank the US Coast Guard and the US Air Force Weather Center (14th Weather Squadron) for providing data for this study.
Funding
This study was supported by a National Institutes of Health grant (RO1ES020874).
Disclaimer
The content of this manuscript is the sole responsibility of the author and does not necessarily reflect the views, opinions or policies of Uniformed Services University of Health Sciences, the US Coast Guard, the Department of Homeland Security, the Department of the Air Force, or the Department of Defense.
Supplementary material
To view supplementary material for this article, please visit https://doi.org/10.1017/dmp.2018.120