Introduction
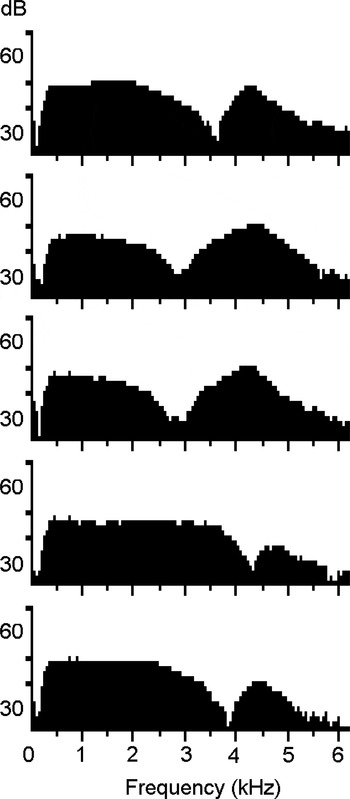
When measuring transient evoked otoacoustic emissions (TEOAEs) in children three years and older, the resulting stimulus spectrum sometimes contains a notch, and at the same time the response is usually diminished or absent. The notch may occur at 2.5 kHz or higher. During a study which measured TEOAEs in four-year-old children, at the Malmö ENT clinic,Reference Grenner, Tideholm, Hinriksdóttir and Carlborg1 we saw frequent examples of these notches in children with weak or absent TEOAEs. Examples of notched stimulus spectra from children and adults with secretory otitis media are shown in Figure 1.
Examples of notched stimulus spectra from transient evoked oto-acoustic emission measurements in children and adults with otoscopically verified secretory otitis media.

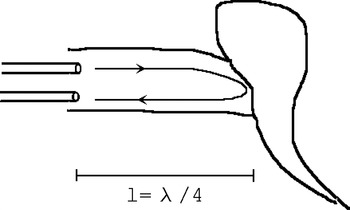
The amount of acoustic reflectance from the tympanic membrane depends on its stiffness. At a certain frequency (f), the sound from the probe loudspeaker will be reflected in reverse phase to the probe microphone (Figure 2). Here, we assume that the two probe openings are close together, that the diameter of the ear canal is small compared with its length, and that the tympanic membrane can be approximated to a flat surface perpendicular to the external ear canal axis. A cancellation of the sound will then occur when the distance from the probe tip to the eardrum (l) is one-quarter wavelength. If the corresponding wavelength λ is 4 * l, then the corresponding frequency is f = v/4 * l, where v = 343 m/s. For example, an adult ear canal with a length of 30 mm has a corresponding ear canal reflectance at 2858 Hz. This frequency coincides with the resonance frequency of the ear canal. In other words, if a notch is found in the OAE stimulus spectrum, some information can be gained even in the absence of a response.
Diagram illustrating reflectance of the acoustic stimulus from the tympanic membrane back to the probe, at a frequency corresponding to one-quarter wavelength.

One aim of this paper is to report that the middle-ear status in some patients can be deduced from the OAE stimulus spectrum. The other aim is to encourage equipment producers to place more emphasis on the information contained within the stimulus spectrum.
Materials and methods
In experiments one and two, the ILO 92 OAE analyser (Otodynamics, Hatfield, UK) was used with software version 5.60E and a standard adult TEOAE probe (one speaker, one microphone). Calibration was performed in accordance with the manufacturer's specifications. The stimulus level was adjusted to 82 dB peak sound pressure level in all cases.
In experiment one, a 2.5 ml plastic syringe served as a simple model of an ear canal with variable length (0–41 mm; diameter, 8.7 mm; tip cut away). The conical rubber plunger tip was used to model a reflecting ear drum. The length of the cavity was measured from the probe tip to half the height of the rubber cone (height, 2 mm). The distance between probe openings was 1 mm.
Experiment two was performed on a 41-year-old, male subject with a normal middle ear and strong oto-acoustic emissions. The right ear was chosen for all measurements. An experimental pressure chamber in the Malmö ENT department (at sea level) was used.
Experiment three was identical to experiment one, except that a Madsen Capella OAE analyser (GN Otometrics, Denmark) was used.
Results
Experiment one
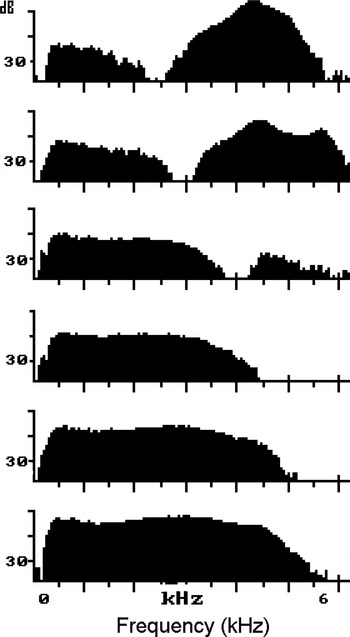
The length of the syringe cavity was varied, and this changed the position at which a notch could be detected (Figure 3). The notch could barely be visualised if it overlaid the 4 kHz point; this corresponded to an ear canal shorter than 22 mm. Therefore, no notch could be expected in infants.
Printouts of stimulus spectra in an ear canal model comprising a 2.5 ml syringe with a length varying from 35 mm (upper panel), through 29, 22, 19 and 16 mm, to 13 mm (lower panel), illustrating the influence of ear canal length on stimulus spectrum.

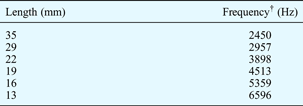
Table I shows calculated notch frequency data for the same cavity lengths, according to the quarter-wavelength explanation given in the Introduction.
Calculated notch frequency for different cavity lengths*
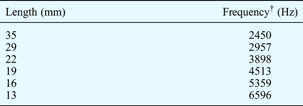
* According to the quarter wavelength model; see Introduction. †Frequency = v/4*length, where v = 343 m/s and length = distance from probe tip to tympanic membrane.
Experiment two
The subject was seated in a pressure chamber, in which pressure was varied from ambient air pressure to +400 daPa. This resulted in a relative under-pressure in the middle ear. The peak tympanometric pressure at the highest pressure load was –350 daPa. The notch in the TEOAE stimulus spectrum reached different depths with different pressure loads (Figure 4).
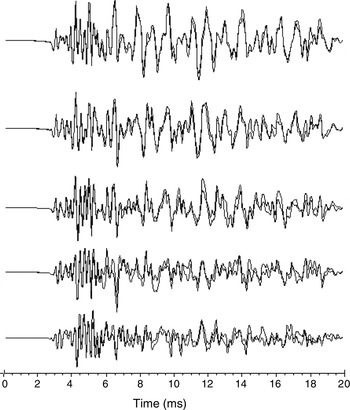
Printouts of stimulus spectra for varying degrees of tympanic membrane stiffness due to different levels of middle-ear under-pressure. Chamber pressure ranges from 0 daPa (upper panel) to +400 daPa (lower panel), in 100-daPa steps. The y axis for each panel represents a range from 25 to 55 dB. FFT = fast Fourier transformation.

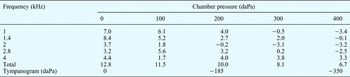
In Figure 4, the middle panel, taken with +200 daPa chamber pressure and resulting peak tympanometric pressure of −185 daPa, shows a clearly distinguishable notch. This notch, at 2.3 kHz, corresponds to an eardrum-to-probe length of 37 mm. Corresponding TEOAEs were also measured, and are shown in Figure 5, while Table II shows sound pressure levels per frequency band for various degrees of relative under-pressure in the middle ear. As expected, changes in the tympanic membrane pressure load predominantly affected the low frequencies. Other results from this experiment have been reported previously.Reference Konrádsson, Svensson, Carlborg and Grenner2

Sound pressure level per frequency band (dB SPL) for differing middle-ear under-pressure

Experiment three
A syringe model of the ear canal was examined using the Madsen Capella OAE analyser. The same notch as in experiment one was found in the stimulus spectrum. However, the display only showed frequencies up to 4 kHz, and therefore the demonstration of a notch required a slightly longer ear canal than when using the Otodynamics OAE analyser (which showed frequencies up to 6 kHz).
Discussion
Experiment one showed that the position of the notch depends on the ear canal length, whereas experiment two demonstrated that the depth of the notch depends on the degree of stiffness of the tympanic membrane. There are many published reports investigating the connection between middle-ear status and OAEs, but these have understandably focused on the emission response rather than the stimulus spectrum. At the Lund and Malmö ENT departments of Scania University Hospital, the notch in the TEOAE stimulus spectrum has been used for many years to identify a stiff tympanic membrane, as reported in previous publications from the department.Reference Konrádsson, Svensson, Carlborg and Grenner2, Reference Grenner3 However, it appears that knowledge of this simple but clinically very useful observation is not widespread. A similar notch has also been noted by Marshall et al. Reference Marshall, Heller and Westhusin4
• Pay attention to the stimulus spectrum during otoacoustic emission measurement
• A notched stimulus spectrum indicates a stiff tympanic membrane
• Such a notch will not be found in infants
In both types of OAE analyser used in this study, the stimulus spectrum was shown briefly during the ‘check fit’ procedure, but was then hidden from the operator. The only way of viewing the information again was to request a printout copy of the completed test, by which stage it was easy to forget to check whether a notch was present or not. Earlier Otodynamics equipment models had presented the stimulus spectrum routinely on the screen, but unfortunately this was no longer the case in the version 6 software. It is suggested that the software developers include a facility for automatic detection of a stimulus spectrum notch if present.
The depth of the observed notch has been shown to depend on the amount of reflectance from the tympanic membrane; it could also be expected to depend on the angle between the tympanic membrane and the ear canal. Curvature of the ear canal may also affect the depth of the notch. It would be possible to examine these factors using a wide-band tympanic membrane reflectance meter.
An important limitation of the utility of the stimulus spectrum notch is that the neonatal ear canal is so short that a notch cannot be seen, since the ear canal resonance falls above the displayed frequency range. However, in adults and children aged two to three years and above, the presence of a visible notch indicates a stiff tympanic membrane, most commonly due to middle-ear under-pressure or secretory otitis media, whereas the absence of a TEOAE response in combination with a flat stimulus spectrum points towards sensory hearing loss, or possibly a conductive hearing loss without increased tympanic membrane stiffness.
The Madsen OAE analyser used in this study had a more limited frequency spectrum and consequently required a slightly longer ear canal in order to display a notch.
Conclusion
The OAE stimulus spectrum should be carefully inspected, as a notch may indicate increased stiffness of the tympanic membrane, raising suspicion of low middle-ear pressure or secretory otitis media. This finding is not applicable to infants, as such notches are not found in this age group.