1. Introduction
The Mekong River (MR) is the major water source in southeast Asia, flowing through or forming the borders of six countries: China, Myanmar, Laos, Thailand, Cambodia and Vietnam. The MR is not only the source of food, water and transport for more than 70 million people from more than 90 distinct ethnic groups, but the river basin is also home to more than 1,300 species of fish, creating one of the most diverse inland fisheries in the world (Campbell, Reference Campbell2009; Osborne, Reference Osborne2010). Over the years there has been conflict and cooperation on water-resource management aimed at accommodating population growth, climate change and economic development.
Although the four downstream nations in the Lower Mekong Basin (LMB), i.e., Thailand, Laos, Cambodia and Vietnam, signed the 1995 Mekong Agreement and formed the Mekong River Commission (MRC) to promote the development and management of the LMB and its resources in a sustainable manner (MRC, 2005), the sustainable development provision remains largely ambiguous due to the lack of a legal framework and procedural elements for management (Browder, Reference Browder2000; Phillips et al., Reference Phillips, Daoudy, Öjendal, Turton and McCaffrey2006; Bearden, Reference Bearden2009; Osborne, Reference Osborne2010). Furthermore, the MRC is also said to have a strong political bias in favor of economic development through hydropower generation and against (subsistence) fishery and other stakeholders (Sneddon and Fox, Reference Sneddon and Fox2006).
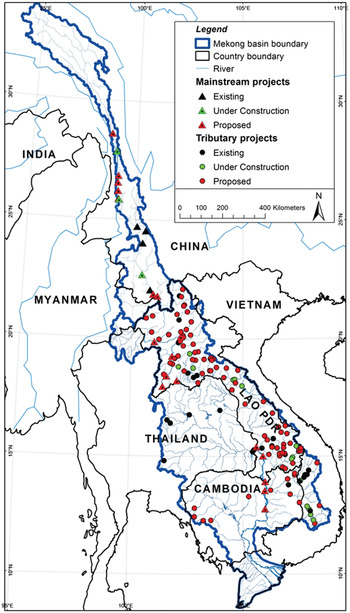
Dam construction in the mainstream of the MR in China reduced fisheries, and plans for 11 more mainstream dams in the LMB by the year 2030 are a serious threat to fisheries (Ziv et al., Reference Ziv, Baran, Nam, Rodríguez-Iturbe and Levin2012). There are also dams constructed in the tributaries of the LMB and plans for many more. Figure 1 illustrates all existing and planned dams. Because of filling these dams and the ambitious plans for expanding irrigation, water allocation is also one of the increasingly important interdependency concerns in the Mekong River Basin (MRB). All these issues are a source of increasing tensions between the countries that share it (Campbell, Reference Campbell2009).
A map of the Mekong River Basin with all existing and future dam projects
Source: http://mekongriver.info/hydropower.

In many trans-boundary water-resource sharing problems, allocation outcomes are determined not only by economic considerations but also by the distribution of political and bargaining power. Hence, water accrues more often simply to the most powerful riparian state within a basin. For the MR, developments that are taking place in upstream and downstream tributaries are expected to affect the downstream communities at different levels. Moreover, the upstream country, China, has unquestionably greater political and hydrological power. Much of the debate among the member countries is related to the operation of current dams and plans for expansion of dam capacity. Therefore, there is a need to design workable policies that can help manage the upstream–downstream water use to satisfy all the countries involved.
The literature on water resources management based on game theory approaches (Dinar et al., Reference Dinar, Ratner and Yaron1992; Dinar and Dinar, Reference Dinar and Dinar2003; Madani, Reference Madani2010, and the references therein), shows that sharing the total economic benefits from cooperation among the river basin countries, if it is attainable, gives rise to Pareto improvement. That is, either every country is better off or none is worse off. Even if some countries are not better off, there is still a possibility of being compensated if the total gain is larger than without cooperation. This implies that one can hope to bring agreement(s) and thereby cooperation on how to mitigate conflicts over water.
In this study we view the MRB as a trans-boundary water resource, shared by two regions: China upstream and the LMB downstream. Currently, cooperation between these regions is lacking. Furthermore, the MRC, which only represents the LMB, has weak policy instruments and seems politically biased to favor hydropower generation (Grumbine et al., Reference Grumbine, Dore and Xu2012). Our aim is to investigate the welfare improvements arising from: (1) strengthening the MRC's governance by incorporating the interests of all stakeholders in case of no joint management with China; (2) joint management of the MR by a wider and stronger MRC that includes China; and (3) the effects of improved governance by the MRC before it engages in negotiations for joint management with China and the resulting distribution of welfare gains. For these purposes, we apply a welfare-improving bargaining approach to an empirical hydro-economic model of the MRB. This allows us to analyze the welfare changes from non-cooperation to cooperation. We consider the following major economic issues in the MRB: increasing dam capacity for hydropower generation and its externalities on fishery; industrial and households’ activities; irrigated agriculture; and the environmental services or damages (i.e., wetland benefits or damages from reduced flushing of salinity in the wet season). In addition, it is believed that the highly centralized Chinese government has more of a grip on its water resources than the fragmented MRC with its less effective management. We will, therefore, analyze the implications of different distributions of bargaining power when a joint management approach is proposed. To analyze the welfare and the implications of strengthening the MRC's governance, we consider both weak and strong governance structures in our framework. Particularly, the current situation represents ‘weak’ governance in which the different water users maximize their own profits without taking into account the externalities they cause and where the interests of dam operators are given priority. Strong governance is represented by a structure in which the MRC's regional welfare will be optimized. This allows us to compare the welfare gains from improved river management of the MRC.
This paper is organized as follows: the next section briefly describes the model. Section 3 presents the simulation results of our model. In section 4, we discuss policy implications and opportunities that can enhance regional cooperation. Finally, in section 5 we provide some concluding remarks.
2. The model framework
We present an informal description of our model in this section and refer to Appendix A for its full specification. The model consists of water balances as well as benefits and costs from water use and dam construction. Of interest is how the actual situation of non-cooperation might evolve in the year 2030. We consider several scenarios of non-cooperation and cooperation.
2.1. Water balances and economic values
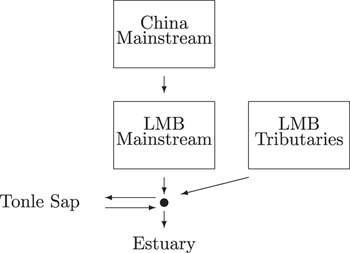
Our model represents the physical hydrological basin reality with a water flow from China to the LMB and the distinction between mainstream and tributaries for the LMB. Basin-wide water availability is determined by either precipitation or water flows from China. We distinguish two regions: China and the LMB. The LMB is subdivided into the mainstream, tributaries, Tonle Sap and the estuary. Figure 2 illustrates these regions and the water flows between subregions in our model.
The representation of the Mekong River Basin in the model, where each box represents a subregion

In each (sub)region, water users are aggregated into four representative water users: industry and households, hydropower generators, agricultural irrigators and fishery. We neglect navigation in this version of modeling because most of the river is unnavigable. Although flood damages occur, flooding can also have a positive net effect because it fosters fish reproduction, carries sediments containing nutrients for agriculture, has wetland benefits and flushes salinity in the estuary (Campbell, Reference Campbell2009; Osborne, Reference Osborne2010). We focus on fishery and salinity. Industry and households and irrigation withdraw water from the basin, whereas hydropower generation and fishery both perform in-stream functions.
The existing dams in China are all built in the mainstream of the MR and can be seen as a cascade of mainstream dams, while all existing dams of the LMB are dams in its tributaries. The controversy is about future plans for another three or four mainstream dams in China, 11 mainstream dams in the LMB, and more dams in the tributaries of the LMB. There is a subtle difference between dams in the tributaries and a cascade of mainstream dams, for the following reasons. A dam in tributary A cannot reuse water from a dam in tributary B and vice versa. So, planned hydropower generation of one unit of water at dam A and two units at dam B requires three units of water in total. In a cascade of mainstream dams, however, water entering the first dam of the cascade can be reused at all downstream dams for hydropower generation. So, for a cascade of mainstream dams A and B, the planned hydropower generation of one unit of water at dam A and two units at dam B requires only two units of water, which is the maximum of one and two. Dam capacity in our model is proportional to the maximal seasonal amount of water dedicated to hydropower generation and, independent of dams in the mainstream or its tributaries, this means taking the sum of such water use over dams. In our previous example, we always require a capacity of three units. For these reasons, we divide the LMB into the mainstream and its tributaries, as illustrated by figure 2.
Trans-boundary flows from China to the LMB are sensitive to changes in water use and storage management. The model introduced in Haddad, Reference Haddad(2011) has endogenous dam capacity whose additional construction costs are included with higher levels of capacity and hydropower generation. We extend his model and include other water uses (industrial and households, irrigation), fishery and flushing salinity in the estuary. Our model is a static annual model that has an explicit representation of space (upstream and downstream as well as mainstream and tributaries) and time (wet and dry seasons). Irrigation takes place in the dry season only. The reservoir is filled in the wet season for usage in the dry season. Investment in dam capacity refers to installed long-term capacity by the year 2030.
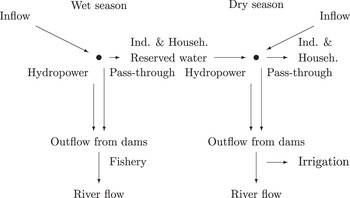
Specifically, during the wet season China's water resources can be used for industrial and household activities, storage for use in the dry season, hydropower generation that is reusable further downstream, and simply passing through a dam. China's outflow in the wet season fosters local fish reproduction before it runs to the mainstream of the LMB. During the dry season, water inflow plus the (fraction of) stored water can be used for similar purposes as in the wet season and outflow from the dams can also be used for irrigation. China's irrigation reduces the river flow to the LMB.
For the tributaries of the LMB, water inflow can be used for the same economic activities as in China and we model dams on tributaries similar to China's mainstream dams. The water inflow for the mainstream of the LMB consists solely of the outflow received from China. Future mainstream dams will only be used for hydropower generation. In the wet season, the outflow from mainstream and tributary dams inundates wetlands and Tonle Sap, fostering fish reproduction, and flushes salinity in the estuary. Figure 3 illustrates the water flows and uses in space and time for each subregion identified in figure 2.
Seasonal water flows per subregion. Mainstream downstream has no water use by industry and households and its inflow is river flow from upstream

Dam capacity is endogenous and damming disrupts fish migration and fish reproduction. Planned mainstream dams in the LMB are costly to its fishery, and less so at its tributaries and the mainstream of upstream China. The exact effects are unknown (Ziv et al., Reference Ziv, Baran, Nam, Rodríguez-Iturbe and Levin2012).
2.2. The Nash bargaining solution
In the China–LMB case, China's decisions may generate externalities affecting the LMB's water availability and its economic values. These externalities are negative if China stores more water in the wet season (i.e., reduced fish reproduction and flushing salinity), and positive if it increases the river flow to the LMB in the dry season, leading to less water scarcity for economic activities. Joint management of the MRB has to address all such externalities. Such management is currently lacking for the whole MRB. For decades, the World Bank the Asian Development Bank and other international donor organizations have been active in talks between the MRB's governments about joint management of the MRB, without success.
In this paper, we apply an axiomatic bargaining approach in the form of the asymmetric Nash bargaining solution (Nash, Reference Nash1950; Kalai, Reference Kalai1977) for our analysis. This solution maximizes an objective function that depends on the regions’ net benefits under cooperation, disagreement points defined as the region's net benefits under non-cooperation, and bargaining weights reflecting the relative power of the regions. The Nash bargaining solution allows an underpinning through the strategic alternating-offers model (Rubinstein, Reference Rubinstein1982; Binmore et al., Reference Binmore, Rubinstein and Wolinsky1986; Houba, Reference Houba2008).
The disagreement point plays an important role in the Nash bargaining solution. In the MRB, China is a highly centralized economy with a strong government, whereas the LMB downstream with its MRC can be regarded as a politically divided government with weak policy instruments. For that reason, we assume that China maximizes its own regional net benefit and internalizes its own regional externalities but not those externalities imposed upon the LMB. This maximal net benefit is the disagreement point of China in the negotiations for a joint river basin management.
For the LMB, we assume that the current governance is weak in the sense that dam operators and agricultural users in this region each optimize their own benefits without taking into account any regional externalities at all and taking externalities caused by China as given. In other words, we model the MRC as representing the interest of the dam operators (Sneddon and Fox, Reference Sneddon and Fox2006). Given the inflow from China, the LMB's dam operators maximize their economic benefit (plus the water use of industrial and household) before the LMB's irrigated agricultural sector makes its decision. Afterwards, the externalities to fishery and the estuary are determined. The sum of the net benefits over all four sectors determines the disagreement point of the LMB under weak governance in the negotiations for a joint river basin management.
As an alternative scenario, we also consider the case in which the LMB has strong governance, or the MRC representing all stakeholders. Then the disagreement point is derived in a way similar to that of China by determining the maximal regional net benefit that internalizes all regional externalities. The difference between the maximal net benefit under strong governance and the sum of net benefit of all stakeholders under weak governance yields the net benefit loss of weakly governed river basin management in the LMB.
The asymmetric Nash bargaining solution is given by maximizing the Nash bargaining objective function with bargaining power of
 $\alpha \in{\left[{1\over2}\comma \; 1\right]}$
and 1 − α for China and the LMB, respectively. These bargaining weights reflect the fact that China has more bargaining or political power than the LMB. An important part of the Nash bargaining solution is a (financial) transfer between China and the LMB. If China received a positive transfer, then this would reflect a compensation of China that has to take measures that cause positive externalities. If negative, it would reflect a compensation of the LMB for measures taken by China that cause negative externalities. The transfer could be financial or in kind, say, delivery of electricity or food grown in the region.
The model is calibrated and implemented in the numeric optimization software GAMS (Rosenthal, Reference Rosenthal2007). For the model equations and the calibration procedure, we refer the interested reader to the online supplementary appendices available at http://journals.cambridge.org/EDE.
3. Numerical analysis
In this section, we present our numerical results for weak and strong governance by the MRC in the absence of basin-wide joint management, as well as four scenarios of joint MRB management of a wider and stronger MRC, including China. All numerical results predict future water use and economic values for the year 2030. First, we present current economic values and water use based on the most recent data we could find from different sources (MRC, 2005, 2010; China Statistical Yearbook, 2011; FAO, 2012).
3.1. Current situation
The annual water inflows due to precipitation, the annual water withdrawals for industrial and household use, and annual water use for hydropower generation in 2010 are shown in table 1. China withdraws 6 per cent of available water inflows and the LMB 10.5 per cent. Water use for hydropower generation in 2010 is 119.664 for China and 102.555 km3 for the LMB, which are our own estimates. The MR is known for its large seasonal variability, with the ratio of 7:1 for water availability in the wet and dry season (Ringler et al., Reference Ringler, von Braun and Rosegrant2004). Using this ratio, we can easily attribute seasonal water inflows.

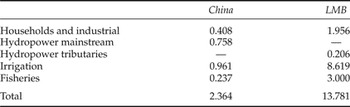
Table 2 shows the annual economic values per region for the four economic sectors identified in the previous section in the year 2010. The economic value of the LMB is the aggregate of the individual MRC members. Irrigation generates the highest economic value for both China and the LMB, contributing 40 per cent and 62.5 per cent of each region's aggregate economic value, respectively. The water use for irrigation is expected to increase further according to the AQUASTAT database (FAO, 2012). Water use for hydropower generation contributes the second highest economic value (32 per cent) for China, while fishery is the second highest (22 per cent) for the LMB. For the LMB, actual hydropower generation takes place in the tributaries and it occupies a mere 1.5 per cent of aggregate economic value, reflecting the undeveloped hydropower potential in the LMB. There are many plans for developing this huge potential through increased dam capacity. Table 2 clearly shows that the MR is an important source for irrigation and hydropower generation for China and an important source for irrigation and fishery for the LMB.

3.2. Future scenarios without joint management
We continue reporting two scenarios for the year 2030 under the previously discussed governance regimes of the MRC and under the absence of joint management for the entire basin. These scenarios provide an estimate of the welfare loss due to weak governance of the LMB and will determine the disagreement point in the bargaining.
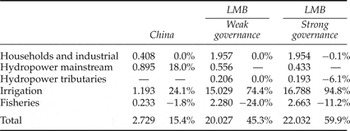
Table 3 presents the annual economic net values for both regions. This value is US$ 2.729 billion for China, US$ 20.027 billion for the LMB under weak governance, and US$ 22.032 billion for the LMB under strong governance. Compared to the year 2010, China will grow by 15.4 per cent, while the LMB will grow by 45.3 per cent and 59.9 per cent respectively. For China, growth is mainly driven by expansion of irrigated agriculture (24.1 per cent) and hydropower generation (18 per cent) and a minor contraction for fishery (1.8 per cent). For the LMB, irrigated agriculture still dominates and it grows by 74.4 per cent under weak governance and 94.8 per cent under strong governance. The economic value from hydropower generation in the LMB grows to 3.7 times its current value under weak governance (from US$ 0.206 billion to US$ 0.762 billion) and 3.04 times under strong governance (from US$ 0.206 billion to US$ 0.626 billion). The contraction of fishery in the LMB is 24 per cent under weak governance, while it is 11.2 per cent under strong governance. Clearly, fishery suffers under both scenarios and requires adequate compensation. Finally, by taking the difference of the total net economic values, we obtain that the future economic loss of weak governance for the LMB is US$ 2.005 billion.
Economic net values per sector under non-cooperation in 2030 (in billion US$ )

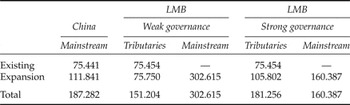
Table 4 presents existing dam capacity and future expansion. China currently has a dam capacity of 75.441 km3 built in the MR's mainstream, while dam capacity of the LMB is similar in size (75.454 km3) but entirely built in tributaries. China's future capacity expands by 48.2 per cent, which is in line with actual construction going on. Eleven mainstream dams are planned in the LMB that would install 376.257 km3 of dam capacity by our estimates. Under weak governance, 302.615 km3 (80.4 per cent) of this planned capacity is installed, which even exceeds dam capacity upstream. These results indicate that the stakes for damming the mainstream of the Lower MR are high. Also, Chinese construction and electricity companies, which are already active in the LMB, are eager to build and operate such dams. Together with the MRC's preferences for hydropower generation, this explains the persistence of plans for mainstream dams and this will continue.
Dam capacity under non-cooperation in 2030 (in km3)

Mainstream dams are more damaging to fishery than tributary dams. Weak governance of the LMB neglects this consideration and expands tributary dam capacity by 75.750 km3, roughly a quarter of mainstream expansion. Under strong governance of the LMB, the stakes of irrigated agriculture, fishery and losses from salinity are also taken into account. Then the dam capacity expansion in the mainstream drops to 160.387 km3, which is 42.6 per cent of the estimated planned capacity, and the increased capacity of tributary dams from 75.454 to 105.802 km3 partly substitutes for this drop.
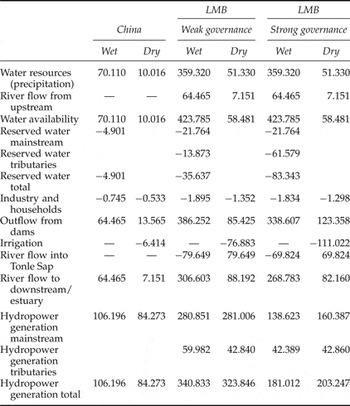
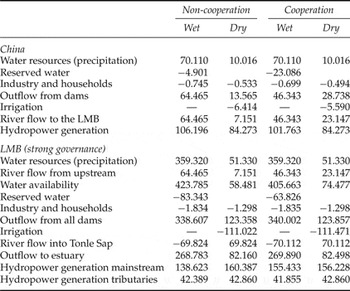
Table 5 shows the seasonal water balances in the
Seasonal water balances under non-cooperation in 2030 (in km3)

future. We discuss China first. In the wet season, industry and households withdraw 0.745 km3 of water. Given evaporation losses, upstream reserves 4.901 km3 in the wet season for use in the dry season. Hydropower generation by mainstream dams amounts to 106.196 km3 in the wet season and 84.273 km3 in the dry season. Annual hydropower generation of 190.469 km3 is 59.2 per cent above the current annual 119.664 km3. Irrigation in the dry season expands to 6.414 km3, which is 80 per cent above the current level. The river flow to the LMB is 64.465 km3 in the wet season and 7.151 km3\ in the dry season. This river flow is an externality that the LMB takes as given.
For the LMB, similar patterns can be observed for each governance regime, which we omit. More interesting are the differences between the governance regimes. What is striking is that the river flow of 268.783 km3 to the estuary in the wet season is much less under strong governance than the 306.603 km3 under weak governance, which is 63.7 per cent and 72.7 per cent of the current outflow, respectively. This seems counter-intuitive because strong governance takes into account the positive effects of a large river flow in the wet season on fishery and the losses of increased salinity in the estuary. Table 5 reveals the underlying logic for this result. Irrigated agriculture is the dominant sector of the LMB and, therefore, strong governance of the LMB reserves more water than weak governance (83.343 vs. 35.637 km3) to increase irrigation in the dry season (111.022 vs. 76.883 km3). Furthermore, strong governance of the LMB allows hydropower generation that is 2.7 times the current level and this is far less than the 5.5 times allowed under strong governance.
To summarize, the trade-off between on the one hand fishery and salinity in the estuary, and on the other hand dam expansion and reserving water for hydropower generation and irrigation turns out to be negative for fishery and salinity. Under strong governance the trade-off is the worst with respect to the wet season river flow to Tonle Sap and the estuary, but positive with respect to limiting the damming on the mainstream. Fishery and the losses of increased salinity require adequate compensation.
3.3. Future scenarios with joint management
In general, the absence of joint management in the entire basin is regarded as being economically inefficient because externalities are not internalized. In this section, we report simulation results for such joint management as the outcome of bargaining between China and the LMB. We run two scenarios for the distribution of bargaining power, being equal bargaining power α = 0.5 and China has the most bargaining power, say, α = 0.75, as well as two scenarios for the disagreement point of the LMB, the future welfare arising from weak and strong governance.
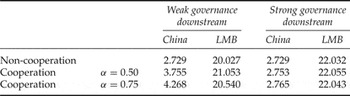
Table 6 presents the annual economic net values in the year 2030 for all four scenarios for joint management and the appropriate disagreement points. From this table, we can quantify the welfare gains from joint management. The total annual welfare gains are US$ 2.052 billion in the scenario where the disagreement point corresponds to weak governance of the LMB. The size of the welfare gains is independent of bargaining power, but the distribution of these gains over both regions is proportional to the bargaining weights. So, China receives a share of α of these US$ 2.052 billion and the LMB a share of 1 − α. In the scenario where the disagreement point corresponds to strong governance of the LMB, the total welfare gains from joint welfare become almost non-existent with a meager US$ 0.047 billion, which is independent of bargaining power and its distribution is proportional to the bargaining weights. Note that the LMB's gains of US$ 2.005 billion if it strengthens governance of the LMB plus the joint welfare gains of US$ 0.047 billion in this scenario sum up to the joint welfare gains of US$ 2.052 billion in the previous scenario. Hence, almost all of the maximal joint welfare gains can be realized by the LMB without the cooperation of China, simply by strengthening the governance by the MRC. As a side effect, this does not require enforcing China's cooperation politically nor militarily. Nevertheless, our simulation results indicate that there are large potentials for welfare gains in the MRB.
Aggregated economic net values for two governance regimes in 2030 (in billion US$ )

How to realize these welfare gains is a different matter. Let us take the perspective of the LMB first. If the interests of all stakeholders in this region can be equally balanced in the MRC, then the MRC and its stakeholders can secure almost all of the maximal joint welfare gains of US$ 2.052 billion and there is only a very weak incentive to negotiate joint management afterwards. If the MRC starts negotiating before aligning the interests of the stakeholders, then the larger part of the welfare gains that can be realized in the LMB will accrue to China. Clearly, the stakeholders in the LMB have no incentive to negotiate with China; perhaps a MRC with preferences for hydropower generation might have. From the perspective of China, the incentives are quite the opposite. This country has an incentive to negotiate with the current MRC and obtain a share that would otherwise go to the LMB's stakeholders. As mentioned before, China also has an incentive to promote the interests of its international construction and electricity corporations, which is not included in the model.
Because bargaining power and the disagreement points do not affect the negotiated joint management, we only report and discuss here the results on water balances under the scenario of a greater political and hydrological power for China (α = 0.75) and strong governance of the LMB. The seasonal water balances are shown in table 7, where we also include part of table 5 to facilitate comparison. The major difference between non-cooperation and joint management is that China increases the amount of reserved water from 4.901 to 23.086 km3, while simultaneously the LMB decreases the amount of reserved water from 83.343 to 63.826 km3. Recall that there is a cascade of mainstream dams along most of the MR by the year 2030. Water entering the most upstream dam of this cascade can be reused at all lower dams. It is therefore efficient to increase reserved water in China and decrease reserved water in the LMB. This is exactly what happens. The other water users behave more or less the same in both scenarios, except that China's irrigation is somewhat reduced by 0.824 km3 (12.8 per cent), a crowding out effect by the LMB's water uses.
Seasonal water balances under two scenarios in 2030 (in km3)

Finally, the results on dam capacity under joint management are almost identical to those of the disagreement point under strong governance of the LMB. We therefore forego discussing dam capacity under joint management.
4. Policy implications
Our results show that the countries in the LMB can benefit most from equally balancing the interests of all stakeholders in the MRC. The associated welfare gains are substantial, about 10 per cent of the future economic value of the LMB under weak governance. To realize these gains, it is inevitable that: two or three of the controversial mainstream dams (40 per cent) are built; large amounts of water in the wet season are reserved for use in the dry season; fishery shrinks; and losses from salinity in the estuary increase. This requires adequate compensation. There are numerous cases in which past promises for compensation were not fully kept (http://www.internationalrivers.org). Authorities, NGOs as well as the World Bank or the Asian Development Bank should pay closer attention to ensure that future compensations are both adequate and fully kept.
The LMB countries have no incentive to negotiate a wider MRC that includes China. China, however, does have strong incentives to negotiate joint management and to use the MRC to promote the interests of its international dam construction and electricity corporations. It therefore should consider playing a more active role in the MRC.
A reason for concern is that the LMB consists of individual countries and that the negative effects on fishery and salinity impact Cambodia and Vietnam the most. These issues are a source of increasing tensions that might destabilize the MRC and may lead to rushed unilateral decisions by the countries. For example, in 2011 Laos approved and prepared the construction of the Xajaburi Dam on the mainstream of the MR even though Cambodia and Vietnam are against it. Given the highly uncertain and possible large negative impact of this dam on the complex patterns of fish migration (Ziv et al., Reference Ziv, Baran, Nam, Rodríguez-Iturbe and Levin2012), this might trigger political instability and conflict in a region that had already had more than its share of conflict in recent history.
Negotiations on joint management are more difficult when one does not know in advance how much water supply or demand will be generated under future conditions (e.g., population growth, economic activities and climate change). Therefore, a first policy measure is to establish a legal framework for the joint management of the river. Improved sharing and dissemination of official data could also be a first small but essential step in achieving equally balanced interests of stakeholders that can later be followed by joint management. Hence, cooperation should start with a common perception of the status quo, including a mutual acceptance of aspects like the presence of claims to water, perceived property rights and official water use data (Janmaat and Ruijs, Reference Janmaat and Ruijs2007; Ansink, Reference Ansink2009). Consequently the negotiation process on the specifications of joint management or on a jointly supported principle for water use and sharing can begin.
5. Concluding remarks
Applying an axiomatic bargaining approach in the form of the asymmetric Nash bargaining solution to the MRB, this study examines the welfare improvements of strengthening the MRC and joint management. Our numerical analysis indicates that the welfare gains for the stakeholders in the LMB from strengthening the MRC are substantial. Hence, the MRC could benefit the MRB by obtaining a solid legal framework with strong procedural elements that can implement river basin management. The results also show that China can expand its dam capacity without the need for cooperation with the countries of the LMB. Strengthening the MRC's governance will increase the bargaining position of downstream countries by improving the downstream disagreement or fallback outcome and thus achieve higher benefits in cooperation. In fact, strengthening the MRC almost fully exhausts all welfare gains from joint management of a wider MRC that includes China. The countries of the LMB therefore have no incentive to start negotiations for joint management, whereas China has strong incentives.
All the simulations of our model show that the joint management of the MR is efficient. Therefore, the policy implication is to find ways to achieve joint management. This can begin with assistance to foster common perceptions, which should include the sharing of official data on water resources. Gradually the MRC should be expanded to include all the nations along the river for common development. Improved sharing and dissemination of official data could be a first small but essential step in achieving cooperation. Our methodology developed in this study can contribute to a better understanding of the joint management issue in the MRB as long as more recent and better data become available.
Some of the usual caveats apply to our analysis. Water traveling 4, 200 km along the MR takes time, and delays are not captured in our simple framework. Delays and other changes to our model may partly reduce the positive effects of water storage by upstream in the wet season and the benefit of reusing water for hydropower generation in a cascade of dams, as do natural bounds that limit the maximal physically feasible dam capacity. These issues are left for future research. Next, the spatial and temporal scale of our numerical model needs further improvement (e.g., Ringler et al., Reference Ringler, von Braun and Rosegrant2004) and integration of a spatial model of fish migration (e.g., Ziv et al., Reference Ziv, Baran, Nam, Rodríguez-Iturbe and Levin2012). Since the four member countries forming the MRC are lumped together, it would also be preferable to disaggregate these countries in order to further investigate conditions necessary for stability and consensus (as in, e.g., Wu and Whittington, 2005). For that reason, we regard our analysis as the first step in developing models that provide some insights into the joint management opportunities in the MRB.
Supplementary material and methods
The Supplementary material referred to in this paper can be found online at journals.cambridge.org/EDE.