INTRODUCTION
Seed viability is a quality trait that determines the success with which a sown crop will establish a vigorous plant stand (Nonogaki et al. Reference Nonogaki, Bassel and Bewley2010). The use of quality seed for sowing is often considered to be among the first steps in quality approved, certified production systems and chains incorporating standardized and traceable crop management practices. Despite this, farm-saved seed is often used; it is estimated to comprise c. 0·40 of the world's seed industry, with cereal seeds being the most important component (Ceddia & Cerezo Reference Ceddia and Cerezo2008). In general, commercial certified seed is commonly used in regions with technologically sophisticated production systems. Statistics for the use of certified seed are not always available; nevertheless, in Europe the use of certified barley (Hordeum vulgare L.) and wheat (Triticum aestivum L.) seed dominates. For example, Denmark, France and Sweden use 0·85–0·90, 0·50–0·90 and 0·85 certified seed, respectively (E.-A. Loop, personal communication). Countries that do not use high levels of certified seed include Poland (0·10 certified), Lithuania (0·10), Slovakia (0·30) and Finland (0·20–0·30).
Finland has the northernmost European growing conditions; cereal yields are low, due especially to the very short growing season (Peltonen-Sainio et al. Reference Peltonen-Sainio, Jauhiainen and Laurila2009a). This probably discourages farmers from using commercial seed, as farmers consider commercial certified seed to be expensive compared with the benefits they accrue, especially regarding yield increases. The use of seed of uncertain quality, together with reduced use of other inputs (nutrients and pesticides), may contribute to the stagnant or even-declining yield trends for cereals that have occurred over the past 15 years in Finland, despite the consistent genetic improvements for yield potential (Peltonen-Sainio et al. Reference Peltonen-Sainio, Jauhiainen and Laurila2009a). Typical figures for recent use of certified seed for sowing are 0·28–0·35 for spring barley, 0·32–0·34 for spring oat and 0·17–0·24 for wheat (A. Rajala, personal communication). The perception that the cost of purchasing certified seed outweighs the benefits is likely to result from difficulties in recognizing the benefits of high-quality seed in practical farming due to a lack of possibilities for making exact spatiotemporal comparisons, not least because growing conditions vary considerably within Finland (Peltonen-Sainio et al. Reference Peltonen-Sainio, Jauhiainen and Hakala2009b, Reference Peltonen-Sainio, Rajala, Känkänen, Hakala, Sadras and Calderinic). Significant and consistent yield increases (from 200 to 600 kg/ha, corresponding to a yield increase of c. 10%) have been demonstrated recently using high-quality seed v. seed used without any upgrading measures such as disinfection with fungicides or sieving to reject small seeds and thereby select seeds with greater carbohydrate reserves (A. Rajala, personal communication).
In Europe, the problems associated with using non-approved seed for sowing currently seems to be regional, possibly even somewhat marginal, although it represents an important challenge for European agriculture and even more so at the global scale (Ceddia & Cerezo Reference Ceddia and Cerezo2008). The Second World Seed Conference (held 8–10 September, 2009 in Rome, Italy) announced: ‘Agriculture needs to provide sustainable food security and economic development in the context of current and future global challenges and furthermore, highlight the critical role of new plant varieties and high quality seed in providing a dynamic and sustainable agriculture that can meet those challenges. Governments need to develop and maintain an enabling environment to encourage plant breeding and the production and distribution of high quality seed’.
Some signs exist to suggest that there may be an emerging risk associated with the gradual and insidious increase in the use of farm-saved seed throughout Europe. Farmers may attempt to balance income and expenditure by using several generations of farm-saved seed for sowing, especially during periods of low market prices and increased input costs. For example, Denmark, known as a world-leading exporter of grass seed, has higher-quality standards (regarding purity, germination and the absence of other seed species) for certified seed than elsewhere in the EU. However, from 2000 to 2010 the winter wheat area in Denmark increased by some 30% but the use of certified seed fell from 105 000 to 82 000 tonnes, i.e. from 186 to 113 kg/ha. This may be due to reduced seeding rates or to the increased use of farm-saved seed (M. Haastrup, personal communication). The use of certified cereal seed has also declined in Germany, from 0·55 to 0·62 in the early 2000s to c. 0·50 in 2008–10, being even lower for winter wheat (presently <0·45) than average for cereals (E. Kazmann, personal communication).
The present study aimed at characterizing the quality properties of farm-saved seed through a survey in Finland, where the availability of farm-saved seed is abundant. In Finland, farm-saved seed is typically a commercial, named cultivar and farmers pay royalties that are lower compared to those paid for the use of certified seed. The specific aims were to gain a better understanding of: (i) how many generations of farm-saved seed are used by farmers and whether there is any safe threshold for farm-saved seed generations with respect to phenotypic viability degradation and (ii) how variable the seed material is in terms of germination and viability, graded according to seed size, seedling elongation capacity and within-seed-lot variation. Such hidden, non-documented information may provide an exceptional opportunity to gain insight into the risks related to increasingly extensive use of farm-saved seed in Europe, and of its effects on food security.
MATERIALS AND METHODS
Farm-saved seed and quality analyses
Farmers were invited to send farm-saved spring barley (in spring 2008/09, both two- and six-row cultivars) and wheat (in spring 2009) seed that they intended to use in sowing for a viability and quality survey carried out by MTT Agrifood Research Finland. Seed lots received in spring 2008 and 2009 were mainly harvested in 2007 and 2008, respectively. The survey focused on spring barley and wheat because both are primary crops in Finland and it is very common for farm-saved seed to be used. Farmers were contacted by releasing a bulletin through the media. They were instructed to prepare and send a seed sample of c. 100 g for laboratory analyses during January–February, together with background information: name of cultivar and when bought as commercial certified seed (thus indicating how many generations of use as farm-saved seed). Farmers sent 304 farm-saved barley seed samples in 2008, 187 barley samples in 2009 and 166 wheat samples in 2009. They, in turn, received information on the general quality of their seed lot well before sowing in May.
After arrival, each of the seed lots was checked visually, cleaned by hand to remove seeds of other species and weighed. Thereafter, each seed lot sample was sorted using sieves into four size groups; each of them was weighed (g) and proportions by weight of the original sample were determined: >2·8, 2·5–2·8, 2·2–2·5 and ⩽2·2 mm. Then, each seed lot sample was bulked again and a mean single grain weight (mg) was recorded by counting and weighing 5×100 seeds. In general, germination tests were carried out according to the standard germination test instructions of EVIRA (Finnish Food Safety Authority), which follow International Seed Testing Association (ISTA) Seed Testing Rules. Three replicates of 100 seeds were placed between two moistened sheets of blotting paper, which were rolled, put into a plastic bag in which the upper corner was cut to enable gas exchange, and put into cool storage at 10°C for 7 days. Subsequently, they were moved to room temperature (21°C) for 3 days and after a total germination period of 10 days the number of germinated seeds, seeds with abnormal radical and/or coleoptile, seeds destroyed by heavy fungus infection and non-germinated seeds were assessed for each replicate. Non-germinated seeds included some dormant seeds; although by spring the dormancy from the previous autumn's harvest has usually broken down, seeds with very late germination might have been counted as either non-germinated seeds or abnormal seedlings. However, long day seeds, with germination delayed because of intensive growth and development, are not likely to be competitive in plant stands (Peltonen-Sainio et al. Reference Peltonen-Sainio, Rajala, Känkänen, Hakala, Sadras and Calderini2009c). Before characterizing the germination of seeds, each of the opened blotting papers was photographed using a rack to maintain a uniform distance. The length of 20 random coleoptiles was measured on the photographs from seed to leaf tip, if emerged (mm, herein referred to as seedling length), and scaled to be comparable according to a control ruler included in each photograph.
Statistical analyses
All statistical analyses were conducted using SAS software (version 9.1; SAS 2004). Seed samples were sorted with sieves into four size groups: >2·8, 2·5–2·8, 2·2–2·5 and ⩽2·2 mm. Mean size was not straightforward to calculate because upper and lower limits for all groups were not defined precisely. The frequency distribution of four groups led to three known values for the cumulative distribution. The distribution underlying the frequency distribution was assumed to be normal and the mean and standard deviation (s.d.) of the normal distribution were estimated using the following simple linear regression model proposed by Hurme et al. (Reference Hurme, Jauhiainen, Öfvesten and Fischer2009):

where y i is the upper limit of the three groups, x i is the percentile of the standardized normal distribution associated with the y i,  and
 are estimates for the mean and s.d. of the underlying normal distribution and ε i is the residual. The assumption of underlying normal distribution was checked using plots of regression lines together with y i.
Farm-saved seed germination, seedling length and s.d. of 60 seedling lengths (3 replicates×20 coleoptiles) were analysed statistically using analysis of covariance (i.e. model includes both continuous and categorical independent variables). Arcsine transformation was applied to germination data and square-root transformation to s.d.s of seedling lengths. Initial models included the following independent variables: cultivar, region, generation of farm-saved seed, single seed weight, mean seed size and s.d. of seed sizes. Germination was also used as a categorical independent variable (<0·75, 0·75–0·85, 0·85–0·95 and >0·95) in the analysis of two later response variables. Non-significant variables were removed from the model one by one, and the final model included all statistically significant (P<0·05) and not more than a single variable at P<0·10.
Additional analyses were carried out to identify the fungus species infecting seeds and the following species were found for wheat: various Fusarium species (most often Fusarium avenaceum, Fusarium culmorum, Fusarium graminearum, and occasionally Fusarium sporotrichioides, Fusarium poae, Fusarium tricinctum, Fusarium arthrosporioides, Fusarium sambucinum and Fusarium equiseti). For barley: Fusarium species as well as Bipolaris sorokiniana, Pyrenophora teres, Pyrenophora graminea, Alnternaria species, Botrytis cinerea and Penicillium species. It was not, however, possible to include data on even the most frequently found fungus species in the model because accurate identification was not possible for all seed lot samples. A simple linear regression model was used to test association between species and residuals from the analysis of covariance. As fungus species contribution to germination was inconsistent over years and invariably slight, results are not shown.
RESULTS
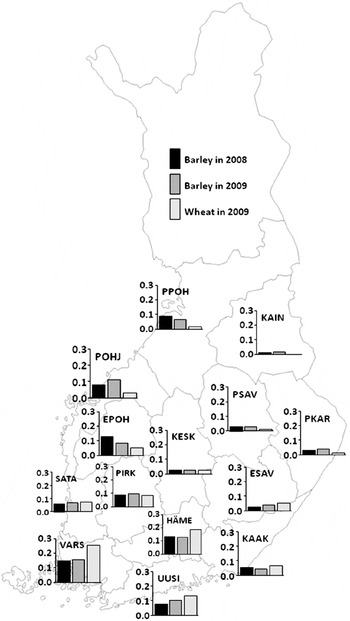
In both years, farmers participated actively and provided farm-saved seed that they intended to use for sowing. In 2008, 304 spring barley samples were analysed and in 2009, 187 barley and 166 spring wheat samples. Samples were received from the main production regions of Finland (Fig. 1) and their geographical distribution was in balance with the importance of the crop and extent of cultivation in the different regions.
Proportion of spring barley and wheat samples from different regions of Finland. In total, 304 farm-saved barley seed samples were analysed in 2008, 187 barley samples in 2009 and 166 wheat samples in 2009. UUS, Uusimaa; HÄME, Häme; VARS, Varsinais-Suomi; SATA, Satakunta; PIRK, Pirkanmaan; KAAK, Kaakkois-Suomi; ESAV, Etelä-Savo; PSAV, Pohjois-Savo; PKAR, Pohjois-Karjala; KESK, Keski-Suomi; EPOH, Etelä-Pohjanmaa; POHJ, Pohjanmaa; PPOH, Pohjois-Pohjanmaa; KAIN, Kainuu.

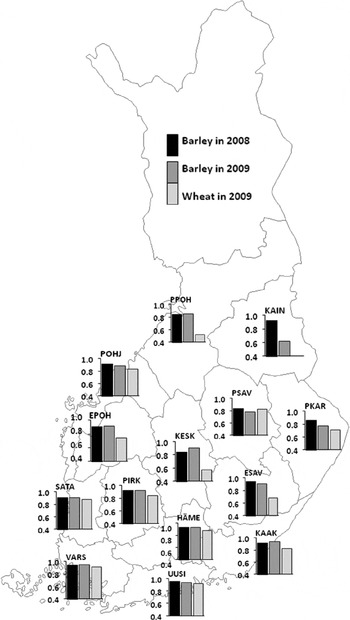
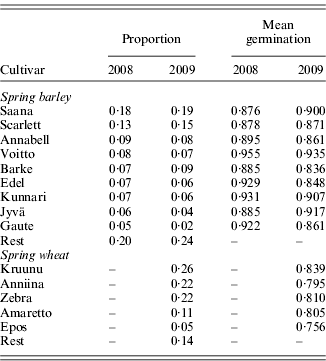
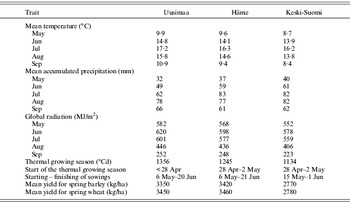
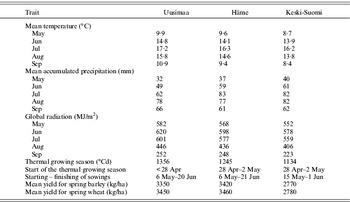
In 2008, samples of farm-saved seed lots consisted of 30 different spring barley cultivars and in 2009, 25 barley and 17 spring wheat cultivars (Table 1). However, 0·50 of barley seed lots were of four cvars, Saana, Scarlett, Annabell and Voitto, and 0·70 of wheat lots of three cvars, Kruunu, Anniina and Zebra. Also, the number of generations that farm-saved seed had been in use ranged considerably: from 1 year up to 15 with a median of 3 or 4 years, depending on crop and study year (Table 2). In spite of the large diversity in number of farm-saved seed generations for barley, it had no effect on germination (P=0·404 in 2008 and P=0·828 in 2009), in contrast there were significant effects of cultivar (P<0·001 in 2008 and P<0·01 in 2009) and region of production (P<0·001 in both years). Barley cvar Voitto had exceptionally high germination, averaging 0·96 in 2008 and 0·94 in 2009. In general, germination for two-row barley cultivars was lower (0·88 in 2008 and 0·84 in 2009) than for six-row cultivars (0·93 and 0·92, respectively). In wheat, region of production effects on germination were significant (P<0·001), while cultivar effects were not (P=0·077). Seed samples of spring wheat from northern regions tended to have lower germination than those from southern regions (Fig. 2). For earlier maturing spring barley, there was no clear regional shift. Typical differences between regions for weather conditions, start of sowings and mean grain yields are shown in Table 3. Additional information about distribution of precipitation within growing season is shown in Peltonen-Sainio et al. (Reference Peltonen-Sainio, Jauhiainen and Hakala2011).
Germination of farm-saved spring barley and wheat seeds in different regions of Finland in 2008 and 2009. Abbreviations for regions are explained in caption of Fig. 1. No wheat seed samples from the KAIN region were received.

Proportion of and germination for the most commonly represented cultivars of spring barley and wheat in a survey of farm-saved seed in 2008 and 2009. ‘Rest’ included 21 spring barley cultivars in 2008 and 16 in 2009, and 11 spring wheat cultivars in 2009, each having <0·05 share

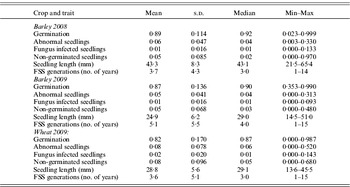
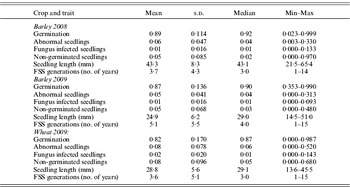
Mean, s.d., median and the range between minimum and maximum seed viability character traits in farm-saved spring barley samples in 2008 and 2009 and wheat samples in 2009. FSS, farm-saved seed
Monthly means for temperature, accumulated precipitation and global radiation during the growing season as well as accumulated degree days and start of thermal growing season for 1971–2000 (Finnish Meteorological Institute) and mean starting and finishing dates for sowings for 1998–2004 and grain yield for 1998–2009 (Tike, Information Centre of the Ministry of Agriculture and Forestry) for barley and wheat in Uusimaa, Häme and Keski-Suomi regions
Germination of farm-saved seed lots
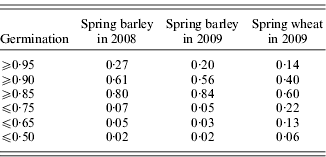
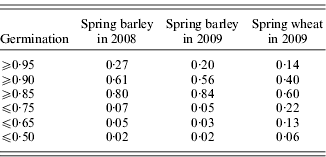
In general, seed lots germinated well (Table 2), with barley germinating better than wheat. Mean germination was 0·89 for barley in 2008, 0·87 for barley in 2009 and 0·82 for spring wheat in 2009. Medians were higher than means, being 0·92, 0·90 and 0·87, respectively. Corresponding mean germination figures for seed lots targeted at certification, and therefore tested by EVIRA, were 0·91 (0·99–0·62, max–min) for barley in 2008, 0·92 (0·99–0·77) for barley in 2009 and 0·87 (0·98–0·60) for wheat in 2009, and the proportions of rejected lots were 0·17, 0·07 and 0·27, respectively (http://www.evira.fi/portal/fi/kasvit/; verified 14 Feb 2011). However, the range of germination rates was very wide: 0–0·99 for farm-saved wheat seed and 0·35–0·99 for farm-saved barley seed intended for sowing in 2009, and from 0·02–1·00 in 2008. In barley, 0·80 (2008) and 0·84 (2009) of farm-saved seed lots had the levels of germination required for certified seed (i.e. 0·85), and had 0·60 of wheat seed lots in 2009 (Table 4). Furthermore, 0·27, 0·20 and 0·14 had germination rates of ⩾0·95, and 0·61, 0·56 and 0·10 had rates of ⩾0·90, respectively. On the other hand, 0·02 of barley lots and 0·06 of wheat lots had germination rates of ⩽0·50. In wheat, 0·20 of seed lots had ⩽0·75 germination. No practically important association was found between germination of the same barley lots from the same farm that were sent for testing in 2008 and again in 2009. The association was statistically significant but weak (Spearman correlation coefficient, r=0·25, P<0·01).
Proportion of farm-saved spring barley and wheat seed samples exhibiting different germination abilities. In Finland, ⩾0·85 germination is required for commercial certified seed
In general, only a small number of abnormally germinated seedlings were recorded; however, the range was considerable, from 0·00 to 0·33 in barley and from 0·00 to 0·52 in wheat (Table 2). The incidence of lethal fungus infection was low, averaging 0·01, but in some cases up to 0·14 of seeds were destroyed by fungus. Seeds showing no signs of germination (considered to be either dead or dormant) averaged 0·05 for barley and 0·08 for wheat, but again seed lots with up to 0·97 of dead/dormant seeds were recorded for barley in 2008, and 0·48 and 0·68 for barley and wheat in 2009, respectively.
Seedling elongation during germination test
Seedling length averaged 43 mm in barley tested in 2008, and 25 and 29 mm for barley and wheat in 2009, respectively (Table 2). Variation between seed lots was extensive, being over three-fold higher in lots with the highest seedling lengths compared with those with the lowest. Also, variation in seedling length within a seed lot ranged widely between lots.
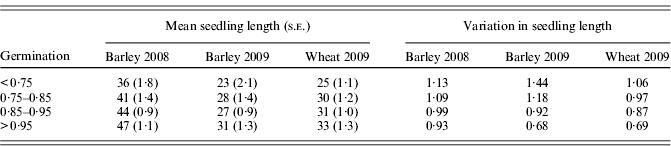
Cultivar effects on mean seedling lengths were significant (P<0·001) in both years for barley and wheat. In barley, there was no significant difference between two-row and six-row barleys in mean seedling length (1·6 mm difference in 2008, P=0·329; and 2·6 mm difference in 2009, P=0·116). Seedling lengths for farm-saved seed lots were not affected by region of seed production, number of generations as farm-saved seed or lot mean for single seed weight. When seed lots were grouped according to germination, it was found that lower germination was associated with reduced seedling length (P<0·001) in both barley and wheat (Table 5).
Effect of germination on mean seedling length (mm; standard error (s.e.)) and within-seed-lot variation for seedling length shown as standard deviation (mm) for spring barley and wheat
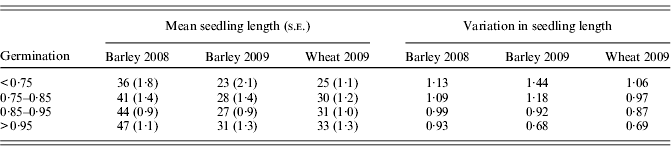
Differences for within-lot variation in barley seedling length were not explained by region of production. There was a trend for later generations of farm-saved seed to be more variable in barley in 2009: the first, second, third or ⩾fourth generation of farm-saved seed had s.d.s for seedling lengths of 0·69, 1·06, 1·15, 1·14 and 1·17 mm, respectively (P=0·071): cultivar effects were recorded for barley (P<0·001 in 2008 and P=0·017 in 2009) and wheat (P<0·001). In general, there was less variation in seedling length for six-row barley compared with two-row barley. Germination explained significant variation in barley seedling length in both years (P<0·001). When germination was lower, s.d.s characterizing within-lot variation in seedling length were higher for all crops and years (Table 5).
Seed size characteristics
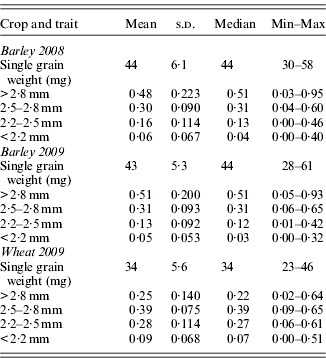
Single grain weight averaged 44·1 and 43·2 mg for barley samples in 2008 and 2009, respectively, and 33·7 mg for wheat in 2009 (Table 6). The range of mean single grain weight from one lot to another was marked; the seed lot with the lowest seed weight weighed only half that of the seed lot with the highest seed weight. In 2008, grain weight was associated with germination (P<0·001) in barley, but the seed weight effects were rather modest. For example, in 2008, in the southern Uusimaa region, an increase in seed weight by 3 mg contributed to germination increase of 0·4%, while in northern Pohjois-Pohjanmaa region such a change in single grain weight was associated with a 1·3% increase in germination. However, in 2009, mean single grain weight of barley seed lots had no effect on germination (P=0·171) or had that of wheat lots (P=0·111).
Mean, s.d., median and the range between minimum and maximum of seed size characterizing traits (single grain weight and proportion of different seed size fractions) for farm-saved spring barley samples in 2008 and 2009 and wheat samples in 2009

When grain size distribution within each farm-saved seed lot was analysed by sieving, the mean share in barley was c. 0·50 for the >2·8 mm seed class and for the 2·5–2·8 mm seed class, c. 0·30 in both years, while seed lots on average had 0·05–0·06 of very small seeds (<2·2 mm). In wheat, the share of the 2·5–2·8 mm seed class was especially high; although in general the distribution of seeds between the three highest seed classes was more even than in barley (Table 6). Also, variation in seed size distribution within a seed lot ranged greatly from one lot to another. In 2008, differences in within seed lot variation were not associated with germination in barley, except in the case of the proportion of extremely small seeds (<2·2 mm). If the fraction of small seeds increased by 10%, germination was reduced by 0·8% in the Uusimaa region and by 2·9% in Pohjois-Pohjanmaa (P=0·050). A higher share of small seeds also tended to increase within seed lot variation in length of seedlings in 2008 (P=0·107). In 2009, increase in seed size distribution within a seed lot was associated with reduced germination (P=0·037).
DISCUSSION
In general, germination of farm-saved barley seed often (0·80 of seed lots in 2008 and 0·84 in 2009) exceeded the official germination requirement set for commercial certified cereal seed. Spring wheat matures later than spring barley and may experience poor weather conditions before harvest. Hence, the viability of farm-saved seed was clearly lower for wheat: only 0·60 of analysed wheat lots exceeded the limit of 0·85 germination (Table 4). Such a difference is typical, according to the annual seed testing results of EVIRA. In spring cereals, depending on seed quality, 0·15–0·30 of germinating seeds typically fail to emerge in field conditions (A. Rajala, personal communication). Hence, risks for poor plant establishment in wheat are especially likely to be high if farm-saved seed that is not properly tested is used for sowing; 0·13 of seed lots had germination ⩽0·65 and 0·06⩽0·50 when tested in ‘ideal’ laboratory conditions. For spring barley, the corresponding figures were only 0·03–0·05 and 0·02. Risks for marked reductions in germination were higher for wheat than for barley, especially when grown in the central and northern regions of Finland (Fig. 2) that are characterized by shorter growing seasons and delayed ripening processes due to the more challenging high precipitation and low temperature.
Risks may often be higher than identified here if abundant and long-lasting rains interrupt and postpone harvesting and thereby result in lodging, pre-harvest sprouting, fungal infection and general quality deterioration (Rajala & Peltonen-Sainio Reference Rajala, Peltonen-Sainio and Basra2000; Peltonen-Sainio et al. Reference Peltonen-Sainio, Rajala, Känkänen, Hakala, Sadras and Calderini2009c). Fungal infection of seeds ranged from 0·00 to 0·14 depending on seed lot (Table 2). In Finland, weather-related seed viability risks, especially those caused by fungus infection in the field, are likely to be partly alleviated by regular drying of harvested grain to 0·10–0·14 moisture content. Sometimes, drying temperatures that are too high may cause loss of viability (Wilson Reference Wilson and Basra1995; Jittanit et al. Reference Jittanit, Srzednicki and Driscoll2010). This is a potential reason for the exceptionally low or zero germination in the present study, as well as for the share of >0·30 and >0·50 abnormal seedlings recorded occasionally for barley (in both years) and wheat, respectively. Abnormal seedlings were not a result of seed disinfection treatments, as only non-treated seed lots were examined.
Germination is the outcome of complex, interacting processes that are not yet thoroughly understood (Nonogaki et al. Reference Nonogaki, Bassel and Bewley2010). Seed lots having similar germination may vary greatly in vigour (Naylor & Gurmu Reference Naylor and Gurmu1990). Germination tested in the laboratory on blotting paper does not, as such, provide a comprehensive understanding on the viability of a seed lot and variability in it. Nevertheless, germination performance in the laboratory corresponded with seedling emergence characteristics in the field (Nagel & Börner Reference Nagel and Börner2010). In the short and intensive growing conditions of northern latitudes, prompt germination, seedling emergence and plant stand establishment favour uniformity in growth and yield formation (Peltonen-Sainio et al. Reference Peltonen-Sainio, Rajala, Känkänen, Hakala, Sadras and Calderini2009c). According to Gan et al. (Reference Gan, Stobbe and Moes1992), such early and uniform seedling emergence resulted in increased wheat yields. Seedling length is a trait characterizing, e.g. combined effects of physiological readiness and promptness of a seed to germinate and availability and sufficiency of carbohydrate reserves. The present study revealed that the range in farm-saved seed lots for seedling length and the within seed lot variation in seedling length were extensive (Table 2), and both were associated with germination (Table 5). For both years and/or crops, the lower the mean germination of a lot, the shorter the seedlings and the higher the variation within a seed lot: seedlings having >0·95 germination were some 30% longer and had 20–50% less within-seed-lot variation in seedling length than those with <0·75 germination. Therefore, contrary to Khah et al. (Reference Khah, Roberts and Ellis1989), adjusting seeding rates according to seed germination, so that recommended rates of establishment are achieved, does not adequately compensate for lower germination, but potentially backfires in terms of lower seedling establishment, more variable onset of seedling growth and yield penalties. Benjamin (Reference Benjamin1990) described comprehensively how variation in seedling emergence rate within a plant population determines growth and development through changes in competition between individuals for growth resources, which leads to the development of dominance hierarchies.
Germination generally declines with age of seed lot, but at a variable rate (Naylor Reference Naylor2003). Typically, the curve for seed longevity is sigmoid and dependent on crop species (Nagel & Börner Reference Nagel and Börner2010). In the worst case, though not necessarily often experienced, sudden and complete loss of viability may occur in a poorly germinating, aged seed lot. This is because a seed lot can experience variable and stressful storage conditions over extended periods (Wilson Reference Wilson and Basra1995; Nagel & Börner Reference Nagel and Börner2010). One Finnish farmer, who regrettably used farm-saved seed from old stores, reported that the use of one seed lot with c. 0·65 germination, according to his self-organized tests carried out 3 months before sowing, nevertheless resulted in no seedlings in the field. When germination was re-tested by the official authority (EVIRA), the complete loss of germination ability in the laboratory was demonstrated. In sorghum, low-vigour seeds showed the greatest decline in performance after ageing (Shephard et al. Reference Shephard, Naylor and Stuchbury1996). Hence, such unpredictable, sudden and irreversible processes of weakening of germination are especially likely in old seed lots (Coolbear Reference Coolbear and Basra1995), as both expression of seed longevity and loss of ability to retain seed viability are the result of complex processes (Niedzielski et al. Reference Niedzielski, Walters, Luczak, Hill, Wheeler and Puchalski2009).
Seedling lengths and their variation within a seed lot were affected by cultivar, but not by region. Interestingly, six-row barley showed less variation in seedling length compared with two-row barley. This suggests that in spite of the potentially higher variability in six-row barley resulting from the ear structure, with large differences in seed size depending on position in the ear (Rajala et al. Reference Rajala, Hakala, Mäkelä and Peltonen-Sainio2011), the contribution of germination per se to mean seedling length and seedling length variability was greater than that of seed size. Despite the large differences among seed lots in mean seed weights, which were comparable to those of long-term experiments (Peltonen-Sainio et al. Reference Peltonen-Sainio, Kangas, Salo and Jauhiainen2007), seed weight effects on germination tested in blotting paper were modest or non-significant. Shephard et al. (Reference Shephard, Naylor and Stuchbury1996), however, found that small seeds had the lowest viability and vigour in sorghum (Sorghum bicolour (L.) Moench). Furthermore, Naylor (Reference Naylor1993) showed that germination of wheat and triticale (X Triticosecale Wittmack) increased with seed size in laboratory test, and Chastain et al. (Reference Chastain, Ward and Wysocki1995) found that in the field, where conditions challenge germination capacity more than in laboratory tests, sowing with larger wheat seeds resulted in seedlings emerging more rapidly and producing taller and heavier plants with more tillers.
Seed size distribution is, however, a more informative seed quality characteristic than mean seed weight, especially as large within-lot variation in seed size was demonstrated (Table 6). In 2009, increase in seed size distribution within a barley seed lot was associated with reduced germination. Even though this was found not to be the case in 2008, it was shown that the higher the proportion of very small seeds (<2·2 mm) in a lot, the lower the germination. Such a response was significantly higher for barley grown in more northern conditions when compared with grain produced in the southern regions. A high proportion of small seeds in a lot also contributed to higher within-seed-lot variation in seedling length, but again only in 2008. In the light of these findings, upgrading of farm-saved seed quality (e.g. through sieving) is likely to be beneficial, especially in respect of improving germination and seedling growth and uniformity. This is in agreement with the results from field experiments carried out in the northernmost European growing conditions in Finland with seed lots upgraded to have higher seed weights and carbohydrate reserves (A. Rajala, personal communication).
Seed age and seed lot age (i.e. how long after purchase the commercial seed has served as the origin for farm-saved seed generations) may contribute to seed viability and the capacity to maintain germination ability (Grilli et al. Reference Grilli, Bacci, Lombardi, Spano and Floris1995; Ruiz et al. Reference Ruiz, Martin and De La Cuadra1999; Rajjou & Debeaujon Reference Rajjou and Debeaujon2008). This is critical and topical also for preservation of germplasm collections in genebanks and avoidance of their genetic erosion (Ruiz et al. Reference Ruiz, Martin and De La Cuadra1999; Nagel & Börner Reference Nagel and Börner2010). Long periods of using farm-saved seed may promote genotypic degradation in self-pollinating crops due to recurrent risks of mixing with other cultivars and species during on-farm yield handling processes (harvest, drying and storing). Contrary to this, phenotypic degradation does not necessarily accumulate through generations, as years with poor conditions may fluctuate with those favouring seed filling and viability. This is probably why the present study found that neither poor nor high seed viability in 2008 was associated with similar characterization of seed viability in the following year (2009) when barley seed lots of the same origin were compared.
A wide range of farm-saved seed generations was represented in the present study: 1–15 years with a median of 3–4 years. However, there was no contribution of seed lot age to germination, mean seedling length, mean seed weight or variability in seed weight. However, in 2009, variability in seedling length gradually increased (by up to 10%) when barley seed lot age increased from the first farm-saved seed generation to the ⩾fourth generation. Therefore, it is concluded that number of farm-saved seed generations per se cannot be considered a reliable indicator of phenotypic degradation and hence, an upper safe threshold for this variable cannot be suggested. Lack of identification of an exact threshold may result from large variation among farms in storage conditions, but also because seed lots with a history of a high number of generations were rather scarce and therefore, comparisons with them could not be carried out reliably and comprehensively. Genotypic degradation is an evident risk that was not studied here, but requires careful consideration by farmers.
Keeping farm-saved seed for many generations also means that the recent genetic improvements in yield potential, averaging 28 kg/ha/year for barley and 36 kg/ha/year for wheat that have been registered for the latest cultivars, remain beyond reach (Peltonen-Sainio et al. Reference Peltonen-Sainio, Jauhiainen and Laurila2009a). Common use of farm-saved seed, in the light of recent studies showing yield penalties averaging 200–600 kg/ha to result from the use of non-upgraded seed (A. Rajala, personal communication), may contribute, though only partly, to the decline or stagnation in yield trends together with other inputs that are used more sparingly since Finland's EU membership in 1995 (Peltonen-Sainio et al. Reference Peltonen-Sainio, Jauhiainen and Laurila2009a). Nevertheless, farm-saved seed very probably contributes to the recorded gap between regionally achievable, genetic yield potential and actual yields.
Thirty spring barley cultivars and 17 spring wheat cultivars were represented in the present survey. Interestingly, some cultivar differences exist: for example, the barley cvar Voitto, the fourth most common cultivar in the survey, had a mean germination of 0·94–0·96 and the three most common cultivars >0·85 and ⩽0·90 (Table 1). Stastny & Pazderu (Reference Stastny and Pazderu2008) also found differences in the stability of viability in winter wheat cultivars. However, none of the spring wheat cultivars that were adequately represented in this survey reached a germination average ⩾0·85. Even though only about one-third of the tested cultivars were common enough to allow comparison, the present study indicated that cultivar differences existed and some cultivars may be less risky for farm-saved seed use than the others. In general, farm-saved wheat seed was lower in quality than farm-saved barley seed and therefore, especially in the northern cereal producing regions of Finland, uncertainties can be reduced by using commercial wheat seed at higher frequencies than are used today.
The results of the present survey, in which 657 farm-saved seed samples were analysed, showed high germination ability was achieved in many seed lots despite the late summer to early autumn temperature and precipitation conditions typical for these northern regions, which often hamper and even postpone harvesting, and cause lodging, pre-harvest sprouting and generally reduce grain quality. Despite the generally high germination ability of seed lots, risks for total crop failures exist if the material is not properly tested prior to sowing: seed lots that were unable to produce any seedlings (i.e. which were dead or dormant) or almost no normal seedlings were recorded and even >0·30 abnormal seedlings were recorded for barley and >0·50 in wheat. Furthermore, significant within-seed-lot variation in seed size and seedling length was found, which suggests high risks for uneven seedling emergence and non-uniform plant stand establishment and growth. Together with the fact that up to 0·14 of fungus infected seeds were recorded, this suggests the need for seed lot upgrading measures prior to using farm-saved seed. In general, the case from northern European conditions, where the use of farm-saved seed is currently high, underlines the potential risks for yield production per se and the hidden threats to yield variability and food security associated with increased use of farm-saved seed in the future due to imbalances between farmers’ income and expenditure. In Finland, as in many of the most recent EU member states, the long-term strategy has been and will continue to be to decrease the use of farm-saved cereal seed. To date, this has not met with success. However, the dependence on cereal prices has been experienced only recently (marketing year 2007/08), when high prices immediately encouraged farmers to invest in approved quality seed for sowing in spring 2008. This suggests that agricultural policy, which has according to recent investigations played an important role in the stagnation and even decline in yield trends in Europe (Peltonen-Sainio et al. Reference Peltonen-Sainio, Kangas, Salo and Jauhiainen2007; Brisson et al. Reference Brisson, Gate, Gouache, Charmet, Oury and Huard2010; Finger Reference Finger2010), is the key driver affecting the future use of approved, quality seed.
The authors are grateful to Kylvösiemensäätiö (foundation) for financing the survey. Mrs Jaana Nissi is thanked for her technical assistance in handling and analysing the farm-saved seed samples and Marjo Serenius and Päivi Parikka for analysing pathogens in the seed lots. All participating farmers that supplied farm-saved seed samples are cordially acknowledged for their irreplaceable contribution.