


1. INTRODUCTION
A single receiver can track multi-constellation Global Navigation Satellite Systems (GNSS), however, the data from these systems should be validated before being used for positioning and navigation. Several methods have been presented in the literature for data validation including detection of code and phase observation outliers and cycle slips of phase data. For instance, some Receiver Autonomous Integrity Monitoring (RAIM) algorithms check consistency of solutions from different subsets of satellites (Farrell and Van Graas, Reference Farrell and Van Graas1992; Hwang and Brown, Reference Hwang and Brown2008; GEAS 2010). Other methods estimate cycle slips as additional unknowns in a least-squares or Kalman filtering processing (Banville and Langley, Reference Banville and Langley2010). Some methods used linear combinations of the observations or their time-difference to estimate cycle slips (Blewitt, Reference Blewitt1990; Kim and Langley, Reference Kim and Langley2002). Gui et al. (Reference Gui, Li, Gong, Li and Li2011) suggested a Bayesian approach for the detection of multiple gross errors. Detection-Identification-Adaptation (DIA) is another method for quality control of single-baseline GNSS models (Teunissen, Reference Teunissen1990). De Bakker et al. (Reference De Bakker, Van der Marel and Teunissen2009) used the DIA method to investigate quality control of single-receiver single-satellite with a focus on the analysis of the Minimal Detectable Bias (MDB), which is a measure of the size of the errors that can be detected with a certain power and probability of false alarm. Yang et al. (Reference Yang, Wang, Knight and Shen2013a; Reference Yang, Knight, Li and Rizos2013b) review the fault detection and exclusion approach and discuss probabilities of different types of errors.
In addition to quality control of Global Positioning System (GPS) observations, validation of data from other GNSS constellations was investigated in De Jong et al. (Reference De Jong, Van der Marel and Jonkman2001) for GPS with GLONASS data, and in Ene et al. (Reference Ene, Blanch and Powell2007) and Neri et al. (Reference Neri, Azoulai and Macabiau2011) for GPS with Galileo observations. El-Mowafy (Reference El-Mowafy2013) investigated validation of BeiDou observations in a standalone mode. A single-receiver single-satellite quality control approach, which is applicable to any GNSS with any arbitrary number of frequencies is discussed in Teunissen and De Bakker (Reference Teunissen and De Bakker2012a) and El-Mowafy (Reference El-Mowafy2014a).
This paper is a continuation of the work presented by the author (El-Mowafy, Reference El-Mowafy2014a) using the single-receiver single-satellite approach for validation of GNSS data. In this contribution, the use of the method validation parameters to provide diagnostics of individual satellite observations and the used model is demonstrated, which is a required task for several applications such as generation of Network Real-Time Kinematic (NRTK) corrections and computation of precise orbits and clock corrections. The diagnostics are based on checking agreement of characteristics of the validation statistics with theory. Such agreement will take place when data are modelled correctly and they do not have severe irregularities. The diagnostics of signal irregularities in data sets from three GNSS constellations (GPS, GLONASS and Galileo) is discussed. The data include observations collected over three consecutive days in a static mode at a continuously operating reference station, and nine hours of observations in a kinematic ship-borne mode.
2. SINGLE-RECEIVER SINGLE-SATELLITE GEOMETRY-FREE MODELLING
In this section the single-receiver single-satellite method is reviewed to make this paper self-contained and to provide the necessary details of the validation parameters, based on which the diagnostics parameters are derived. In this method, undifferenced code and phase observations of each satellite from a single receiver are screened satellite by satellite, independently at each epoch, and in a sequential manner. The method is applicable for real-time or post-mission processing, in static or kinematic modes.
The carrier phase and pseudorange observation equations of a single satellite tracked by a single receiver on frequency f j (for j=1 to n) at time instant t can be formulated as follows:
 $$\eqalign{\phi _j (t) = & \rho (t) + c(\delta t_r (t) - \delta t^s (t)) + T(t) - \mu _j I(t) + b_{\phi _j} (t) + \tilde b_{\phi _j} (t) + \varepsilon _{\phi _j} (t) \cr p_j (t) = & \rho (t) + c(\delta t_r (t) - \delta t^s (t)) + T(t) + \mu _j I(t) + b_{\,p_j} (t) + \tilde b_{\,p_j} (t) + \varepsilon _{\,p_j} (t)} $$
where ϕ j(t) and p j(t) denote the observed carrier phase and pseudo ranges in distance units (m) respectively, with corresponding zero-mean noise terms  $\varepsilon _{\phi _j} (t)$ and
 $\varepsilon _{\,p_j} (t)$. ρ(t) denotes the receiver-to-satellite range, c is the speed of light, δt r(t) and δts(t) are the receiver and satellite clock errors, and T(t) is the tropospheric delay. The parameter I(t) denotes the ionospheric delay for code observations and advance for phase observations expressed in units of distance with respect to the first frequency. For frequency f j the ionospheric coefficient μ j = f 12/f j2 is used to express its ionosphere error in terms of I(t). The parameters
 $b_{\phi _j} (t)$ and
 $b_{\,p_j} (t)$ are the phase and code biases, which are considered constant over a short period of time (Teunissen and De Bakker, Reference Teunissen and De Bakker2012b; El-Mowafy et al., Reference El-Mowafy, Teunissen and Odijk2010), e.g. an hour, and therefore will be denoted thereafter as
 $b_{\phi _j} (t_o )$ and
 $b_{\,p_j} (t_o )$. For phase measurements, this bias comprises the sum of the initial phase bias, the phase ambiguity and the instrumental phase delay, and for code measurements it comprises the instrumental code delay.
 $\tilde b_{\phi _j} (t)$ and
 $\tilde b_{\,p_j} (t)$ denote the unmodelled systematic errors that are not constant in nature or quasi-random, such as multipath. A geometry-free processing is applied where positioning is of no interest at this stage; thus the satellite orbital error is ignored.
The ionosphere delay I(t) can be decomposed into two components; its initial value I(t o) at the initial epoch t o, and the difference from this value, which is denoted as (δI), such that:
 $$I(t) = I(t_o ) + \delta I(t)$$
Similarly, the bias parameters  $\tilde b_{\phi _j} (t)$ and
 $\tilde b_{\,p_j} (t)$ at time t can be split into two components, the initial values, which are denoted as
 $\tilde b_{\phi _j} (t_o )$ and
 $\tilde b_{\,p_j} (t_o )$ and the components that will change with time, which are symbolised as δb ϕ and δb p for phase and code measurements, such that:
 $$\tilde b_{\phi _j} (t) = \tilde b_{\phi _j} (t_o ) + \delta b_{\phi _j} (t)$$
 $$\tilde b_{p_j} (t) = \tilde b_{p_j} (t_o ) + \delta b_{p_j} (t)$$
The rank deficiency of the model in Equation (1) can be reduced by re-parameterisation of the unknowns as follows:
 $$\rho ^{\rm *} (t) = \rho (t) + c(\delta t_r (t) - \delta t^s (t)) + T(t)$$
 $$\rho ^{{\rm **}} (t) = \rho ^{\rm *} (t) - \rho ^{\rm *} (t_o )$$
 $$b_{\phi _j} ^{\rm *} (t_o ) = b_{\phi _j} (t_o ) + \tilde b_{\phi _j} (t_o ) + [\rho ^{\rm *} (t_o ) - \mu _j I(t_o )]$$
 $$b_{p_j} ^{\rm *} (t_o ) = b_{p_j} (t_o ) + \tilde b_{p_j} (t_o ) + [\rho ^{\rm *} (t_o ) + \mu _j I(t_o )]$$
The observation equations in terms of the re-parameterised vector of unknowns [ρ * * (t), δI(t),  $b_{\phi _j} ^{\rm *} (t_o )$,
 $b_{\,p_j} ^{\rm *} (t_o )$,
 $\delta b_{\phi _j} (t)$,
 $\delta b_{\,p_j} (t)]^T $ then read:
 $$\matrix{ {\phi _j (t)} & = & {\rho ^{{\rm **}} (t) - \mu _j \delta I(t) + b_{\phi _j} ^{\rm *} (t_o ) + \delta b_{\phi _j} (t) + \varepsilon _{\phi _j} (t)} \cr {\,p_j (t)} & = & {\rho ^{{\rm **}} (t) + \mu _j \delta I(t) + b_{\,p_j} ^{\rm *} (t_o ) + \delta b_{\,p_j} (t) + \varepsilon _{\,p_j} (t)} \cr {} & {} & {} \cr} $$
 $b_{\phi _j} ^{\rm *} (t_o )$ and
 $b_{\,p_j} ^{\rm *} (t_o )$ are constants and can be estimated during initialisation at time t o such that for all available phase and codes observations at frequency j (1⩽j⩽n) we have:
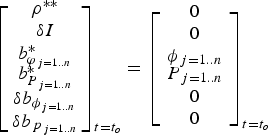 $$\left[ {\matrix{ {\matrix{ {\rho ^{**}} \cr {\delta I} \cr {b_{\varphi _{\,j = 1..n}} ^*} \cr}} \cr {b_{P_{\,j = 1..n}} ^*} \cr {\delta b_{\phi _{\,j = 1..n}}} \cr {\delta b_{\,p_{\,j = 1..n}}} \cr}} \right]_{t = t_o} = \left[ {\matrix{ {\matrix{ 0 \cr 0 \cr {\phi _{\,j = 1..n}} \cr}} \cr {P_{\,j = 1..n}} \cr 0 \cr 0 \cr}} \right]_{t = t_o} $$
and the corresponding initial covariance matrix reads:
 $$P_{x_{o/o}} = {\rm \;} diag[0,\; 0,\; \sigma _{\varphi _{i = 1..n}} ^2, \; \sigma _{P_{i = 1..n}} ^2, \; 0,\; 0]$$
where  $\sigma _{\varphi _{i = 1..n}} ^2 $ and
 $\sigma _{P_{i = 1..n}} ^2 $ denote the phase and code variances, respectively.
The remaining unknowns in Equation (9) can be predicted using dynamic modelling in a Kalman filtering processing, where the predicted unknowns are treated as pseudo-observations; thus when updated by the code and phase observations, rank deficiency is removed (similar to sequential least squares). The reparametrised unknown range (ρ * *) can be considered unlinked in time and thus is not considered in the prediction process. The ionospheric delay δI and the bias components  $\delta b_{\phi _j} $ and
 $\delta b_{\,p_j} $ are considered changing relatively smoothly with time for a short period (El-Mowafy, Reference El-Mowafy2009). This period can be taken between 15 and 30 minutes, as our tests show, depending on ionospheric activity, time of day and year, location (latitude), and observing conditions. The temporal correlations of δI is taken exponentially decaying with time by using a first-order autoregressive stochastic process (Teunissen and De Bakker, Reference Teunissen and De Bakker2012b). Similarly, the temporal correlations of
 $\delta b_{\phi _j} $ and
 $\delta b_{\,p_j} $ are expressed using a first-order autoregressive stochastic process as they do not change much with time. Thus, the transition matrix reads:
 $$\Phi _{t/t - 1} = diag\left[ {\beta _{\delta I}, \; \beta _{\delta b_{\phi _{\,j = 1..n}}}, \; \; \beta _{\delta b_{\,p_{\,j = 1..n} \;}}} \right]$$
where β δ I,  $\beta _{\delta b_{\phi _j}} $ and
 $\beta _{\delta b_{\,p_j}} $ are the temporal correlations for δI(t),
 $\delta b_{\phi _j} (t)$ and
 $\delta b_{\,p_j} (t)$ for a frequency j, where β=e−| Δ t|/τ. Δ t is the time interval between the epochs t−1 and t, and τ denotes the correlation time length. The variance of each process noise is computed as
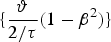 $\lcub {{\vartheta \over 2/\tau}} (1 - \beta ^2 ) \rcub$ (Gelb, Reference Gelb1974), where ϑ denotes its spectral density.
The next section describes a basic validation process using this method; from its parameters the proposed diagnostics tools, which are the focus of this paper, can be extracted.
3. LOCAL VALIDATION OF THE OBSERVATIONS USING THE SINGLE-RECEIVER SINGLE-SATELLITE MODEL
The observation equation in Kalman filtering at time t in a linearised Gauss–Markov model is given by:
 $$y_t = A_t \hat x_{t/t - 1} + v_t $$
where y t is the vector of phase and code observations,  $\hat x_t $ is the estimated vector of unknowns [ρ * * (t), δI(t),
 $b_{\phi _j} ^{\rm *} (t_o )$,
 $b_{\,p_j} ^{\rm *} (t_o )$,
 $\delta b_{\phi _j} (t)$,
 $\delta b_{\,p_j} (t)]^T $. A t is the design matrix, which reads:
 $$A_t = \left[ {\matrix{ {\matrix{ u & { - \mu _j} \cr u & { + \mu _j} \cr}} & {\matrix{ {\rm I} & 0 \cr 0 & {\rm I} \cr}} \cr} \; \; \; \matrix{ {\rm I} & 0 \cr 0 & {\rm I} \cr}} \right]$$
where j=1 to n frequencies, u is a column vector of ones with a size n, I is the identity matrix of size n. v t is the predicted observation residuals with a covariance matrix ${\rm \;} Q_{v_t} $.
For detection of errors, local and global testing can be applied, where for local testing one examines the observations at the present epoch and in global testing observations from more than one epoch are considered (Teunissen and Kleusberg, Reference Teunissen and Kleusberg1998; Knight et al., Reference Knight, Wang and Rizos2010). In general, the local test can be performed for detection of outliers and the global test is needed for detection of cycle slips. In this paper, we will restrict attention to local testing for demonstration of the diagnostics of measurement and model errors, noting that the same diagnostic approach is applicable for the global test mode.
Testing can be performed for q number of possible errors (or outliers) in the observations, where q<df, and df is the degrees of freedom for m observations. If errors are present in the observations, the best estimator of the error vector ( $\hat \nabla _t $) can be determined from (Teunissen and Kleusberg, Reference Teunissen and Kleusberg1998):
 $$\hat \nabla _t = (C_{v_t} ^T Q_{v_t} ^{ - 1} C_{v_t} )^{ - 1} C_{v_t} ^T Q_{v_t} ^{ - 1} v_t $$
 $$Q_{\hat \nabla _t} = (C_{v_t} ^T Q_{v_t} ^{ - 1} C_{v_t} )^{ - 1} $$
Where  $C_{v_t} $ in local testing is m×q matrix that describes which observations are examined, such that each column of
 $C_{v_t} $ is a unit zero vector except the element corresponding to the examined observation, which equals one. Possible detection of the presence of model errors can be performed by examining the local over-all model test statistic T LOM, which can be formulated as:
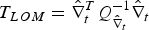 $$T_{LOM} = \hat \nabla _t^T Q_{\hat \nabla _t} ^{ - 1} \hat \nabla _t $$
and measurement or model errors are suspected when:
 $$T_{LOM} \ges \chi _\alpha ^2 (df,0)$$
where χ α2 is the chi-squared value for a significance level α. Lehmann (Reference Lehmann2012) investigated improving the test threshold by considering the dependencies between the residuals.
Once the presence of model errors is detected, one needs to identify the erroneous measurement(s) that cause such model errors. For the case of a single outlier in one code or phase observation, i.e. q=1, the  $C_{v_t} $ matrix reduces to a column vector, and
 $\hat \nabla _t $ becomes a scalar. The test statistic can be computed for observation i as follows (Baarda, Reference Baarda1968):
 $$w_i = \displaystyle{{\hat \nabla _i} \over {\sigma _{\hat \nabla _i}}} $$
where  $\sigma _{\hat \nabla _i} $ is the standard deviation of
 $\hat \nabla _i $, and an outlier is considered present in the data when:
 $$\vert w_i \vert \ges N_{\displaystyle{\alpha \over 2}} (0,{\rm \;} 1),\quad \vert w_i \vert \ges \vert w_k \vert \quad {\rm for}\;k = 1\;{\rm to}\;m$$
The error vector (∇ x) in the dynamic model of the unknowns (states) can be expressed as:
 $$\hat x_t = \; \Phi _{t/t - 1} \hat x_{t - 1} + \; C_{x\;} \nabla _x + d_t $$
where d t represents the process noise and the matrix C x maps the state model error of dimensions, i.e. the number of predicted states × the number of model errors under consideration (e.g. Hewitson and Wang, Reference Hewitson and Wang2007). The matrix  $C_{v_t} $ used in Equations (15) and (16) then reads:
 $$C_{v_t} = \; - \; A_{t\; \;} \psi _t $$
where ψ t describes the response of a model error on the predicted state vector, which in the case of a jump in the state vector reads (Teunissen, Reference Teunissen1990):
 $$\psi _t = \Phi _{t,\; t - 1} \left[ {I - \; K_t \; A_t} \right]\psi _{t - 1} $$
initialising with ψ start epoch=C x, where K t denote the Kalman gain matrix. For the case of a permanent slip in the state vector, the error manifests itself as a systematic disturbance, and ψ t becomes:
 $$\psi _t = C_x + \; \Phi _{t,\; t - 1} [I - \; K_t \; A_t ]\psi _{t - 1} $$
Effectiveness of the single-receiver single-satellite validation method in detection and identification of outliers in the observations was demonstrated in El-Mowafy (Reference El-Mowafy2014a), in which the ability of the algorithm to detect more than 6000 artificial errors in data sets that span several days in March 2012 (a period of medium-to-high ionosphere activity) was examined at a reference station CUT0 at Curtin University, Australia. The range of inserted errors was selected such that the minimum errors tested were at the level of the so-called Minimum Detectable Biases (MDBs). MDB is the error that can be detected with the chosen probabilities of false alarm and misdetection (Teunissen and Kleusberg, Reference Teunissen and Kleusberg1998). The MDBs are computed from the covariance matrix of the observations and according to the observation model. For our model, the MDBs were 0·6 m for code observations and less than one cycle for phase data for the three constellations GPS, GLONAS and Galileo. The average rates of successful detection of artificial errors (from 0·6 m to 5 m) inserted in the code data were between 94·3% and 99·63%, which varied according to signal quality and number of observations. The method success rate in detetion of cycle slips between one cycle and six cycles inserted in the data was 94·4%−100%. Evaluation of the method's performance in correct identification of code outliers showed that the method was successful in identifying 90% to 99% of its outliers. For more details, interested readers may refer to El-Mowafy (Reference El-Mowafy2014a).
The ionosphere level can affect performance of error detection. In addition to the test results discussed above, which were achieved during a medium-to-high ionosphere activity period at a mid-latitude point, two tests were carried out using two-day data sets collected in July 2013 (high ionosphere activity) at the Intenational GNSS Service (IGS) stations NKLG (Gabon-Africa) and SIN1 (Singapore-Asia). The data were obtained online from the Multi-GNSS (MGEX) web portal. Both stations are close to the Equator. Since the change in the ionosphere (δI) is estimated at each epoch as one of the unknowns, its stochastic parameters were modified to account for possible expected changes in ionosphere activity. A method for estimation of the stochastic parameters of the presented method using the single-receiver single-satellite approach is given in El-Mowafy (Reference El-Mowafy2014b). Similar to the above test, the performance of detection of code outliers and phase cycle slips was evaluated by examining the ability of the method to detect artificially inserted errors in the data (356 code outliers ranging from 0·6 m to 5 m and 220 cycle slips ranging between one cycle and five cycles). The performance of the method in this test was consistent as testing results were almost at the same level experienced at the mid-latitude station CUT0 with a success rate above 90%.
The single-receiver single-satellite method for validation of GNSS data has the advantage that since a geometry-free model is used, no satellite need be known beforehand, thus no complete navigation messages need to be read and used. In this case, observation weighting can be performed using, for instance, the signal-to-noise ratio. In addition, detection can be performed for single or multi-frequency observations, unlike most existing outlier and cycle slip detection methods, which require the use of dual-frequency data. Furthermore, the approach is able to detect faulty measurements for systems with a limited number of satellites, such as Galileo and the Quasi-Zenith Satellite System (QZSS), without the need for a complete solution. When using data from different constellations there is no need for the determination of inter-system biases. Finally, the method allows one to present numerical and graphical statistical diagnostics as will be discussed in the next sections. In principle, the method is generic, and thus it is applicable in post-mission and real-time to single-fequency or multi-frequency applications, such as single point positioning (SPP), precise point positioning (PPP), differential positioning (for each receiver separately), Real-time Kinematic (RTK), Network RTK and PPP-RTK.
4. DIAGNOSTICS TOOLS
The characteristics of the validation parameters of the single-receiver single-satellite method provide numeric and graphical diagnostics for the signals and the correctness of the model. One diagnostic tool is checking that the estimated w-test statistic of the observed signals has a standard normal distribution, N(0, 1). Such a condition would not occur if modelling or observation weighting are incorrectly applied, or in the presence of a series of large outliers or cycle slips in the tested data. Another diagnostic tool is to check the distribution of the over-all model test statistic T LOM. This statistic, when divided by the degrees of freedom df, should follow a Fisher distribution if the model is set correctly and the stochastic assumptions are valid. In this section, the diagnostic analysis and results for the two types of diagnostics will be performed for static and kinematic test data.
4.1 Description of the data used
The use of the proposed approach for diagnostics of the multi-frequency multi-constellation GNSS observations and the used model is given through practical experiments in static and kinematic modes. In the static test, the data used were collected at a continuously operating reference station at Curtin University, Australia. The data span three days, 15 to 17 March 2012, with 30 seconds sampling interval. Observations from GPS, GLONASS and Galileo were collected using a geodetic-grade multi-frequency multi-GNSS antenna (TRM59800.00) and receiver (Septentrio POLARX4). Tracked signals in the test included L1, L2 and L5 code and phase observations for GPS, L1 and L2 for GLONASS, and E1, E5a and E5b for Galileo. The kinematic test was carried out on 26 April 2012, where a similar multi-constellation antenna was mounted on a boat, starting its course from Fremantle harbour in Perth, Western Australia and reaching a point located almost six kilometres offshore. GPS and GLONASS data that span almost 9.3 hours with a sampling interval of one second were collected using a Sokkia GSR2700ISX receiver.
4.2 Examples of w-test statistic results
Figures 1 to 4 show three examples of processing data from the three GNSS constellations under consideration in the static test. The figures depict the time-series and histograms of w-test statistic values on 15 March 2012 for GPS satellite PRN 13 (Block IIR satellite with Rubidium clock), GLONASS satellite PRN 18, and the Galileo satellite GIOVE A (considered in this context with PRN 51), using the letter identifiers G, R and E for the three systems respectively. The shown w-test statistic values are computed by weighting the observations using an elevation-angle dependent model in the form [1+a 0×exp(−Eo/E oo)] (Euler and Goad Reference Euler and Goad1991), where a 0 is a weighting coefficient that is dependent on the type and frequency of the observation, receiver and method used for the observation tracking (e.g. Z-tracking, codeless, semi-codeless, etc.). Eo and E oo are the observed elevation angle and a selected base value for the elevation angle in degrees. In this study, the weight model is selected as  $(1 + 10 \times {\bi e}^{( - {\bi E}^{\bi o} /10^{\bi o} )} )$ with an average value of a 0=10 (Teunissen and De Bakker, Reference Teunissen and De Bakker2012b). The standard deviations along the zenith used for the undifferenced observations were taken from the literature. The elevation angles were obtained from satellite almanacs and approximate test point position determined using single point positioning of available GPS satellites performed in a prior step to the data screening process using the single-receiver single-satellite method.
The left side of Figures 1 and 2 show time-series of the computed w-test statistic values for ϕ 1, ϕ 2, p 1, and p 2, which refer to the phase and code measurements for the frequencies L1 and L2 for GPS and GLONASS satellites. The change of the signal-to-noise ratio (SNR) values in dB-Hz for L1 with respect to the observed satellite elevation angles are illustrated in the bottom of the left side of the Figures 1 to 4, where the SNR is displayed in dark dots and the elevation angles are illustrated as solid lines. The right sides of the Figures show the histograms and the probability density function (pdf) of the corresponding w-test statistic values, where the computed standard deviation (σ w) and the mean (μ w) of the w-test statistic are given on top of each figure.
Time-series of w-test statistic for GPS phase and code measurements on frequencies L1 and L2, satellite elevation angles and SNR on L1 (left side); histograms of w-test statistic (right side).

Time-series and histograms of w-test statistic for GLONASS phase and code measurements on frequencies L1 and L2 .
For GPS and GLONASS, the similarities shown in Figures 1 and 2 between w-test values for ϕ 1 and ϕ 2 can be explained by their correlations, which results in an outlier in one measurement influencing other measurements (Hekimoglu and Berber, Reference Hekimoglu and Berber2003). For observations i and j, and ignoring the time index, the correlation coefficient between their corresponding outliers denoted as  $\xi _{\hat \nabla _i, \hat \nabla _j} $ reads:
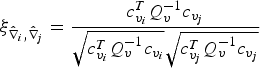 $$\xi _{\hat \nabla _i, \hat \nabla _j} = \displaystyle{{c_{v_i} ^T Q_v^{ - 1} c_{v_j}} \over {\sqrt {c_{v_i} ^T Q_v^{ - 1} c_{v_i}} \sqrt {c_{v_j} ^T Q_v^{ - 1} c_{v_j}}}} $$
where  $c_{v_i} $ and
 $c_{v_j} $ are zero column vectors except for the elements corresponding to the observations i and j which equal to 1. From Equation (25), the correlation between errors is dependent on two factors; the functional relationship of the observations with the unknowns (design matrix), and the precision of the observations (Q y). From the anlysis of our model, the correlation between phase observation errors is almost -1 whereas the correlation between code observation errors is almost zero as shown in Table 1. The table gives the average values of the correlations over the test period for various types of observation errors for GPS satellite PRN 18, taken as an example, where similar values are obtained for other satellites. The high correlation between observations will result in Type III (Hawkins, Reference Hawkins1980) error, where the null hypothesis (assuming no outliers in the data) is correctly rejected but the wrong observation is identified as being faulty. This means that specific phase observations that have outliers will be hard to identify whereas identification of outliers is possible for code observations.
Correlation between various types of observation errors

Similarly, w-test statistic values for Galileo phase measurements ϕ 1, ϕ 5 and ϕ 7 are shown from top to bottom in Figure 3, which are symbolised following the Receiver-Independent-Exchange format (RINEX) version 3 convention, corresponding to the frequencies E1, E5a and E5b, respectively. Again, the similarities shown in the figure among w-test statistics for Galileo phase observations can be explained by their correlations. The w-test statistic values for the associated code measurements are depicted in Figure 4 in the same order. The critical values (thresholds) for w-test statistic  $\lsqb {N_{\textstyle{\alpha \over 2}} (0,1)} \rsqb$ are shown in Figures 1 to 4 as solid red lines. In practice, the significance level (α) needed for the computation of the critical values should be selected based on the requirements of the application at hand. We assume here that α equals 0·001, which is a reasonable value for precise positioning. For q=1, the critical value for the w-test statistic is ±3·29. A possible outlier or cycle slip (as low as one cycle) is suspected when the computed w-test statistic exceeds this critical value.
Time-series and histograms of w-test statistic for Galileo phase measurements on frequencies E1 (ϕ 1), E5a (ϕ 5) and E5b (ϕ 7).
Time-series and histograms of w-test statistic for Galileo code measurements on frequencies E1 (p 1), E5a (p 5) and E5b (p 7).
4.3 Diagnostics analysis using the w-test statistic
The w-test statistic results for the given examples from the three systems: GPS, GLONASSS and Galileo are checked to see if they approximately follow a standard normal distribution with the selected significance level, which may give a first indication about correctness of the model used. The following checks were performed for each observation type in the tested satellites:
(1) Visual inspection of the histograms to check if the w-test statistic varies in a random manner, with a standard normal distribution. This is shown in Figures 1 to 4, for which the model and stochastic information are set correctly. On the other hand, Figure 5 illustrates two examples of incorrect modelling for the same observations of GPS satellite PRN 13 used in Figure 1. In the first example, shown in Figure 5(a), the ionosphere was incorrectly modelled (replacing the positive sign of the ionosphere error in the code observation model with a negative sign, imitating a software coding mistake). In the second example, depicted in Figure 5(b), the process noise parameters were incorrectly set (amplifying the code spectral density to ten times the assumed correct value). As shown, the w-test statistic histograms in both cases significantly deviate from the standard normal distribution and when compared with Figure 1. Another example for diagnostics of errors in the dynamic model is given in Figure 6 for GPS satellite PRN 31 in the kinematic test data (after applying the process of detection and identification of observation errors), where Figure 6(a) shows results of a correctly assumed first-order Gauss-Markov model for the parameters δI,  $\delta b_{\phi _j} $, and
 $\delta b_{\,p_j} $. On the other hand, Figure 6(b) depicts a case of using a dynamic model of these parameters with artificial permanent slips inserted for testing purpose (which is arbitrarily taken for illustration purposes approximately equivalent to three times the temporal correlations used in the first case). As the figure shows, the presence of the slips in the dynamic model has resulted in changing the graphical distribution of the w-statistic as well as its mean value and standard deviation from that of the theoretical standard normal distribution.
Time-series of w-test statistic for measurements with incorrect stochastic modelling.
Time-series of w-test statistic for measurements with correct dynamic model (a) and incorrect dynamic model (b).
(2) Inspection of the probability plots of the w-test statistic, which is a graphical method for assessing whether it is approximately normally distributed. An example of tested normal probability plots is given in Figure 7 for p1 code observations of GPS satellite PRN 26. In this plot, the data are ordered and plotted against the corresponding percentage points from a standard normal distribution in such a way that the points should form an approximate straight line. Departures from this straight line indicate departures from normality. An example of a normal plot with an accurate variance is given in Figure 8. The skewness or short/long tails of points on the plot indicate skewness and tailing of data distribution. Inference of the plot would help in tuning the variance of the observations. For instance, long tails with an ‘S’ shaped-curve, as in the case of the given example, indicates that the data have more variance than expected from data of a normal distribution. On the other hand, short tails indicate less variance than one would expect. The Q-Q plots can be used as an alternative to the normal probability plots. The Q-Q plot is used to compare the quantile of the data presented on the vertical axis to that of a standard normal population exemplified on the horizontal axis. The quantiles can be obtained by inverting the cumulative distribution function (CDF) of the data. Similar to the normal plot, the linearity of the points suggests that the data are normally distributed. The offset between the line and the points suggests that the mean of the data is not “0”.
Normal Probability plot of w-test statistic for p 1 observations of GPS with correct modelling.
Normal Probability plot of w-test statistic for p 1 observations of GPS with incorrect stochastic information.
(3) Examination of the mean using the z-test, computing the test statistic:
 $$z = \displaystyle{{\bar x - \mu} \over {\sigma /\sqrt n}} $$
under the assumption that w-statistic values are independent, where  $\bar x$ is the sample mean, μ is the hypothesized population mean, σ is the population standard deviation, and n is the sample size. Under the null hypothesis, the test statistic will have a standard normal distribution, N(0,1). Test results showed that, in general, the test passes for the data at hand where the computed P-values were greater than the critical value in more than 94% of the cases using α=0·05, which is usually considered for similar type of testing. It was observed that the cases where the test fails are usually coupled with failing the detection test given in Equation (18).
(4) Performing the Kolmogorov-Smirnov goodness-of-fit test (Marsaglia et al., Reference Marsaglia, Tsang and Wang2003) which compares the cumulative distribution function (CDF) of the time-series of the w-test statistic to the hypothesized CDF of continuous distribution defined by the standard normal distribution. For the test data considered here, the test was successful in 91% of the cases. It was observed that the cases where the test fails are usually associated with failing the detection test.
Another example is given for the kinematic test of the boat data, which is illustrated in Figures 9 and 10, where for GPS satellite PRN 31, a five-minute period of observations full of significant real outliers at the end of the satellite observation period was experienced. Detection and removal of faulty observations was performed before using the data in positioning. The errors resulted in the distribution of the w-test statistic that does not agree with the standard normal distribution as depicted in Figure 8, where the shown range of the w-test statistic values in the histogram plots were limited to ±4 for better visual comparison with other figures, and therefore the spikes in the figure corresponding to the maximum values of w-statistic are not shown. Large standard deviations (approximately three to nine) of the w statistic and some scattered spikes in the distribution can be seen. In addition, a comparison between the probability density function of the data (pdf data) against the pdf of the standard normal distribution (pdf snd) is illustrated on the right hand side of the figure. As can be seen, the pdf of the data is very far from that of the standard normal distribution. However, when these data with severe irregularities were detected and removed using the single-receiver single-satellite method, the distribution of the re-computed w-test statistic turned into reasonable agreement with the standard normal distribution, with standard deviations close to one and pdf of data is almost the same as pdf of snd, as illustrated in Figure 10.
Kinematic test, w-test statistic with data of significant outliers (at the end).
Kinematic test, w-test statistic with data of significant outliers removed.
4.4 Diagnostic analysis using TLOM statistic
Another diagnostic tool that can be utilised from the output of the single-receiver single-satellite validation method is to check whether the test statistic T LOM when divided by the degrees of freedom df follows a Fisher distribution if the model is set correctly and the observations do not have significant irregularities. As an example, Figures 11 and 12 show the local detection results of the tested data set of 15 March 2012 for the GPS PRN 13 and GLONASS PRN 18. The left side of the figures shows the time-series of  $\textstyle{{T_{LOM}} \over {df}}$ and its critical value F α(df, ∞, 0) denoted in the figures as K LOM, where df is extracted from the number of observations at each epoch. The right side of the figures illustrates the histogram of the shown
 $\textstyle {{T_{LOM}} \over {df}}$ values. From the figures, the few epochs where outliers were detected can be identified when the test statistic exceeded the critical value. For the shown data, the df did not change throughout the examined observation period as no missing observations were encountered during this period. The Fisher distribution of the data associated with these df is depicted in the figures. As the figures illustrate, the
 $\textstyle{{T_{LOM}} \over {df}}$ histograms are in a close agreement with the Fisher distribution for the examined satellites’ data.
Time-series and histogram of T LOM/df for GPS .
Time-series and histogram of T LOM/df for GLONASS.
Similarly, Figures 13 and 14 show the time-series of  $\textstyle{{T_{LOM}} \over {df}}$, its critical value F α(df, ∞, 0), and its histogram for the kinematic ship-borne test data before and after the removal of the bad period of GPS satellite PRN 31 data. As the figures illustrate, the
 $\textstyle{{T_{LOM}} \over {df}}$ histogram in the first case has some spikes (some are at the maximum values of
 $\textstyle{{T_{LOM}} \over {df}}$, which are not shown for better visual comparison among the figures). When the bad data were removed, the histogram better followed the Fisher distribution as shown in Figure 14.
Time-series and histogram of T LOM/df for GPS 31 in the kinematic test before removal of bad data.
Time-series and histogram of T LOM/df for GPS 31 in the kinematic test after removal of bad data.
5. CONCLUSIONS
The single-receiver single-satellite validation method of GNSS measurements is applicable to any GNSS with any arbitrary number of frequencies. It is shown how the data validation parameters can provide numeric and graphical diagnostics for the individual satellite observations, which is a desirable task for several applications such as SPP, PPP, RTK and PPP-RTK. The diagnostics can also show whether the model is set correctly. Two of these diagnostics were presented. The first is by checking that the estimated w-test statistic of the observed signals follows a standard normal distribution. The second diagnostic is to check that the local overall model statistic in one form follows a Fisher distribution. The method was demonstrated using phase and code data from GPS, GLONASS and Galileo on all their frequencies for test data that span three days in a static test site, and for almost nine hours in a kinematic ship-borne mode. The diagnoses for incorrect modelling and severe irregularities in the data are demonstrated through some examples.
ACKNOWLEDGMENT
The author would like to thank Prof. P.J.G. Teunissen for his suggestions and comments. The GNSS research centre of Curtin University is acknowledged for providing the data used in this study.
FINANCIAL SUPPORT
This work was supported by an IRG grant, project number 47606, from Curtin University, Australia.




