I. INTRODUCTION
Recently, extensive studies have been carried out on negative thermal expansion (NTE) materials, such as A(MO4)2Reference Mary, Evans, Vogt and Sleight1–Reference Liang4 (A = Zr, Hf or mixture of them; M = W, Mo, or mixture of them), AM2O7,Reference Sahoo, Sumithra, Madras and Row5 ABO3 (e.g., PbTiO3, BiNiO3),Reference Chen, Fan, Ren, Pan, Deng, Yu and Xing6 A2M3O12,Reference Sumithra and Umarji7–Reference Sumithra, Tyagib and Umarjia9 where A is a transition metal or rare earth and M is W or Mo, and Zr2P2MO12 (M = W, Mo).Reference Cetinkol, Wilkinson and Lee10–Reference Evans, Mary and Sleight12
The A2M3O12 family of materials crystallizes in either a monoclinic or an orthorhombic structure depending on the A3+ cation size. Those with larger A3+ cations (from Sc3+ to Lu3+) crystallize in an orthorhombic structure (space group Pbcn)Reference Evans, Mary and Sleight13–Reference Liang, Huo, Wang and Chao16 and exhibit NTE, whereas those with smaller A3+ cations (from Fe3+ to Al3+) crystallize in a monoclinic structure (space group P2 1/a) and exhibit positive thermal expansion. For the orthorhombic A2M3O12 consisting of all corner-sharing MO4 and AO6 polyhedra, the larger the A3+ cation the more negative the linear coefficient of thermal expansion (CTE), due to smaller oxygen–oxygen repulsion and more distortion of the polyhedra on heating. The materials of the A2M3O12 with larger A3+ cation size exhibit larger NTE with lower anisotropy over a wide temperature range. Their NTEs are only observed after complete release of the crystal water because the openings in the network become large enough to admit water molecules. The crystal water inhibits the flexibility as well as the internal vibrations of the polyhedra, which are essential for NTE.Reference Evans, Mary and Sleight13–Reference Liang, Huo, Wang and Chao16
On the other hand, the materials of the A2M3O12 family with smaller A3+ cation size give rise to smaller NTE or even crystallize in a monoclinic structure at room temperature (RT). For the latter case, the NTE of materials is only possible after monoclinic-to-orthorhombic phase transition at higher temperatures.Reference Tyagi, Achary and Mathews17 Al2Mo3O12, Cr2Mo3O12, and Fe2Mo3O12 are examples that crystallize in monoclinic at RT and transforms from monoclinic to orthorhombic around 473, 658, and 780 K, respectively.Reference Ari, Jardim, Marinkovic, Rizzo and Ferreira14,Reference Tyagi, Achary and Mathews17 The transition temperatures of the solid solutions Cr2xFe2–2xMo3O12, Al2xCr2–2xMo3O12, and Al2xFe2–2xMo3O12 (0 < x < 1) are between those of their two constitutional compounds A2Mo3O12.Reference Ari, Jardim, Marinkovic, Rizzo and Ferreira14 To reduce the monoclinic-to-orthorhombic phase-transition temperature to below RT for this family of materials with smaller A3+ cation size and to reduce the hygroscopicity for those with larger A3+ cation size still remain a challenge.
In previous papers, we synthesized Fe2–xYxMo3O12Reference Li, Song and Liang18 and Yb2–xAlxMo3O12Reference Li, Yuan, Song, Liang and Yuan19 to decrease the hygroscopicity of Y2Mo3O12 and Yb2Mo3O12Reference Liang, Huo, Wang and Chao16,Reference Tyagi, Achary and Mathews17,Reference Sleight and Brixner20 and the monoclinic-to-orthorhombic phase-transition temperature of Fe2Mo3O12 and Al2Mo3O12. It was found that the phase transition temperature can be effectively reduced to below RT by substitution of Al3+ or Fe3+ by Yb3+ or Y3+, but the orthorhombic Yb2–xAlxMo3O12 and Fe2–xYxMo3O12 are still hygroscopic. The A3+ cation can not only be a transition metal or rare earth that occupies an octahedral position, but also be substituted by a mixture of tetravalent and bivalent cations. Materials with the formula HfMgM3O12 were found to exhibit low or negative linear thermal expansion (αl = 1.02 × 10⁻⁶ K−1 for HfMgMo3O12,Reference Marinkovic, Jardim, Ari, Avillez, Rizzo and Ferreira21 αl = −0.77 × 10⁻⁶ K−1,Reference Suzuki and Omote22 αl = −1.2 × 10⁻⁶ K−1 (Ref. Reference Gindhart, Linda and Green23) for HfMgW3O12). Suzuki et al. synthesized Al2x(HfMg)1–xW3O12, which showed low thermal expansion from αl = 2 × 10⁻⁶ K−1 to αl = −2 × 10⁻⁶ K−1 for x = 0–0.7.Reference Suzuki and Omote24 Al2W3O12 crystallizes already in orthorhombic structure with a low linear thermal expansion (αl = 1.50 × 10⁻⁶ K−1) at RT and transforms from orthorhombic to monoclinic at 257 K.Reference Suzuki and Omote24,Reference Varga, Moats, Ushakov and Navrotsky25 More recently, Kimberly et al. reported In(HfMg)0.5Mo3O12, which exhibited a monoclinic (P2 1/a) to orthorhombic (Pnma) phase transition at about 425 K and NTE (αl = −0.4 × 10⁻⁶ K−1) from 500 to 900 K.Reference Kimberly, Carl, Mario, Bojan, Luciana and Mary26 ZrMgMo3O12 was also demonstrated to exhibit NTE (αl = −3.8 × 10⁻⁶ K−1) from 300 to 1000 K in this work.Reference Song, Liang, Liu, Li, Yuan and Wang27
As mentioned above, Fe2Mo3O12 crystallizes in monoclinic at RT and transforms from monoclinic to orthorhombic around 780 K. NTE was only observed above the phase transition temperature. In this paper, materials with the formula Fe2–x(ZrMg)0.5xMo3O12 (x = 0.2, 0.4, 0.5, 0.6, 0.8, 1.0, 1.2, 1.4, 1.6, and 1.8) are designed to reduce the monoclinic-to-orthorhombic phase transition temperature of Fe2Mo3O12. It is found that Fe2–x(ZrMg)0.5xMo3O12 crystallizes in either monoclinic or orthorhombic phase depending on substitution amounts of Fe3+ by (Zr4+Mg2+). The monoclinic-to-orthorhombic phase-transition temperature can be effectively decreased by increasing the contents of (Zr4+Mg2+), so that Fe0.4(ZrMg)0.8Mo3O12 crystallizes already in orthorhombic at RT and keeps this structure until a very low temperature (lower than 103 K). Besides, the co-incorporation of Zr4+ and Mg2+ also tailors the CTEs and hence near-zero CTEs are obtained for compositions around Fe0.3(ZrMg)0.85Mo3O12.
II. EXPERIMENTAL
Commercial chemicals of Fe2O3, ZrO2, MgO, and MoO3 (99.9% purity) were mixed according to the stoichiometric ratios of destination materials of Fe2–x(ZrMg)0.5xMo3O12 (x = 0, 0.2, 0.4, 0.5, 0.6, 0.8, 1, 1.2, 1.4, 1.6, and 1.8). The mixtures were ground in a mortar for 2 h, sintered in a tubular furnace at 1173 K for 8 h, and cooled down slowly.
X-ray diffraction (XRD) measurements with powdered samples were carried out on an X′ Pert PRO x-ray diffractometer (PANalytical Co., Netherlands). A Renishaw MR-2000 Raman spectrometer (Renishaw Co., UK) with a 532 nm laser wavelength excitation and a Jobin Yvon T64000 Raman spectrometer (HORIBA Ltd., Japan) with a 514.5 nm laser wavelength excitation were used for Raman spectroscopic studies. The laser beam was linearly polarized and the spot size on the samples was about 1 μm. Ceramic blocks were directly used for Raman spectroscopic measurements. Because the grains in the ceramic bodies are randomly oriented, the Raman patterns show no difference from those of powdered samples. Temperature dependence of the Raman spectra was recorded by using a TMS 94 heating/freezing stage from Linkam Scientific Instruments Ltd, with an accuracy of ±0.1 K. The differential scanning calorimetry (DSC) and thermogravimetry (TG) studies were done on an Ulvac Sinku-Riko DSC, Model 1500M/L (Ulvac Sinku-Riko, Japan) with the heating and cooling rates of 10 K/min. The linear CTE was measured with a dilatometer (LINSEIS DIL L76, LINSEIS Co., Germany). Ceramic bars were used for the CTE measurements by dilatometer. The thickness of samples was 9.48 mm and 7.14 mm for Fe0.2(ZrMg)0.9Mo3O12 and Fe0.4(ZrMg)0.8Mo3O12, respectively.
III. RESULTS AND DISCUSSION
A. Phase transition
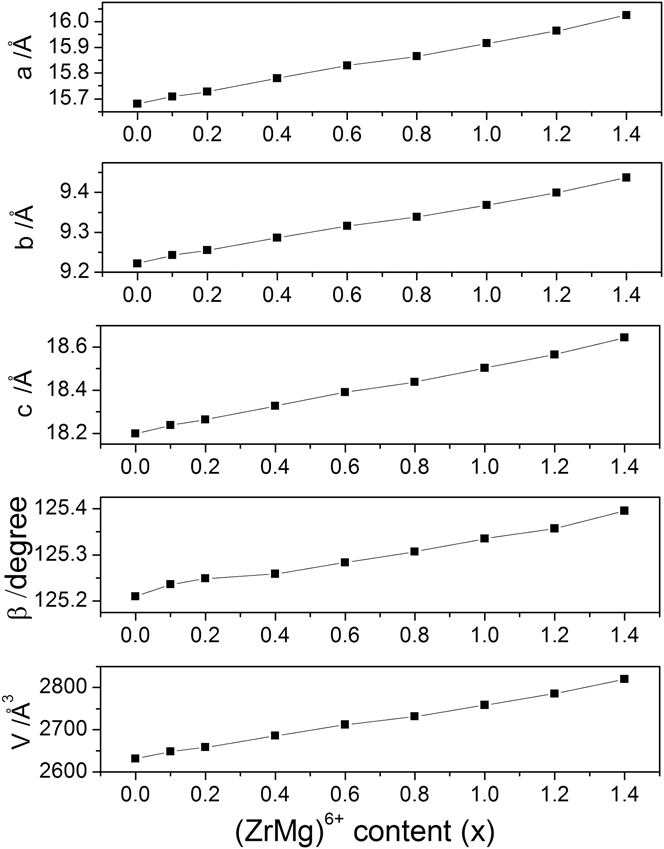
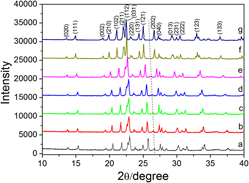
Figure 1 shows the XRD patterns of Fe2–x(ZrMg)0.5xMo3O12 for x = 0.0, 0.2, 0.6, 1.0, 1.4, 1.6, and 1.8 at RT. The XRD patterns comply well with that of a monoclinic Fe2Mo3O12 (ICDD-PDF No. 00-031-0642) and remain unchanged, except for a successive shift of the diffraction peaks to smaller angles by increasing the contents of (ZrMg)6+ till x = 1.4. It indicates that the synthesized compounds Fe2–x(ZrMg)0.5xMo3O12 crystallized in a single monoclinic phase for 0 < x ≤ 1.4. The shifts of the peaks suggest a progressive increase in lattice constants due to the average cation radius of Zr4+ and Mg2+ (72 pm) being bigger than that of Fe3+ (64.5 pm). However, a distinct change of the XRD patterns starts to occur for x ≥ 1.6 as indicated by the disappearance of the diffraction peak at 26.67°, suggesting that Fe2–x(ZrMg)0.5xMo3O12 (x ≥ 1.6) crystallized in an orthorhombic structure (ICDD-PDF No. 00-033-0661). Rietveld analyses of the XRD data of Fe2–x(ZrMg)0.5x(MoO4)3 (x = 0–1.4) indicated that lattice parameters, angle, and volume of the unit cell solid solutions increase almost linearly with increasing (ZrMg)6+ content in Fig. 2.
XRD patterns of Fe2–x(ZrMg)0.5xMo3O12 at RT: (a) x = 0.0; (b) x = 0.2; (c) x = 0.6; (d) x = 1.0; (e) x = 1.4; (f) x =1.6; (g) x = 1.8.

The lattice parameters of Fe2–x(ZrMg)0.5xMo3O12 (x = 0.0–1.4) solid solution at RT as a function of (ZrMg)6+ content.

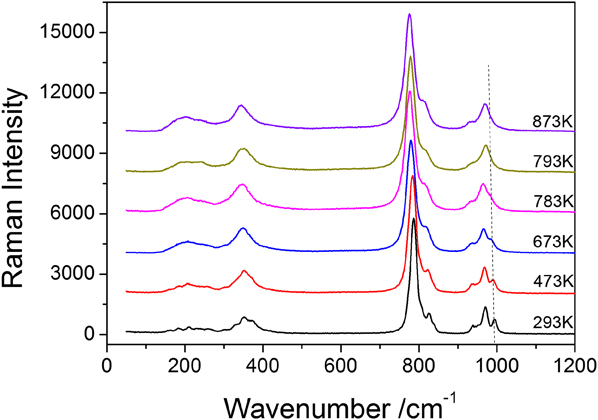
The phase transition of Fe2Mo3O12 has been studied by DSCReference Tyagi, Achary and Mathews17 as well as by Raman spectroscopy.Reference Li, Song and Liang18 Figure 3 shows the typical temperature dependence of the Raman spectra of Fe2Mo3O12. By comparison with the Raman spectrum of Y2Mo3O12,Reference Liang, Huo, Wang and Chao16 the Raman modes between 900–1050, 750–900, and 300–400 cm−1 are identified as internal symmetric stretching, asymmetric stretching, and bending vibrations of the MoO4 tetrahedra while those below 300 cm−1 are translational and librational motions of the polyhedra. The Raman bands at 994 cm−1 become weak gradually and vanish when the temperature is increased to 793 K. This indicates that a monoclinic to an orthorhombic phase transition of Fe2Mo3O12 occurs between 783 and 793 K.
Raman spectra of Fe2Mo3O12 at different temperatures.

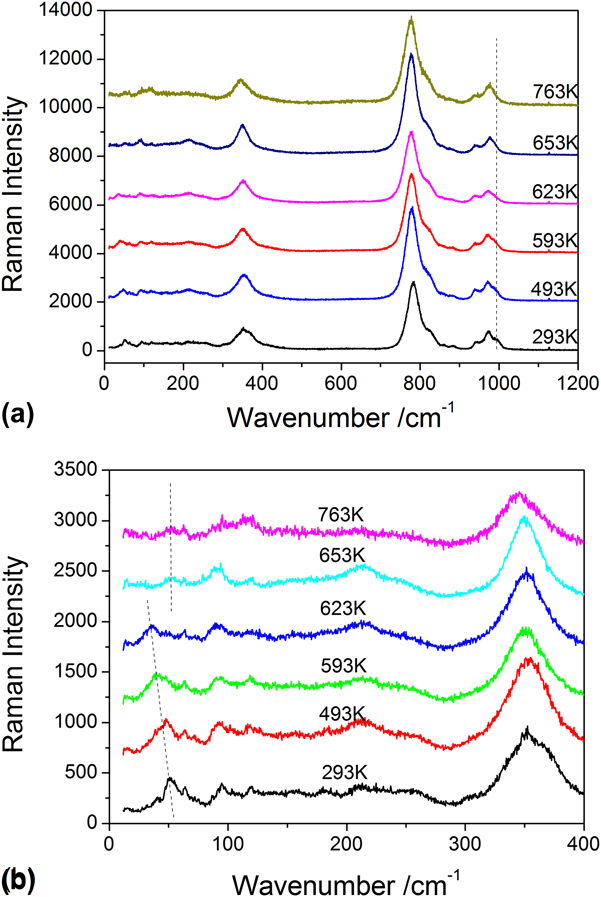
Figure 4(a) is the temperature dependence of the Raman spectra of Fe1.6(ZrMg)0.2Mo3O12. With the increase in temperature, the Raman band at about 992 cm−1 becomes weak gradually and disappears at 653 K, suggesting that a monoclinic to orthorhombic phase transition occurs between 623 and 653 K, about 150 K lower than that of Fe2Mo3O12. Figure 4(b) shows the temperature dependence of the lower energy Raman modes of Fe1.6(ZrMg)0.2Mo3O12. The Raman band at 51 cm−1 shifts progressively to lower wavenumbers with increasing temperature (36 cm−1 at 623 K) as shown by the solid line. This Raman band disappears at 653 K and a new Raman band at about 52 cm−1 appears. It confirms that the monoclinic to orthorhombic phase transition of Fe1.6(ZrMg)0.2Mo3O12 occurs between 623 and 653 K.
(a) Raman spectra and (b) low wavenumber Raman spectra of Fe1.6(ZrMg)0.2Mo3O12 at different temperatures.

Temperature dependence of the Raman spectra of Fe2–x(ZrMg)0.5xMo3O12 for all other samples was also measured. It is shown that they exhibit similar behaviors as in Fig. 4 for all the samples with x ≤ 1.4 except the monoclinic-to-orthorhombic phase transition temperature. Table I summarizes the phase transition temperatures of Fe2–x(ZrMg)0.5xMo3O12 for x = 0.0, 0.4, 0.8, 1.2, and 1.4 by Raman spectroscopy. The phase transition temperature decreases with increase in the content of (ZrMg)6+ so that it is reduced to about 340 K for x = 1.4.
The phase transition temperature of Fe2–x(ZrMg)0.5xMo3O12.

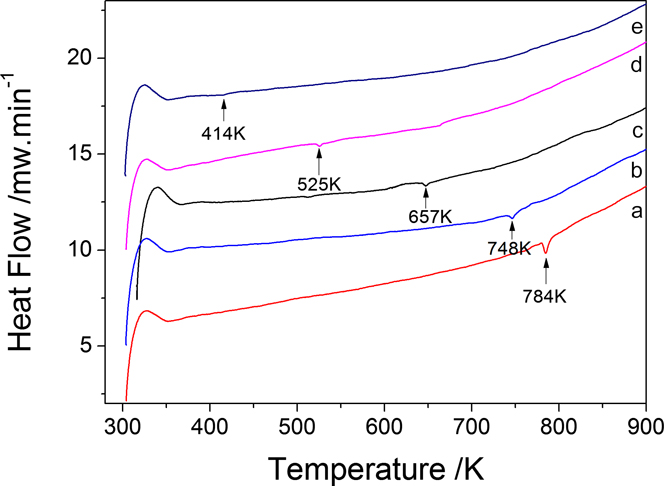
The effective decrease of the phase transition temperature by increasing the substitution amounts of (ZrMg)6+ for Fe3+ revealed by Raman spectroscopy was confirmed by DSC. Figure 5 shows the DSC curves of Fe2–x(ZrMg)0.5xMo3O12 for x = 0.0, 0.1, 0.4, 0.8, 1.2. It shows clearly that the monoclinic-to-orthorhombic phase transition temperature decreases with increase in the amount of (ZrMg)6+ as indicated by the endothermic peak in each curve.
Typical DSC scans for Fe2–x(ZrMg)0.5xMo3O12: (a) x = 0.0; (b) x = 0.1; (c) x = 0.4; (d) x = 0.8; (e) x = 1.2.

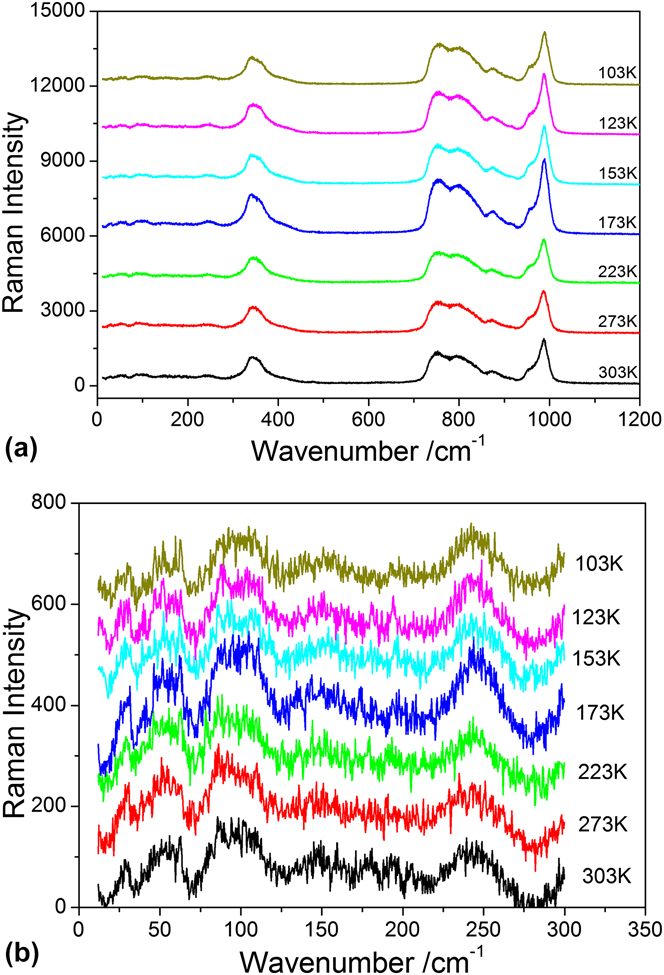
From the above measurements, we expect Fe2–x(ZrMg)0.5xMo3O12 to crystallize in an orthorhombic structure at RT with further increase in the content of (ZrMg)6+. Figure 6 shows the temperature dependence of the Raman spectra of Fe0.4(ZrMg)0.8Mo3O12 from 103 to 303 K. The characteristic Raman band at about 992 cm−1 for the monoclinic phase does not appear and no obvious changes in the Raman spectra are observed within the temperature range. It indicates that Fe0.4(ZrMg)0.8Mo3O12 crystallizes in an orthorhombic phase already at RT and keeps this structure until a very low temperature (<103 K). For Fe0.2(ZrMg)0.9Mo3O12, the same results are observed (not shown here).
(a) Raman spectra and (b) low wavenumber Raman spectra of Fe0.4(ZrMg)0.8Mo3O12 at different temperatures.

B. Thermal expansion properties
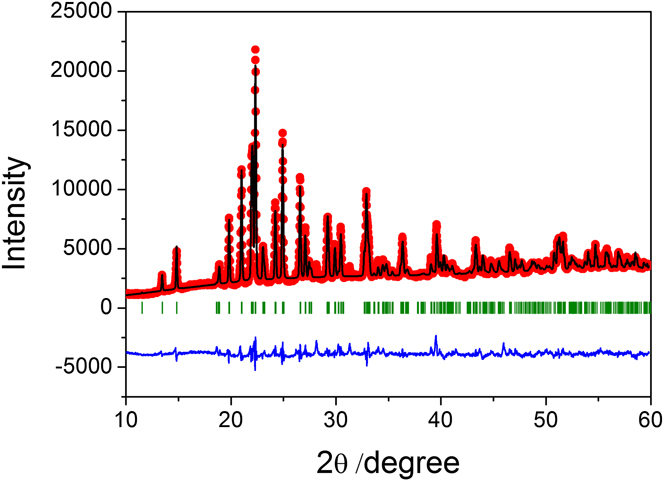
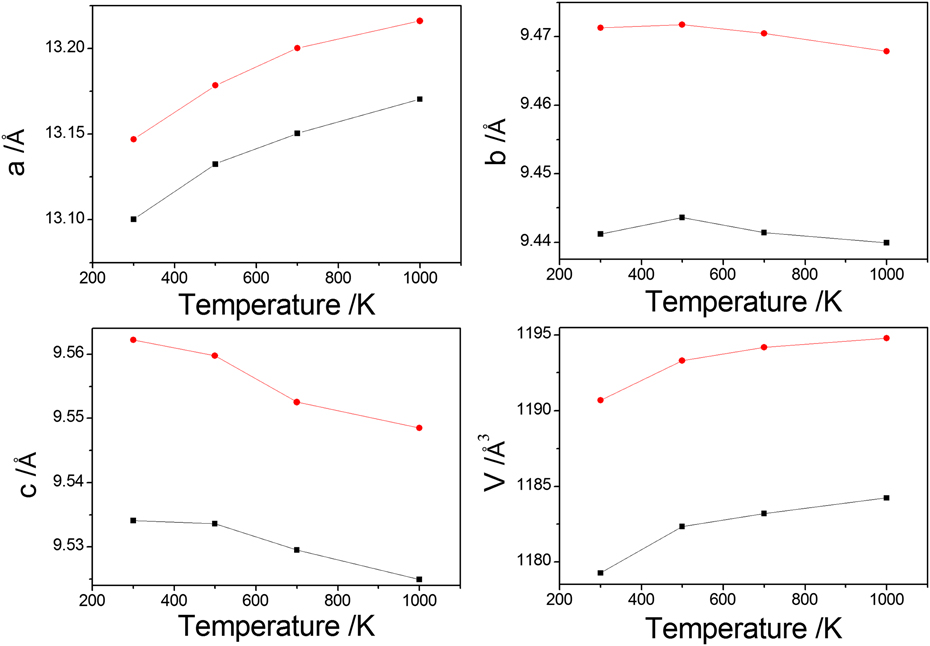
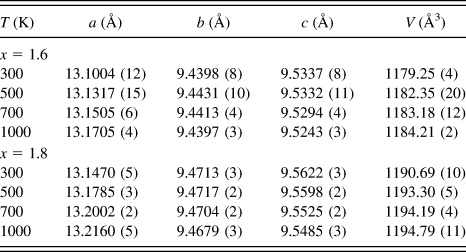
As demonstrated above, Fe2–x(ZrMg)0.5xMo3O12 for x ≥ 1.6 crystallizes in an orthorhombic phase and a low thermal expansion or NTE is expected for these materials. The XRD patterns of Fe2–x(ZrMg)0.5xMo3O12 (x = 1.6, 1.8) in the temperature range of 300–1000 K have been measured and structure refinements have been done by the Rietveld method using the program Fullprof. Figure 7 illustrates the typical experimental, calculated, and difference profile after Rietveld refinement for x = 1.6. Temperature dependence of cell parameters for x = 1.6 and 1.8 after Rietveld refinement is shown in Fig. 8 and Table II. It can be seen that the a-axis expands while the c-axis contracts with increasing temperature for both samples. The b-axis shows expansion from 300 to 500 K and contraction from 500 to 1000 K. The phenomenon may be the result from lattice distortion by substitution of (ZrMg)6+ for Fe3+.Reference Peng, Wu, Wang, Hao, Hua, Yu, Chen, Kiyanagi, Fieramosca, Short and Jorgensen28 The replacement has more impact on the b-axis than a- and c-axis. The average axial CTEs from 300 to 1000 K are calculated to be αa = 7.64 × 10⁻⁶ K−1, αb = −0.20 × 10⁻⁶ K−1, αc = −1.38 × 10⁻⁶ K−1 for Fe0.4(ZrMg)0.8Mo3O12 and αa = 7.50 × 10⁻⁶ K−1, αb = −0.50 × 10⁻⁶ K−1, αc = −2.05 × 10⁻⁶ K−1 for Fe0.2(ZrMg)0.9Mo3O12. This gives rise to a linear CTE (αl = αυ/3) of αl = 2.02 × 10⁻⁶ K−1 and αl = 1.64 × 10⁻⁶ K−1 for x = 1.6 and x = 1.8, respectively.
Result of the Rietveld analysis of the XRD patterns of Fe0.4(ZrMg)0.8Mo3O12 at 300 K [Profile Factor (Rp) = 20.7%, Weighted Profile Factor (Rwp) = 23.1%, and Expected Weighted Profile Factor (Rexp) = 5.45%].

Lattice parameters of Fe0.4(ZrMg)0.8Mo3O12 (■ symbols) and Fe0.2(ZrMg)0.9Mo3O12 (● symbols) at different temperatures.

Crystallographic data of Fe2–x(ZrMg)0.5xMo3O12 (x = 1.6 and 1.8) from 300 to 1000 K.

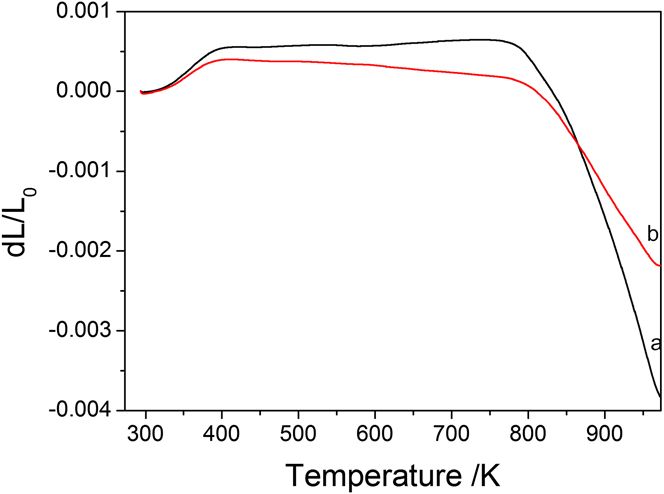
Figure 9 shows the relative length change of Fe0.4(ZrMg)0.8Mo3O12 and Fe0.2(ZrMg)0.9Mo3O12 bars with temperature measured with a dilatometer. The linear CTEs by dilatometer from 423 to 773 K are 0.18 × 10⁻⁶ K−1 and −0.67 × 10⁻⁶ K−1 for Fe0.4(ZrMg)0.8Mo3O12 and Fe0.2(ZrMg)0.9Mo3O12, respectively. The sharp declining part of the linear CTE curves is attributed to the softening of the samples. The discrepancy between the measurements of thermal expansion coefficients based on dilatometric and diffraction methods was frequently observed for the A2M3O12 family of materials. For example, the CTE for Al2W3O12 was reported as 2.2 × 10⁻⁶ K−1 based on XRD dataReference Evans, Mary and Sleight13 and −3.0 × 10⁻⁶ K−1 by dilatometry.Reference Mary and Sleight29 The XRD method gives the crystal cell parameters, whereas the dilatometry gives the relative length changes of a bulk material with temperature. The latter could be affected by sample conditions such as gaps between grains and microcracks of the samples.
Relative length change of Fe0.4(ZrMg)0.8Mo3O12 and Fe0.2(ZrMg)0.9Mo3O12 with temperature: (a) Fe0.4(ZrMg)0.8Mo3O12; (b) Fe0.2(ZrMg)0.9Mo3O12.

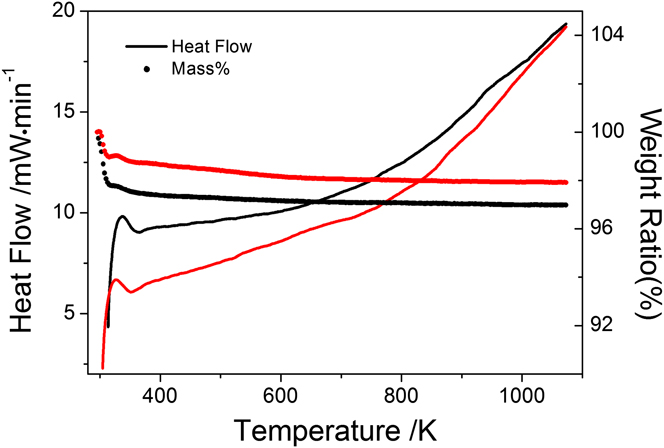
Figure 10 shows the DSC and thermogravimetric plots for Fe0.4(ZrMg)0.8Mo3O12 and Fe0.2(ZrMg)0.9Mo3O12. Neither obvious endothermic/exothermic peaks nor evident weight loss from RT to about 1073 K is observed, indicating that Fe0.4(ZrMg)0.8Mo3O12 and Fe0.2(ZrMg)0.9Mo3O12 do not exhibit phase transition and hygroscopicity from 300 to 1073 K. Otherwise, the release of water species with increasing temperature would result in a weight loss in the TG plot accompanied by an endothermic peak in the DSC curve, as usually observed for Y2Mo3O12, whose weight loss is 13% from RT to 700 K.Reference Li, Song and Liang18 Compared with Y2Mo3O12, the weight loss of Fe0.4(ZrMg)0.8Mo3O12 and Fe0.2(ZrMg)0.9Mo3O12 is less than 4%.
Typical DSC curves (— symbols) and thermogravimetric plots (● symbols) for Fe0.4(ZrMg)0.8Mo3O12 (black line) and Fe0.2(ZrMg)0.9Mo3O12 (red line).

A recent analysis on the phonon modes of Y2Mo3O12 and eigenvectors based on first principles showed that most of the phonon modes (75 out of 111) below 300 cm−1 gave rise to negative Grüneisen parameters and therefore contribute to NTE.Reference Wang, Yuan, Wang, Sun, Liang and Jia30 Both Y and Mo atoms vibrate in the same direction relative to the bridging O (translational vibration), which has the largest negative Grüneisen parameter and contributes most to the NTE of Y2Mo3O12. The low thermal expansion behavior in the orthorhombic Fe2–x(ZrMg)0.5xMo3O12 may be understood in a similar way.
IV. CONCLUSIONS
New compounds with the formula Fe2–x(ZrMg)0.5xMo3O12 (x = 0–1.8) were designed and synthesized by substitutional co-incorporation of Zr4+ and Mg2+ in the Fe2Mo3O12 with the aim to reduce the monoclinic-to-orthorhombic phase transition temperature. The influence of the co-incorporation on the structures, phase transitions, and thermal expansion properties was studied by XRD, Raman spectroscopy, DSC, and dilatometry. We found that the monoclinic-to-orthorhombic phase transition temperature of the Fe2Mo3O12 could be reduced effectively by the substitutional co-incorporation of Zr4+ and Mg2+. As a result, Fe0.4(ZrMg)0.8Mo3O12 crystallized already in orthorhombic phase at RT and could keep this structure as low as 103 K. Besides, the co-incorporation also tailored the CTEs of the compound and the near-zero CTEs were obtained for the compound around x = 1.7 (Fe0.3(ZrMg)0.85Mo3O12). The linear CTEs obtained by XRD over the temperature range 300–1000 K are 2.02 × 10⁻⁶ K−1 and 1.64 × 10⁻⁶ K−1 for samples x = 1.6 and x = 1.8, respectively, whereas the CTEs of the two samples measured by dilatometer are 0.18 × 10⁻⁶ K−1 and −0.67 × 10⁻⁶ K−1 from 423 to 773 K. Our work paves the way toward developing low-cost and near-zero thermal expansion materials with wide temperature ranges.
ACKNOWLEDGMENTS
This work was supported by the National Science Foundation of China (No. 10974183, 11104252), by the Ministry of Education of China (No. 20114101110003), by the fund for Science & Technology innovation team of Zhengzhou (No. 112PCXTD337), and by the postdoctoral research sponsorship in Henan province (Grant No. 2011002).