I. INTRODUCTION
Porous metal and silicon oxides have a wide range of applications, including catalysts, photonic crystals, gas and liquid separation membranes, thermal insulation materials, sensors, and electro-optical materials.Reference Tanev, Chibwe and Pinnavaia1–Reference Zayat and Levy7 The sol-gel method is widely used for the preparation of porous oxides because of the availability of a large number of precursors in the form of silicon and metal alkoxides and the possibility of preparing a wide variety of structures, including films, fibers, nano- and microparticles, and monoliths.Reference Sakka, Langlet and Kamiya8 The classical hydrolytic sol-gel route involves hydrolysis and polycondensation reactions of silicon and metal alkoxides in a solvent (usually alcohol) environment. This hydrolysis produces the sol, which is a colloidal suspension of oligomeric species. Further agglomeration leads to the formation of a gel that develops into an amorphous micro- or mesoporous xerogel through drying and aging. Precise control over the porosity is necessary both to avoid stress-induced cracking caused by differential shrinkage during dryingReference Scherer9 and for specific pore size distribution to achieve the desired functionality in certain applications. For the latter purpose, surfactant-, emulsion-, and microsphere colloidal templating methods have been used in combination with sol-gel process. These techniques have led to precise control of the porosity of silicon and metal oxides at the meso- and macropore ranges during the preparation of hierarchically porous materials with highly versatile and complex morphologies.Reference Yusuf, Imai and Hirashima10–Reference Stein12 In addition to the templating approach, the phase separation method has emerged as a very powerful means to obtain hierarchically porous oxides with either two cocontinuous phases or one fragmented phase inside the continuous micro- or mesoporous matrix phase.Reference Nakanishi and Tanaka13 When a highly polar solvent is used in the sol-gel process instead of (or in combination with) the classical alcohol solvents, polycondensation leads to macroscopic phase separation in the form of a spinodal decomposition or nucleation growth. In such materials, macropores are obtained in addition to the micro- and (in some cases) mesopores that are characteristic of xerogels prepared by the sol-gel method.Reference Nakanishi14 The first systematic study of macroporous monolithic silica prepared using sol-gel phase separation was published in 1991,Reference Nakanishi and Soga15 starting a field of research that has been continuously expanding. The same year, Otón et al. used different liquid crystals (LCs) as polar solvents to achieve phase separation.Reference Otón, Serrano, Cerna and Levy16, Reference Levy, Cerna and Otón17 The material obtained by this process is called a gel-glass dispersed liquid crystal (GDLC). A GDLC is a hybrid electro-optical material that consists of liquid crystal microdroplets encapsulated in inorganic or organically modified silica or mixed oxide matrices. The preparation of a GDLC material is an intrinsic part of the study of phase separation in sol-gel systems, although this connection has not yet been discussed in papers in the GDLC field. By the operating principle, the GDLC material is similar to polymer-dispersed liquid crystals (PDLCs), but as PDLCs are thoroughly researched and commercial applications already exist in the smart glass industry, the development of GDLC materials is still in its infancy—over the course of 20 years, less than 20 scientific papers have been published.
The preparation of GDLC is an exception among phase separation techniques because it does not include the selective removal of the phase-separated liquid phase, which is conventionally accomplished in the production of porous materials with a bicontinuous domain structure by phase separation.Reference Nakanishi14 Instead, the LC phase is maintained to produce the electro-optical functionality of GDLC. Because of the dielectric and optical anisotropy of the LC phase inside the amorphous oxide matrix, the effective refractive index of the LC microdroplets can be changed relative to that of the oxide matrix. Thus, the material can be switched from an opaque scattering state to a transparent nonscattering state by constructing an electro-optical device and applying an electric field in a similar manner to a parallel-plate capacitor. However, the dielectric layer between the capacitor electrodes is replaced by microcomposite GDLC film, and transparent conductive films [usually indium tin oxide (ITO)] on transparent substrates are used as electrodes.
The electro-optical quality (the difference between the scattering intensity with and without the applied electric field) is mainly determined by the film thickness, the LC droplet size distribution, and the magnitude of the mismatch between the refractive index of the matrix and the ordinary refractive index of the LC at a given wave length. There are no reports from which reliable conclusions can be drawn about the optical properties of the GDLC films (in the sense of the adjustment of the refractive index of the matrix to match the ordinary refractive index of the LC). Although an increase in the refractive index was achieved by Chang et al.Reference Chang, Whang and Wong18 using titanium ethoxide as one of the precursors in the preparation of the sol and preparing the films under low humidity conditions in a glove box, the contrast ratios of the films (the ratio of ON-state transmittance to the OFF-state transmittance) are given without the corresponding collection angle. However, it is known that an arbitrarily high contrast ratio can be measured for almost any LC dispersion film by the choice of collection angle alone.Reference Drzaic19 The collection angle provides a criterion for discerning transmitted and scattered light. For example, a collection angle of ±2° means that light scattered less than 2° from the direction of incidence is detected as transmitted light. The lack of descriptions of the collection optics in the transmittance measurements in the majority of other works in the GDLC field makes it difficult to compare different results. Additionally, monochromatic He–Ne lasers have been used for optical characterization by Chang et al.Reference Chang, Whang and Wong18 and other authors in the field.Reference Zayat and Levy7 Because the scattering efficiency of a LC dispersion is wave length dependent,Reference Drzaic19 it is clear that the measurement of transmittance at a single wave length can only yield limited and inconclusive information about the properties and performance of the film. For the use of these films as variable transmittance windows, it is important that they obscure the image behind the film. In a condition where strong scattering exists at certain wave lengths, but some wave lengths pass through almost unscattered, the image behind the film is not obscured effectivelyReference Drzaic19; consequently, the film has no or little importance in terms of practical applications. Therefore, the purpose of this work was to investigate the field-dependent scattering behavior of a refractive index-matched GDLC film over a broad spectral (from visible to near-IR) and temperature range. This study also proposes a method to characterize the electro-optical quality of GDLC films based on the measurement of changes in their transmittance over a wide spectral range and to provide a necessary basis for the future development of GDLC materials in terms of their optical characterization. Although a novel synthesis process is described in the context of GDLC preparation, it is not the focus of this paper. A description of the chemical aspects of GDLC preparation is necessary for the thoroughness of the discussion and to provide an understanding of the origin of the material’s optical properties.
II. EXPERIMENTAL
A. Preparation of films
The sol-gel method was used for film preparation. The precursor sol synthesis was carried out in two parts. Part A consisted of the classical hydrolytic sol-gel process with an acid catalyst: Tetraethoxysilane (≥99%; Aldrich, St. Louis, MO), methyltriethoxysilane (Me-TES, 99%; Aldrich), and isopropyl alcohol (≥99.5%; Sigma-Aldrich, St. Louis, MO) were mixed in a given order at room temperature in molar ratios of 0.55:0.3:0.4. A 0.343 M HNO3 aqueous solution was prepared from 70% HNO3 (Aldrich) and added dropwise to the silane–alcohol mixture on a magnetic stirrer to yield R (H2O/alkoxide molar ratio) = 1.45. Part B: acetylacetone (≥99%; Sigma-Aldrich) was added dropwise to titanium isopropoxide (≥97%; Aldrich) on a magnetic stirrer at room temperature in a 1:1 molar ratio to obtain Ti-acetylacetonate. Part A and part B were allowed to react separately for 2 h and then mixed. Because of the significantly higher hydrolysis and polycondensation rates of titanium alkoxides compared to silicon alkoxides,Reference Schubert20 acetylacetone is commonly used as chelating agent to reduce the reaction rates of titanium alkoxides.Reference Schwartz, Voigt, Tuttle, Payne, Reichert and DaSalla21, Reference Hung, Hsieh, Yang and Tsai22 If the difference in the reaction rates of the precursor compounds is not adequately addressed, macroscopic phase separation is hindered by rapid gelation and will probably also accompany an inhomogeneous distribution of titanium inside the film as a result of the homocondensation of the titanium compounds.Reference Ren, Li, Liu, Xing and Xie23 The use of trialkoxy(alkyl)silane (in this case, Me-TES) serves mainly two purposes in the context of this work. First, the hydrolytically stable hydrophobic alkyl groups promote phase separation against highly polar solventReference Nakanishi14; and second, the alkyl groups reduce the surface anchoring forces on pore surfaces.Reference Zayat and Levy7 Different functional organic groups also influence the LC droplet size distribution,Reference Zayat and Levy7 but as for effective scattering in visible range, the maximum of the droplet size distribution is required to be located at a certain droplet diameter value; it is not necessary to achieve very narrow droplet size distribution. Different trialkoxy(alkyl)silanes can be potentially used instead of Me-TES.
The LC–xerogel composite films were prepared by mixing parts A and B to obtain a Ti/Si atomic ratio of 0.2, similar to the work of Chang et al.Reference Chang, Whang and Wong18 The optimal Ti/Si ratio in terms of refractive index may be slightly different though. But from the fact that this ratio enables to achieve transmittances over 90% in thick film as is shown below, it is evident that this ratio is close to optimal and is sufficient in the context of this study. It must be taken into account that in the case the shape of the dispersion curves of the matrix and corresponding dispersion curve of the LC does not match, the different Ti/Si ratio may only shift the wave length at which dispersion curves coincide, and this may not result in the significant overall improvement of electro-optical properties in wide spectral range. The modification (e.g., by preparing different mixed oxide matrixes) of dispersion curve of the matrix may yield very interesting results in terms of scattering properties of the film and will be the subject of further study.
The mixture of parts A and B was homogeneous and clear, with a yellowish color because of the Ti-acetylacetonate. The sol was stirred for 15 min after mixing parts A and B; it was then filtered with a 0.45-μm cellulose acetate syringe filter (Advantec Dismic-25cs, Advantec Toyo Kaisha Ltd., Saijo, Japan) to remove possible dust particles and mixed with a highly polar solvent, 4-cyano-4′-pentylbiphenyl (99%, Pichemicals, Shanghai, China) (commercially known as LC 5CB) in a 10:1 volume ratio. 5CB has a dipole moment of 4.87 D,Reference Nath, Mandal, Paul and Chaudhury24 ensuring phase separation during the postdeposition solvent evaporation, polycondensation, and the corresponding gelling. Isopropyl alcohol has a dipole moment of only 1.560 D, which is insufficient to take part in phase separation. After mixing with 5CB, the films were prepared by spin coating at 1700 rpm on ITO-coated glass substrates (15 Ω/sq; Kintec, Shenzhen, China), which had been previously washed with methanol (≥99.8%; Sigma-Aldrich) in an ultrasonic bath. Films were transferred into hermetically sealed containers after spin coating and aged for 4 days, followed by 2 days of aging in an ambient atmosphere and heating at 50 °C for 10 h. The top electrode, in the form of ITO-coated glass identical to the substrate, was pressed on top of the film with freshly mixed Epotek 310M resin (Epoxytechnology Inc., Billerica, MA) between the film and the top electrode, creating a layered device similar to a parallel-plate capacitor. The requirement for the resin layer was thoroughly discussed in our previous paper.Reference Timusk, Järvekülg, Lõhmus, Kink and Saal25
B. Characterization
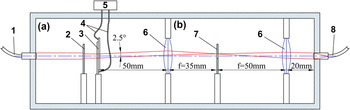
A measurement chamber was designed with an optical setup that enables transmittance measurements in a controllable temperature environment. The measurement is made at a ±2.5° collection angle in a wave length range from 350 to 1100 nm in 0.477-nm increment, using a collimated beam 3 mm in diameter. This complicated setup consisting of lenses, diaphragms, and suitable optical cables is required because the transmittance cannot be correctly measured by a simple setup containing a laser light source and a photodetector placed at a certain distance from the film to obtain a certain collection angle, even if a monochromatic light source is used. From a purely geometrical perspective, it would be possible to use this simple configuration only in the case of an infinitely narrow beam diameter. Because the LC droplet diameters are usually in the order of 1 μm, and the light scattering intensity angular dependence arises statistically from random refractions at the matrix–LC droplet boundary caused by the change in the effective refractive index, the beam diameter must be much larger than the droplet diameter, on the order of a millimeter. For this reason, to achieve the desired collection angle with a wide beam diameter, the more complicated setup is required for the transmittance measurements. The setup that was used for transmittance measurement is schematically shown in Fig. 1.
Schematic representation of the setup used for transmittance measurement at ±2.5° collection angle. 1—optical fiber connecting white light source and collimator lens via SMA 905 connector, 2—diaphragm Ø 3 mm, 3—GDLC sandwich structure (see also Fig. 2), 4—wires through which the voltage is applied to the sample, 5—AC voltage generator, 6—high quality optical lenses, 7—diaphragm Ø 3.056 mm, and 8—optical cable with 600 μm core diameter, connecting spectrometer and collimator lens via SMA 905 connectors.

The transmittance measurement was performed using a white light source (Ocean Optics LS-1 with 10000 h bulb, Ocean Optics Inc., Dunedin, FL) and a spectrometer (Ocean Optics HR2000 + ES). The reference spectrum, which is necessary for the calculation of the transmittance, was averaged from 10 measurements that were acquired using two ITO substrates sandwiched together with Epotek 310M resin to obtain a similar layered structure to the GDLC device, except for the presence of the GDLC film. Then, the transmission spectrum of the GDLC device was measured by applying a square wave (100 Hz AC voltage from 1 to 95 Vrms with 1 Vrms increment generated by a Metrix mtx3240 signal generator, Metrix, Paris, France) to the film through a voltage amplifier. A 1-s queue time was set between the gradual increase of the voltage and spectrum acquisition to ensure sufficient response time for the LCs. The voltage on the ITO electrodes was measured with an Agilent 34410A multimeter (Agilent Technologies Inc., Santa Clara, CA). At each voltage value, the spectrum was measured 10 times and averaged. The operation of all devices was synchronously controlled by a PC. The transmittance, T, was calculated as the ratio of the film transmission intensities to the reference transmission intensities at the corresponding wave lengths. The measurement procedure was repeated at 27 different temperatures, between −13 and 33 °C. From these measurements, the transmittance versus the applied voltage at 1572 different wave lengths from 350 to 1100 nm was obtained at 27 different temperatures. From this data set, several relations were found: (i) the evolution of the transmittance T versus applied voltage U at 550 nm wave length with increasing temperature, (ii) the evolution of the change in transmittance  versus wave length (λ) with increasing temperature, (iii) the maxima of the ΔT versus λ graph versus temperature, (iv) the area under the ΔT versus λ curve in the visible range versus temperature, (v) the ΔT versus λ graph evolution with increasing voltage (measured at a temperature of 25.2 °C), and (vi) the area under the ΔT versus λ curve in the visible range versus applied voltage (measured at a temperature of 25.2 °C for the reason discussed below).
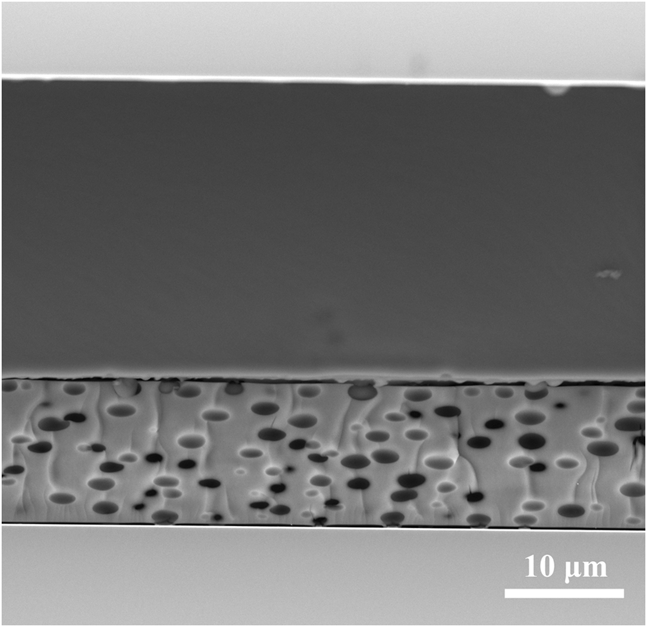
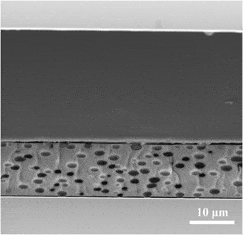
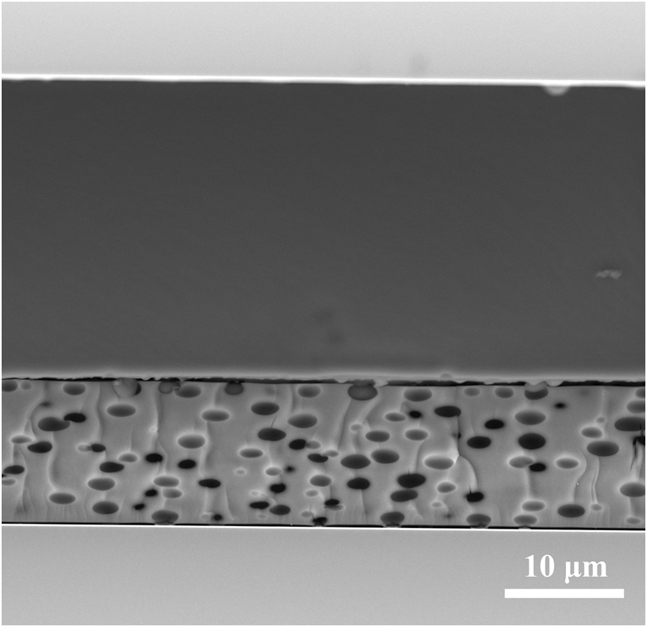
The thicknesses of the GDLC and resin layers between the ITO electrodes were measured with a Tescan Vega scanning electron microscope (Tescan USA Inc., Cranberry Township, PA) after the device was broken in half along lines scraped with a diamond tip to reveal the cross section (Fig. 2), washed in methanol, and dried in a N2 gas flow.
Scanning electron microscope (SEM) micrograph of cross section of the electro-optical device consisting of layers (from bottom up) of glass, ITO, GDLC film, resin, ITO, and glass.
III. RESULTS AND DISCUSSION
A. Film morphology
The thickness of the prepared film was 11.98 μm. Together with the layer of resin on top of the film, the total thickness of the layers between the ITO electrodes was 37.77 μm. In addition to the precise thickness measurement, imaging of the film cross section also revealed the true shape of the LC droplets, which appear to be spherical in optical microscope images taken perpendicular to the film surface. The cross-sectional image (Fig. 2) reveals that the droplets are actually oblate spheroids in shape, with an average aspect ratio (ratio of the minor to major axis length) of 0.476. The shape deviation from oblate spheroid only occurs in close proximity to another droplet or near the film boundaries. The geometry of the droplets arises from their initial spherical shape after right phase separation as they change shape due to shrinkage during drying as the isopropyl and ethyl alcohols evaporate. The deformability of the liquid phase prevents stress buildup, which explains why relatively thick films are obtained without cracking or pulverization. This phenomenon was also observed by Imhof and Pine,Reference Imhof and Pine11 who prepared macroporous sol-gel materials by emulsion templating. High thickness is a necessary requirement for effective scattering in the field-off state.
B. Electro-optical properties
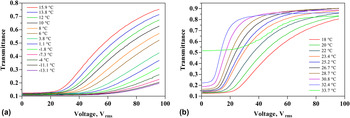
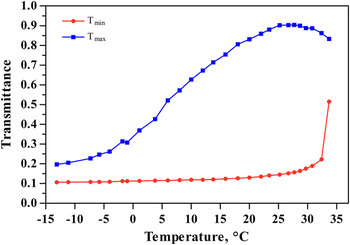
When no electric field is applied, the LCs inside the droplets exhibit a complex director field configuration that is determined by the droplet shape, surface anchoring, and temperature.Reference Castellon, Zayat and Levy26 Due to the confined geometry, splay, twist, and/or bend deformations arise in LC with corresponding characteristic elastic constants that decrease with increasing temperature.Reference Kumar27 The director field configuration arises as an equilibrium condition between elastic forces and the forces on the orienting boundary. As an AC voltage is applied to the ITO electrodes, a homogeneous alternating electric field is induced inside the resin and GDLC layers. In a sufficiently strong electric field, the LC molecules tend to align parallel to the field, owing to positive dielectric anisotropy of the 5CB molecules, decreasing the effective refractive index relative to the xerogel matrix and reducing scattering (increasing transmittance). Figure 3 shows the evolution of the dependence of the transmittance on the applied voltage at λ = 550 nm with increasing temperature. The data set is presented in two parts for better clarity: Fig. 3(a) shows the dependence of the transmittance on the applied voltage in the temperature range from −13.1 to 15.9 °C, and Fig. 3(b) shows the temperature range from 18 to 33.7 °C. Several observations can be made from Fig. 3. Notably, the operating voltage increases significantly with decreasing temperature. The transmittance saturation plateau, for which increasing voltage does not induce an increase of the transmittance, is reached only at approximately 29 °C. It can also be observed that both T min and T max increase with increasing temperature, up to a temperature of approximately 25.2 °C, at which T min continues to increase with increasing temperature but T max begins to decrease. T min and T max as functions of temperature are presented in Fig. 4. It can be deduced that  as the temperature approaches the nematic–isotropic transition temperature of 35.3 °C. It can also be observed that a strong electro-optical effects exists well below the nematic range of 22.5–35.3 °C,Reference Ren, Li, Liu, Xing and Xie23 at least down to −13 °C. This supercooling effect is known to occur inside small pores due to disordering influence of pore surface and random pore structure, inducing glass formation rather than crystallization far below nematic crystal bulk phase transition temperature.Reference Boussoualem, Roussel and Ismaili28, Reference Aliev29 This is an important property for the practical applications where 5CB is used as a pure compound instead of a eutectic mixture of different LCs.
Evolution of the transmittance dependence on the applied voltage at λ = 550 nm with increasing temperature (a) from −13.1 to 15.9 °C and (b) from 18 to 33.7 °C.

T min and T max as functions of temperature at λ = 550 nm.

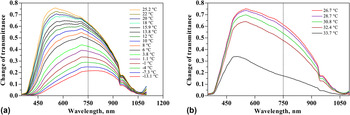
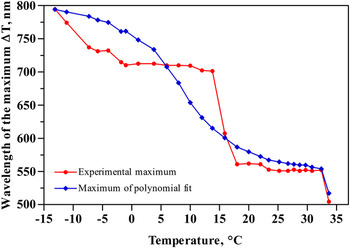
As the change of transmittance ΔT is plotted against wave length (Fig. 5), it can be observed that the change in the transmittance is strongly wave length dependent, and a curve with a distinct maximum evolves with increasing temperature in a complicated way. For this reason, measuring the transmittance at a single arbitrary wave length yields inconclusive information about the scattering properties of the film. In this graph, each point on the curve represents a datum contained in the transmittance versus applied voltage curve in the form of the T min and T max values at a certain wave length. At low temperatures, a large change in transmittance occurs in the IR region, while ΔT is relatively small in the middle of the visible range. As the temperature increases, the maximum of the curve moves progressively toward shorter wave lengths, and ΔT achieves a maximum value of 75.9% at 25.2 °C and 551 nm. As the temperature increases further [Fig. 5(b)], ΔT begins to decrease, while the maximum of the curve continues to move toward shorter wave lengths. Figure 6 shows the wave length of the maximum ΔT versus λ as a function of the temperature, represented in two different ways: as experimental maxima and as a maxima of the 8th degree polynomial curve, found by the standard method of least squares fitting to the experimental data points. The latter provides a better description of the location of the maxima of the curve while avoiding the local deviations.
Change of transmittance ΔT versus wave length λ evolution with increasing temperature, (a) from −13.1 to 25.2 °C and (b) from 26.7 to 33.7 °C.

Wave length of the maximum of ΔT versus λ curve as a function of temperature.

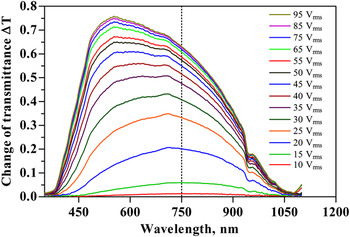
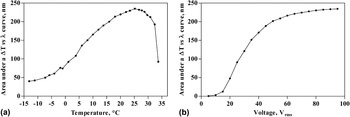
Similarly to Fig. 5, the maximum of ΔT versus λ shifts toward shorter wave lengths during the evolution with increasing voltage (at a temperature 25.2 °C) (Fig. 7). At low voltages, the strongest electro-optical effect occurs at the visible–IR boundary, and it gradually moves toward the middle of the visible range as the voltage is increased to 95 Vrms, for which ΔT achieves its maximum (75.9%) at 551 nm. It can be concluded from Figs. 5 and 7 that the main effect of the increasing temperature is a decrease in the operating voltage. The shift of the maximum toward shorter wave lengths with increasing voltage could have several possible explanations. It is possible that in larger droplets, which are responsible for effective scattering at longer wave lengths, the change in the LC effective refractive index is induced at lower voltages (i.e., the LC molecules tend to align parallel to the electric field in weaker electric fields). Thus, larger droplets may not contribute significantly to the further increase of the transmittance as voltage is increased. It is also possible that several director field configurations occur as electric field is gradually increased. This is evident under a polarized optical microscope as changes in a droplet are observable over a wide applied voltage range, indicating the rearrangement of director field from the initial configuration. Regardless of the cause, it can be said that the increasing voltage decreases the scattering cross section. To better compare the change of the ΔT versus λ graph with increasing temperature (Fig. 5) and increasing voltage (at a constant temperature of 25.2 °C, Fig. 7), the area S under the ΔT versus λ curve in the visible range is plotted as a function of temperature and voltage in Fig. 8(a) and 8(b), respectively. These two graphs illustrate the quality of the GDLC electro-optical device in the full visible spectrum because they are generalizations of the transmittance versus applied voltage curves, which are usually specified at one wave length. The shape of the curve in Fig. 8(b) resembles that of the T versus U curve at constant wave length. The theoretical maximum for the area S under a ΔT versus λ curve in the visible range is 400, in which case a 100% change in the transmittance occurs at all wave lengths in the visible range. From Fig. 8(a), it can be observed that largest area (S = 234.89 nm, 58.72% of the theoretical maximum) is experimentally achieved at a temperature of 25.2 °C. Additionally, ΔT max occurred at the same temperature (Fig. 4); consequently, there is a good correlation between the area under a ΔT versus λ curve and height of the curve. A prerequisite to approaching the theoretical maximum is the exact matching of the dispersion curve of the matrix with the dispersion curve of the ordinary refractive index of the LC.
ΔT versus λ evolution with increasing voltage at temperature 25.2 °C.

Area S under a ΔT versus λ curve in visible range as a function of (a) temperature and (b) voltage.

IV. CONCLUSION
A high-performance xerogel–LC composite electro-optical film that exhibits a 75.9 % change in its transmittance as an electric field is applied was prepared. The electro-optical properties of the film were investigated over wide wave length and temperature ranges. The largest electro-optical effect was observed at 25.2 °C, and electro-optical effects persisted down to at least −13 °C, indicating a significant 35.5 °C reduction from the solid-nematic phase transition temperature in the macroscopic volume. The area under the ΔT versus λ curve in the visible range as a function of the temperature and/or voltage was found to provide a generalized description of the electro-optical quality of the GDLC films. The prepared film presented in this paper possessed 58.72% of the theoretical maximum area under a ΔT versus λ curve.
ACKNOWLEDGMENTS
This work was supported by the Estonian Science Foundation Grants No. 8428 and 8420, by the European Eurocores project “Nanoparma” and by the EU Regional Development Fund, Centre of Excellence “Mesosystems: Theory and Applications” (TK114). This work has been partially supported by graduate school “Functional materials and processes” receiving funding from the European Social Fund under project 1.2.0401.09-0079 in Estonia.