Introduction
Cauliflower (and broccoli) is a significant member of the Cole vegetable family and is cultivated across the globe on an area of 1.39 million hectares, resulting in an output of 25.98 million metric tonnes (FAOSTAT, 2022). China and India are two of the largest contributors to global production. The spread of cauliflower in tropical regions, including India, was mainly driven by the evolution of tropical-type cauliflower (Singh et al., Reference Singh, Kalia, Parkash, Kumar, Sharma and Saha2022). A diverse set of germplasm in tropical cauliflower has been developed during the past 200 years in Indian conditions (Singh and Kalia, Reference Singh, Kalia, Al-Khayri, Jain and Johnson2021). The tropical cauliflower is morphologically and genetically distinct from the European types (Swarup and Chatterjee, Reference Swarup and Chatterjee1972; Rakshita et al., Reference Rakshita, Singh, Verma, Sharma, Saini, Iquebal, Sharma, Dey and Behera2021). This group also exhibits tolerance against heat (>25 °C) and heavy rains as compared to the European cauliflower during vegetative and curding stages (Swarup and Chatterjee, Reference Swarup and Chatterjee1972). These groups differ for the genomic regions that regulate the key developmental processes (Mangal and Singh, Reference Mangal and Singh2023; Luhana et al., Reference Luhana, Singh, Mangal, Verma, Varotariya and Khar2023). The variation in flavour and taste also indicates a difference in glucosinolate (GSL) profiles in Indian cauliflower from European types (Swarup and Chatterjee, Reference Swarup and Chatterjee1972).
The GSLs are the important specialised secondary metabolites in Brassica vegetables. The breakdown products of GSLs such as sulforaphane, phenethyl isothiocyanate, indole-3-carbinol and 3,3-diindolylmethane act as powerful antioxidants and anti-tumour agents and also play role in the regulation of critical genes involved in the cell cycle, metastasis and programmed cell death (Agerbrick et al., Reference Agerbrick, de Vos, Kim and Jander2009; Park et al., Reference Park, Sun, Lim, Tam, Dekker, Chen and Sze2017; Connolly et al., Reference Connolly, Sim, Travica, Marx, Beasy, Lynch, Bondonno, Lewis, Hodgson and Blekkenhorst2021). Sinigrin breaks down into allyl isothiocyanates and glucoerucin into erucin, which are known to have cancer-protective potential (Abbaoui et al., Reference Abbaoui, Riedl, Ralston, Thomas-Ahner, Schwartz, Clinton and Mortazavi2012). GSLs have shown potential in combating colorectal cancer and other forms of tumours (Pappa et al., Reference Pappa, Lichtenberg, Iori, Barillari, Bartsch and Gerhäuser2006; Melim et al., Reference Melim, Lauro, Pires, Oliveira and Cabral2022). In addition, they have antibacterial, antifungal, antiproliferative, anti-inflammatory and cytoprotective properties (Mithen et al., Reference Mithen, Faulkner, Magrath, Rose, Williamson and Marquez2003; Jie et al., Reference Jie, Cheung, Yu, Zhou, Tong and Ho2014; Sikorska-Zimny and Beneduce, Reference Sikorska-Zimny and Beneduce2021). Around 130 types of GSLs have been documented in different plants (Wu et al., Reference Wu, Huang, Childs, Wu, Yu and Pehrsson2021), and many of them are good for health except a few. Progoitrin is one such negative GSL because its breakdown product goitrin interferes with iodine uptake and synthesis of thyroid hormone, particularly when its intake is more than 25 mg (or 194 μmol) (Cartea et al., Reference Cartea, Velasco, Obregón, Padilla and de Haro2008; Felker et al., Reference Felker, Bunch and Leung2016). Progoitrin is associated with anti-thyroid effects and meal palatability (Vanderpas, Reference Vanderpas2006; Cartea et al., Reference Cartea, Velasco, Obregón, Padilla and de Haro2008). It also generates bitter or pungent isothiocyanates and influences consumer preference (Schonhof et al., Reference Schonhof, Krumbein and Brückner2004; Wagner et al., Reference Wagner, Terschluesen and Rimbach2013; Bell et al., Reference Bell, Oloyede, Lignou, Wagstaff and Methven2018; Wieczorek et al., Reference Wieczorek, Dunkel, Szwengiel, Czaczyk, Drożdżyńska, Zawirska-Wojtasiak and Jeleń2022). The hydrolysis product of glucoerucin, erucin, is transformed into glucoraphanin, which acts as a precursor to sulforaphane, a recognised GSL having potent anticancer attributes (Li et al., Reference Li, Liu, Li, Fang, Yang, Zhuang, Zhang and Lv2019). Thus, the knowledge of the levels of these GSLs in cauliflower genotypes is a prerequisite for breeding varieties for public health and consumer satisfaction.
The GSLs are significant in host plant interactions with pathogens and insect pests. Lower methoxyglucobrassicin and glucobrassicin ratio (<1.0) resulted in downy mildew resistance, while a higher ratio (>1.5) led to a susceptible reaction in cauliflower. High glucobrassicin in kale and indole GSLs in cabbage are also found to be correlated with black rot resistance (Rubel et al., Reference Rubel, Abuyusuf, Nath, Robin, Jung, Kim, Park and Nou2020). High sinigrin reduces the incidence of Sclerotinia rot in kale (Madloo et al., Reference Madloo, Lema, Francisco and Soengas2017). Further, GSLs deter generalist lepidoptera insects but stimulate specialist insects such as cabbage aphids, diamondback moths and cabbage butterflies (Santolamazza-Carbone et al., Reference Santolamazza-Carbone, Velasco, Soengas and Cartea2014). GSLs have biopesticidal and biofumigation properties (Popova et al., Reference Popova, Dubie and Morra2017). In order to identify appropriate sources to tap their potential in crop health management, it is crucial to assess the GSL content of cauliflower germplasm.
Researchers have reported wide variation in cauliflower genetic resources for GSLs concentration, but the majority of them belong to European cauliflower (Verkerk et al., Reference Verkerk, Tebbenhoff, Dekker, He and Liu2010; Hanschen and Schreiner, Reference Hanschen and Schreiner2017; Vanlalneihi et al., Reference Vanlalneihi, Saha, Kalia, Singh, Saha, Kundu, Singh and Bhowmik2020). This group of cauliflower differs from the Indian tropical cauliflower for morphological traits, curding parameters, temperature requirements, flavour and taste (Singh and Kalia, Reference Singh, Kalia, Al-Khayri, Jain and Johnson2021). The Indian cauliflower contributes nearly 60–70% of India's annual cauliflower production and covers market supply from September to January months (Singh and Kalia, Reference Singh, Kalia, Al-Khayri, Jain and Johnson2021). Despite such an important evolved group of cauliflower, there are few reports on GSLs (Neelavathi et al., Reference Neelavathi, Pal and Shankaraswamy2015; Vanlalneihi et al., Reference Vanlalneihi, Saha, Kalia, Jaiswal, Kundu, Saha, Sirowa and Singh2019, Reference Vanlalneihi, Saha, Kalia, Singh, Saha, Kundu, Singh and Bhowmik2020). Neelavathi et al. (Reference Neelavathi, Pal and Shankaraswamy2015) analysed sinigrin in only two genotypes of Indian cauliflower. These scant studies highlight the need for additional research on other significant GSLs in order to dispel the concerns of its huge customer base and find reliable sources for breeding use.
Further, cauliflower is a thermosensitive crop and categorized into four specific groups as early (20–27 °C), mid-early (16–20 °C), mid-late (12–16 °C) and late or snowball type (10–16 °C) in India. The sowing time of these groups is June–July, August, September and October–November, respectively. These groups are exposed to different temperature regimes during vegetative growth and curd development. Temperature is one of the important factors which affect GSL levels in Brassica crops (Ciska et al., Reference Ciska, Martyniak-Przybyszewska and Kozlowska2000; Verkerk et al., Reference Verkerk, Schreiner, Krumbein, Ciska, Holst, Rowland, De Schrijver, Hansen, Gerhäuser, Mithen and Dekker2009; Ben Ammar et al., Reference Ben Ammar, Arena, Treccarichi, Di Bella, Marghali, Ficcadenti, Lo Scalzo and Branca2023). Di Bella et al. (Reference Di Bella, Toscano, Arena, Moreno, Romano and Branca2021) also highlighted the role of higher temperature in increased levels of GSLs in broccoli. The cauliflower varieties are available for growing at a wider range of temperature (i.e., from 10 to 27 °C) but there was not sufficient information on GSLs. Additionally, for GSL profiles, the earlier researchers only investigated two or three genotypes of cauliflower, which was insufficient for breeding purposes (Kushad et al., Reference Kushad, Brown, Kurilich, Juvik, Klein, Wallig and Jeffery1999; Ciska et al., Reference Ciska, Martyniak-Przybyszewska and Kozlowska2000; Schonhof et al., Reference Schonhof, Krumbein and Brückner2004; Charron et al., Reference Charron, Saxton and Sams2005; Giuffrida et al., Reference Giuffrida, Agnello, Mauro, Ferrante and Leonardi2018).
Further, only sinigrin has been documented in Indian cauliflower (Neelavathi et al., Reference Neelavathi, Pal and Shankaraswamy2015; Vanlalneihi et al., Reference Vanlalneihi, Saha, Kalia, Jaiswal, Kundu, Saha, Sirowa and Singh2019, Reference Vanlalneihi, Saha, Kalia, Singh, Saha, Kundu, Singh and Bhowmik2020), information about progoitrin, a GSL with negative health effects, is especially important. Besides, glucoerucin possesses anticancer and antioxidant properties (Bell et al., Reference Bell, Lignou and Wagstaff2020) and finding high glucoerucin genotypes can contribute in consumer health (Bell et al., Reference Bell, Oloyede, Lignou, Wagstaff and Methven2018). Therefore, it was essential to comprehend the health-related GSLs present in the genotypes of Indian cauliflower that belong to different temperature-based maturity groups. This was also needed to determine which genotype or maturity groups offer the greatest health benefits in terms of favourable GSL profile. Thus, the present study was aimed to analyse GSLs in 37 varieties/genotypes of cauliflower from four temperature-based maturity groups along with the genotypes of broccoli and Sicilian Purple using HPLC.
Materials and methods
Plant materials and growing conditions
The present study used 40 genotypes developed and maintained by the Division of Vegetable Science, ICAR-Indian Agricultural Research Institute, New Delhi. These genotypes consisted of cauliflower (37), broccoli (2) and Sicilian Purple (1). The cauliflower genotypes represented four maturity groups: early (14), mid-early (6), mid-late (15) and late or snowball (2). The study included two broccoli genotypes: ‘Pusa Purple Broccoli-1’ (DPB-1; heading type, sub-tropical flowering, purple head) and ‘PS-1’ (a selection from Palam Samridhi, sprouting type, sub-tropical flowering, green heads). Sicilian Purple ‘PC-1’ (purple curding, sub-tropical flowering) was also included in the study. The specific characteristics of the genotypes are presented in online Supplementary Table S1.
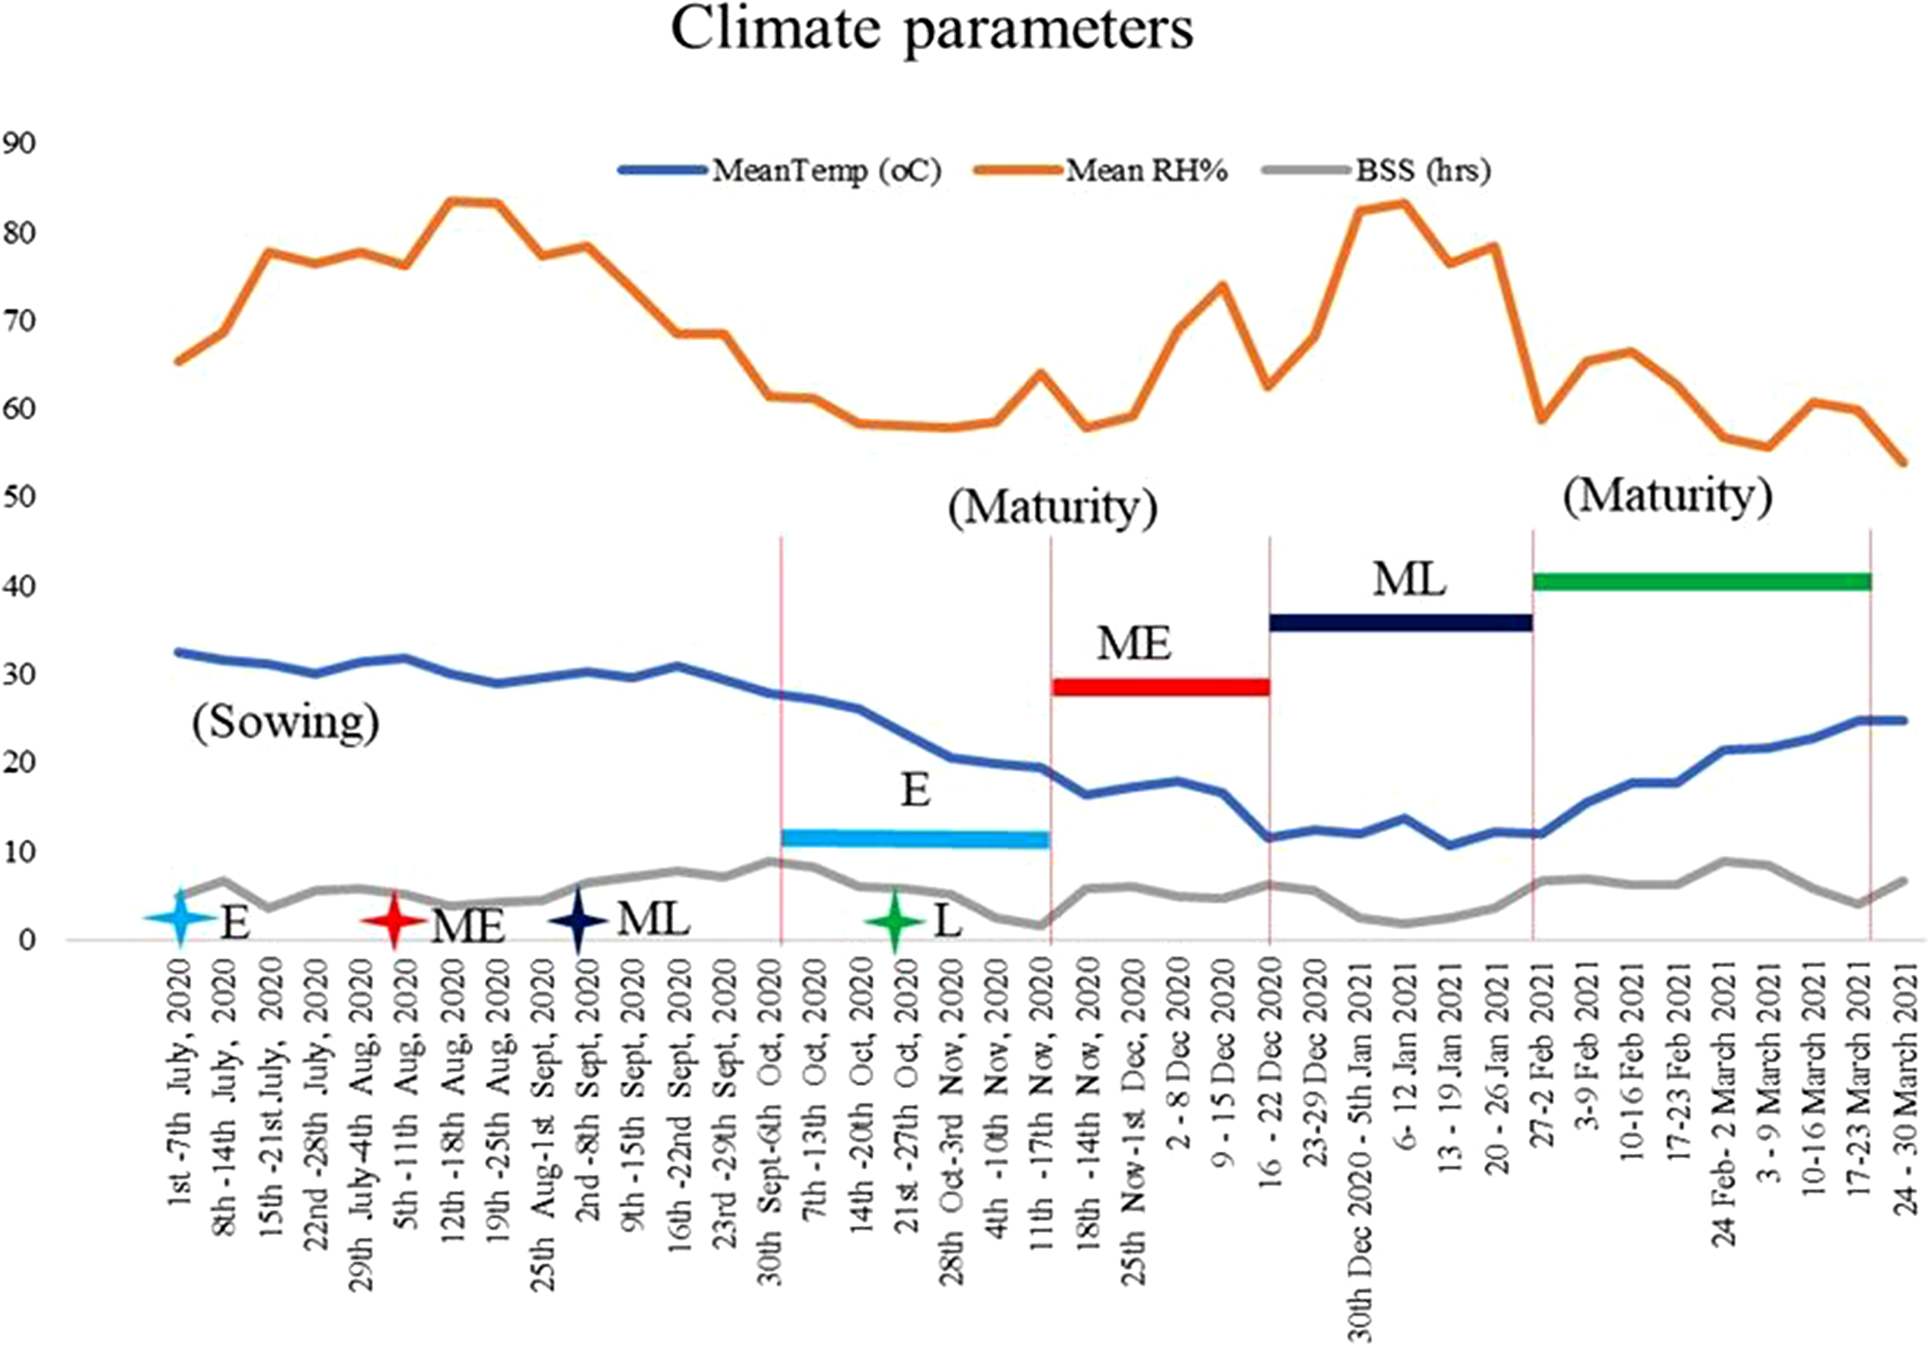
The sowing and transplantation of genotypes were carried out according to the standard practices in 2019 and 2020 (Fig. 1). The environmental conditions during the growing period varied for all four maturity groups in terms of temperature, relative humidity, rainfall and sunlight. The average temperature during the growing season of the early group (end of July to mid-November), mid-early group (mid-September to mid-December), mid-late group (mid-October to mid-January) and late group (November to March) was 30.1–19.83 °C, 29.6–16.6 °C, 27.1–13.6 °C and 20.5–22.8 °C, respectively. During the curd formation of these maturity groups, the average temperature was 25.9, 17.9, 12.0 and 11.9 °C with the corresponding average relative humidity level of 58.3, 69.0, 82.4 and 58.8%, respectively. Intermittent rainfall was noted during the month of December in both years as part of the winter precipitation.
Climate parameters of experimental site and crop activities (Source: Division of Agricultural Physics, ICAR-IARI, New Delhi).

Thirty-day-old seedlings were transplanted on the raised beds (≈15 cm) at a spacing of 60 × 45 cm. Each plot had 30 plants. The trial was conducted in randomized block design with three replications. The standard crop production and protection procedures were followed as outlined by Singh and Sharma (Reference Singh, Sharma, Thamburaj and Singh2001). The crop was applied with well-decomposed farm yard manure (FYM), nitrogen, phosphorus and potash at 25 t, 100 kg, 60 kg and 50 kg per hectare, respectively. Irrigation was given regularly at an interval of 7–10 days to ensure sufficient soil moisture for optimal crop growth.
Sampling and sample preparation
Five random plants were selected from each plot for sampling. Healthy curds at the marketable maturity stage were sampled by cutting 2–3 knobs from fully grown curds using a sharp knife. The samples were promptly wrapped in aluminium foil, immersed in liquid nitrogen and transported to a deep freezer (−80 °C) for storage until further processing. The genotypes represented different maturity groups; hence, the samples were collected as and when they attained the maturity.
The GSL analysis in curd samples was performed as per protocol described by Tsao et al. (Reference Tsao, Peterson and Coats2002) and slightly modified for cauliflower by Vanlalneihi et al. (Reference Vanlalneihi, Saha, Kalia, Jaiswal, Kundu, Saha, Sirowa and Singh2019). In brief, the curd (fresh weight) sample (0.5 g) was extracted separately thrice with 50% (v/v) warm acetonitrile (25 ml) for 10 min using a bath sonicator (PCI Industries Ltd., Mumbai) at 30 kHz frequency. Instead of using 1 g sample size and 100 ml of boiling 50% acetonitrile (v/v) as done by Tsao et al. (Reference Tsao, Peterson and Coats2002). Vanlalneihi et al. (Reference Vanlalneihi, Saha, Kalia, Jaiswal, Kundu, Saha, Sirowa and Singh2019) standardized an extraction technique using 0.5 g sample and 75 ml of warm acetonitrile for better recovery of GSLs. During sonication, the extracts were cooled to room temperature, filtered through a 0.45 μm syringe filter (Gelman Sciences Inc., Ann Arbor, MI) and concentrated to 1.5 ml in a rotary evaporator (Heidolph, Germany) under reduced pressure below 40 °C. The standards of monohydrate sinigrin, progoitrin and glucoerucin were procured from Chroma Dex.
Determination of GSLs in samples was done by reverse phase high-performance liquid chromatography (RP-HPLC) (Waters, Milford, MA, USA). It was having a photodiode array (PDA) detector and fitted with the controller Empower 2® software programme, equipped with an e2695 quaternary pump, an auto injector (20 μl loop) and e2998 PDA detector. RP-18 column (250 mm × 4.6 mm × 5 μm) (Supelco Discovery®) was used as the stationary phase. Standard references sinigrin, progoitrin and glucoerucin (Chroma Dex) were analysed in RP-HPLC with a gradient system at a flow rate of 0.5 ml/min using acetonitrile (ACN): H2O. The system was run with the following gradient programme: 99% A and 1% B (v/v) for 1 min, then linear increases to 50% each A and B in 5 min, held for 5 min, and then brought back to 99% A and 1% B at 20 min. The stock solutions (1000 μg/ml, w/v) of standard references were prepared in HPLC-grade ACN individually and stored at 4 °C. These were diluted to various concentrations (0.1–100 μg/ml) to prepare the calibration curve. Each calibration curve was measured three times, and means and standard deviations were calculated. 20 μl samples were injected using an auto-injector for HPLC analysis. A sharp peak for the reference standards was detected at λmax of 227.5 nm. The retention time (tR) and area of the identified standard references were recorded to calculate concentration. Monohydrate sinigrin, progoitrin and glucoerucin were used as the external standard for HPLC analysis.
Statistical analysis
The combined data from the years 2019 and 2020 were analysed statistically using three independent replication measurements for each sample. To assess the variation between the genotypes, a two-way analysis of variance (ANOVA) was conducted using the ‘doebioresearch’ package in the R software. The standard deviation was computed using Microsoft Excel 2019. The K-means clustering algorithm was executed using the ‘cluster’ tool in the R programme. The appropriate number of clusters was established using the average silhouette width, which was calculated using the ‘factoextra’ program in R software. The ‘Hmisc’ R package was employed for correlation analysis. Correlations that are not statistically significant, as evaluated at a significance level of 5%, have been indicated with a strikeout. The ‘factominer’ package of R software was utilized to implement principal component analysis (PCA).
Results
Total glucosinolates
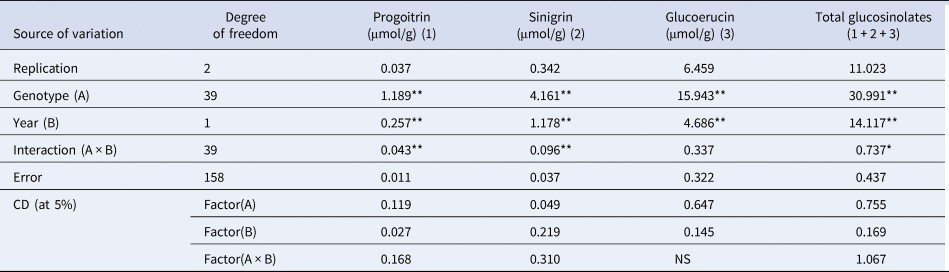
The pooled data analysis from 2 years for glucoerucin, sinigrin and progoitrin showed significant differences among the Indian cauliflower genotypes (Table 1). Significant differences were observed within and between groups for all the detected GSLs (Table 1; online Supplementary Table S2). The HPLC chromatogram and UV spectra of a standard mixture (100 ppm) of sinigrin were detected at a retention time (RT) of 6.816 min with λmax value of 227.5 nm (online Supplementary Fig. S1, S2). There was a significant fluctuation in progoitrin and sinigrin concentration across the 2 years (Table 2) and among the maturity groups (online Supplementary Table S3). Among the commercial varieties, Pusa Sharad (7.773 μmol/g) exhibited the highest values of sum of all three GSLs followed by Pusa Himjyoti (3.841 μmol/g), Pusa Snowball K-1 (2.708 μmol/g), Pusa Shukti (2.627 μmol/g).
Analysis of variance (ANOVA) for the interaction effect of years (2019 and 2020) for glucosinolates in cauliflower

NS-Non-significant at *5% level of significance and **at 1% level of significance; CD-Critical difference.
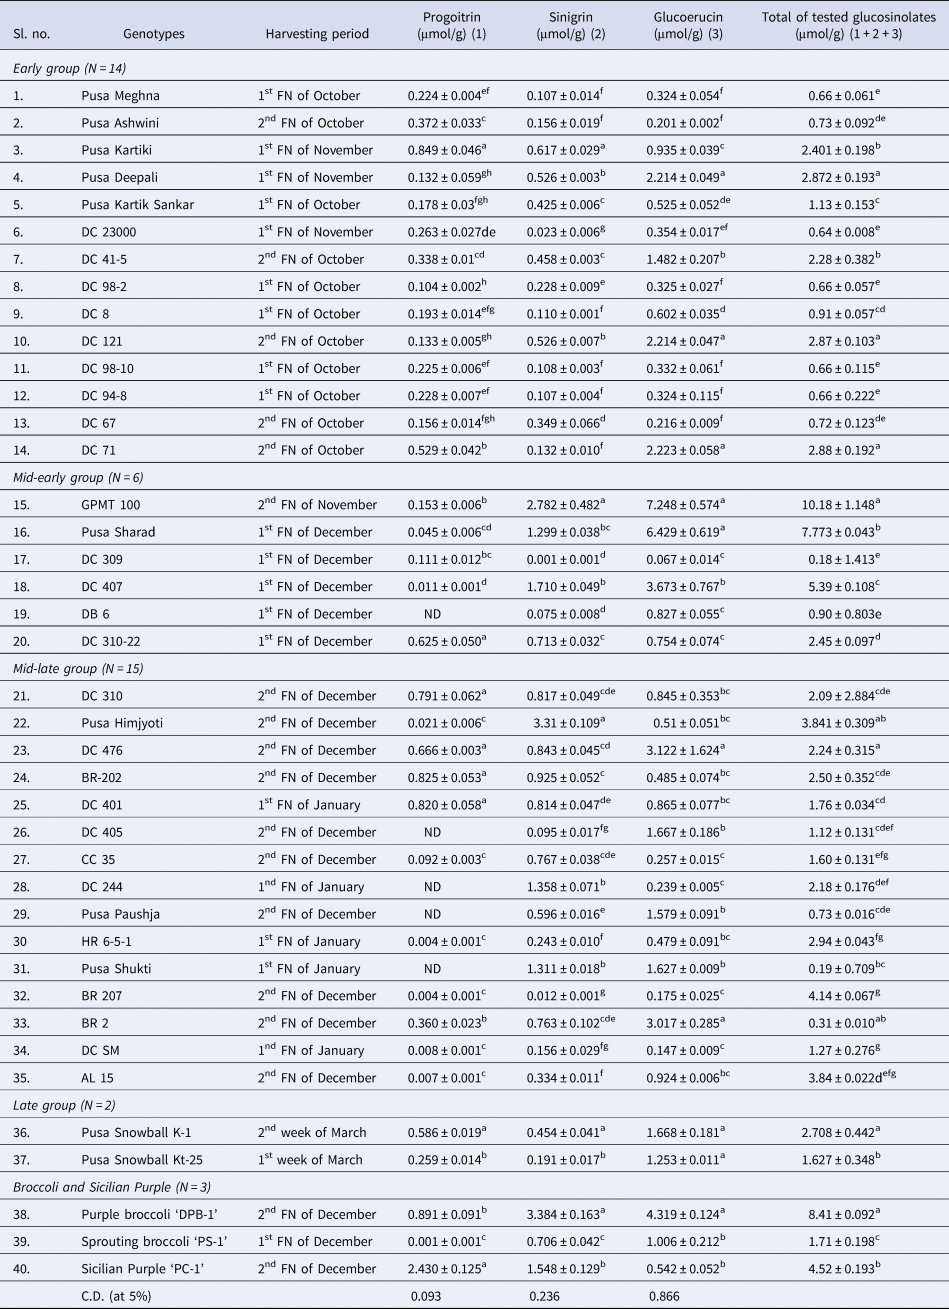
Glucosinolates content in cauliflower (N = 38) and broccoli (N = 2) genotypes from four different maturity groups

ND, not detected; CD, Overall critical difference; Alphabets as superscripts represent least significant difference within the group.
Progoitrin
Significant variation in progoitrin level was detected across and between the groups. The progoitrin ranged from 0.004 to 0.849 μmol/g, with its highest content in Pusa Karitki (Table 2). Among the commercial varieties, Pusa Deepali of the early group, Pusa Sharad of the mid-early group and Pusa Snowball Kt-25 of the late group had the lowest progoitrin content. Progoitrin was not detected in two commercial varieties, Pusa Shukti and Pusa Paushja (mid-late group), and three genotypes, namely DB-6, DC 405 and DC 244.
Sinigrin
The maximum variation for sinigrin (0.012–3.31 μmol/g) was found in the mid-late group, followed by the mid-early group (0.001–2.782 μmol/g). GPMT-100 (2.782 μmol/g), Pusa Himjyoti (1.311 μmol/g) and Pusa Snowball K-1 (0.454 μmol/g) had the highest sinigrin concentration in mid-early, mid-late and late groups, respectively. Among the commercial varieties, sinigrin was the highest in the Pusa Kartiki (0.617 μmol/g), followed by Pusa Deepali (0.526 μmol/g).
Glucoerucin
Overall, the glucoerucin content ranged from 0.067 μmol/g (in DC 309) to 7.248 μmol/g (in GPMT 100). Glucoerucin content in the early group ranged from 0.201 to 2.223 μmol/g. It was highest in Pusa Deepali, followed by DC 71, DC 121 and DC 41-5 while lowest in Pusa Ashwini (Table 2). In the mid-early group, GPMT 100 had the highest glucoerucin content, followed by Pusa Sharad. DC 476 of the mid-late group and Pusa Snowball K-1 (1.668 μmol/g) of the late group were the top genotypes for glucoerucin content in the respective maturity groups.
GSLs in Sicilian purple and broccoli
Sicilian purple genotype ‘PC-1’ had significantly higher progoitrin than both genotypes of broccoli (Table 2). However, sinigrin and glucoerucin were significantly higher in purple broccoli ‘DPB-1’ (3.384 μmol/g) than ‘PC-1’ and ‘PS-1’ (Fig. 2).
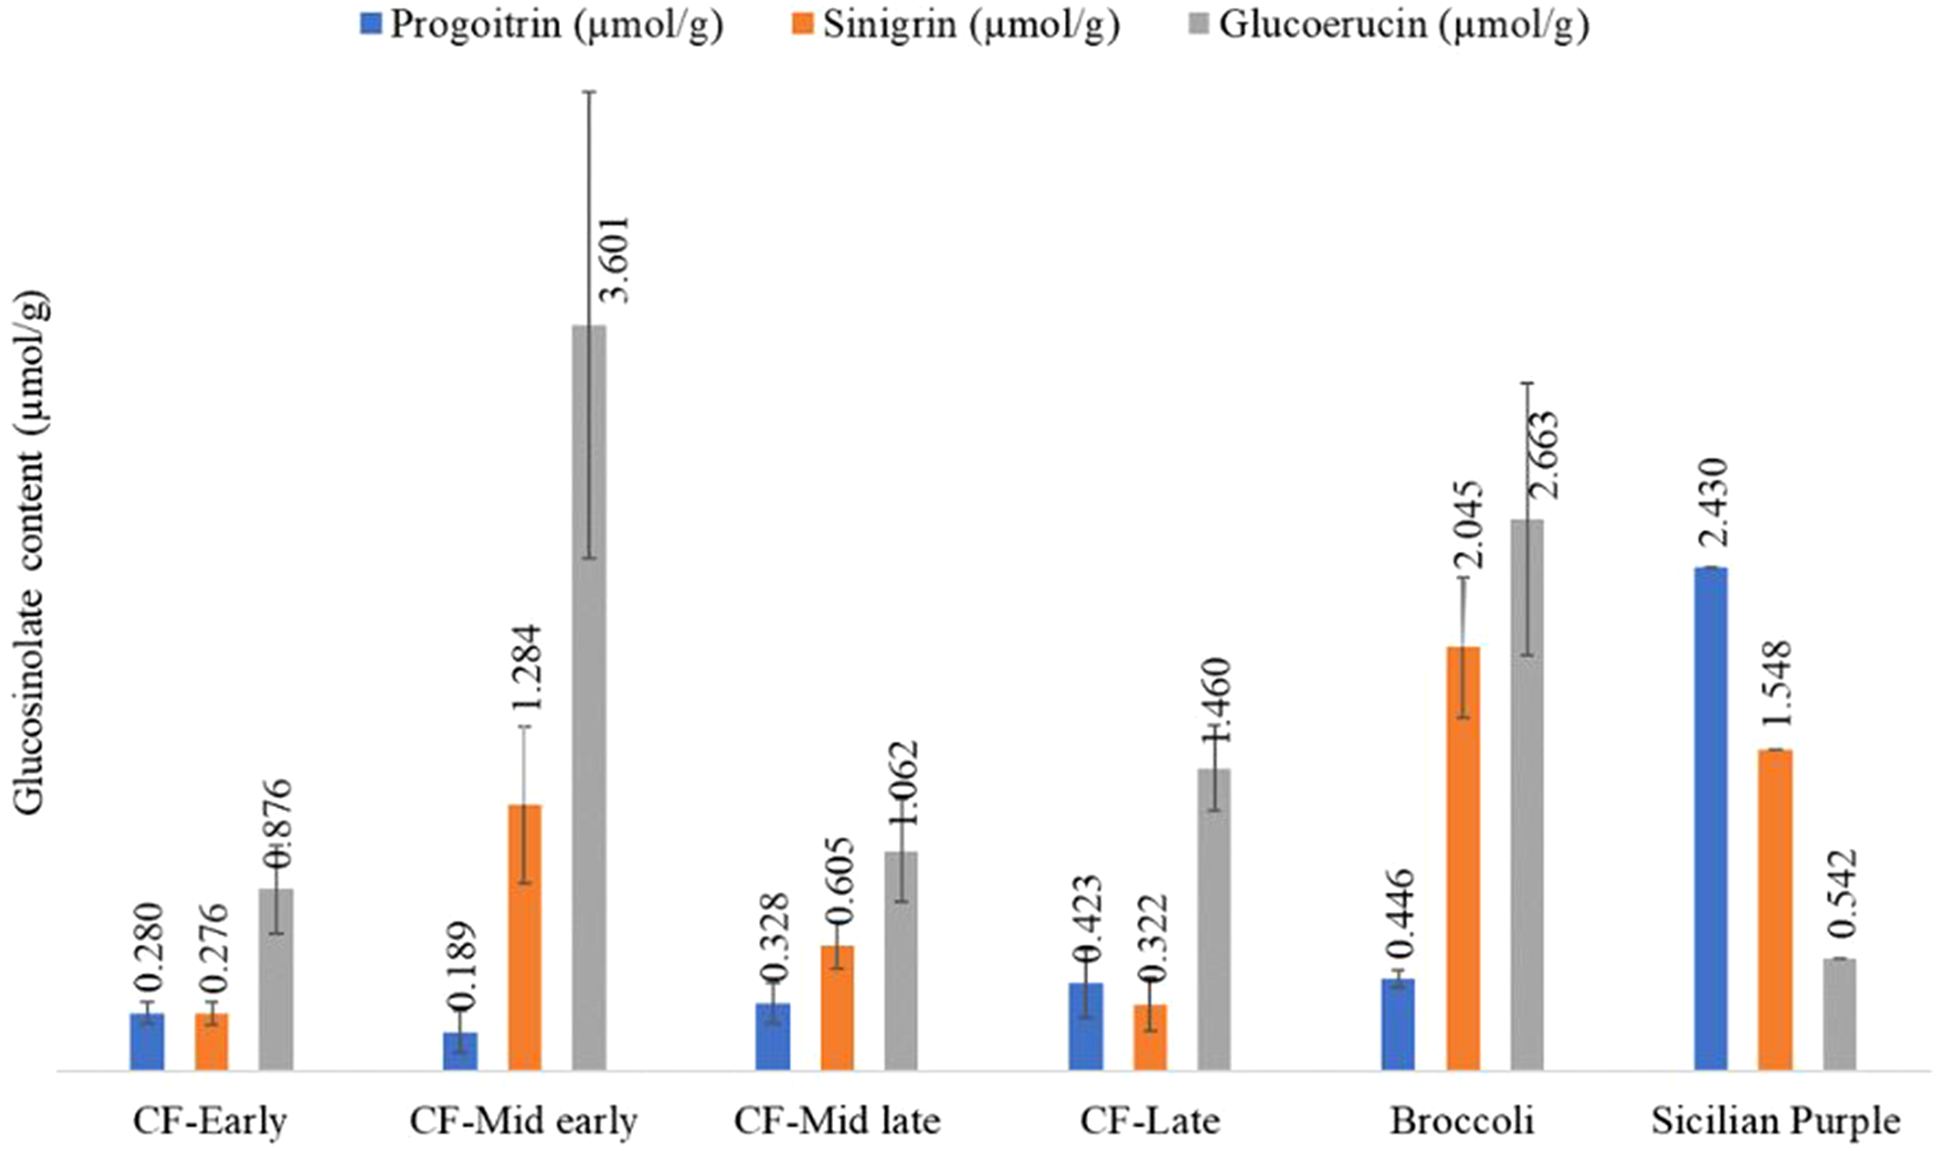
Glucosinolates content in different maturity groups of Indian Cauliflower.

Influence of maturity period
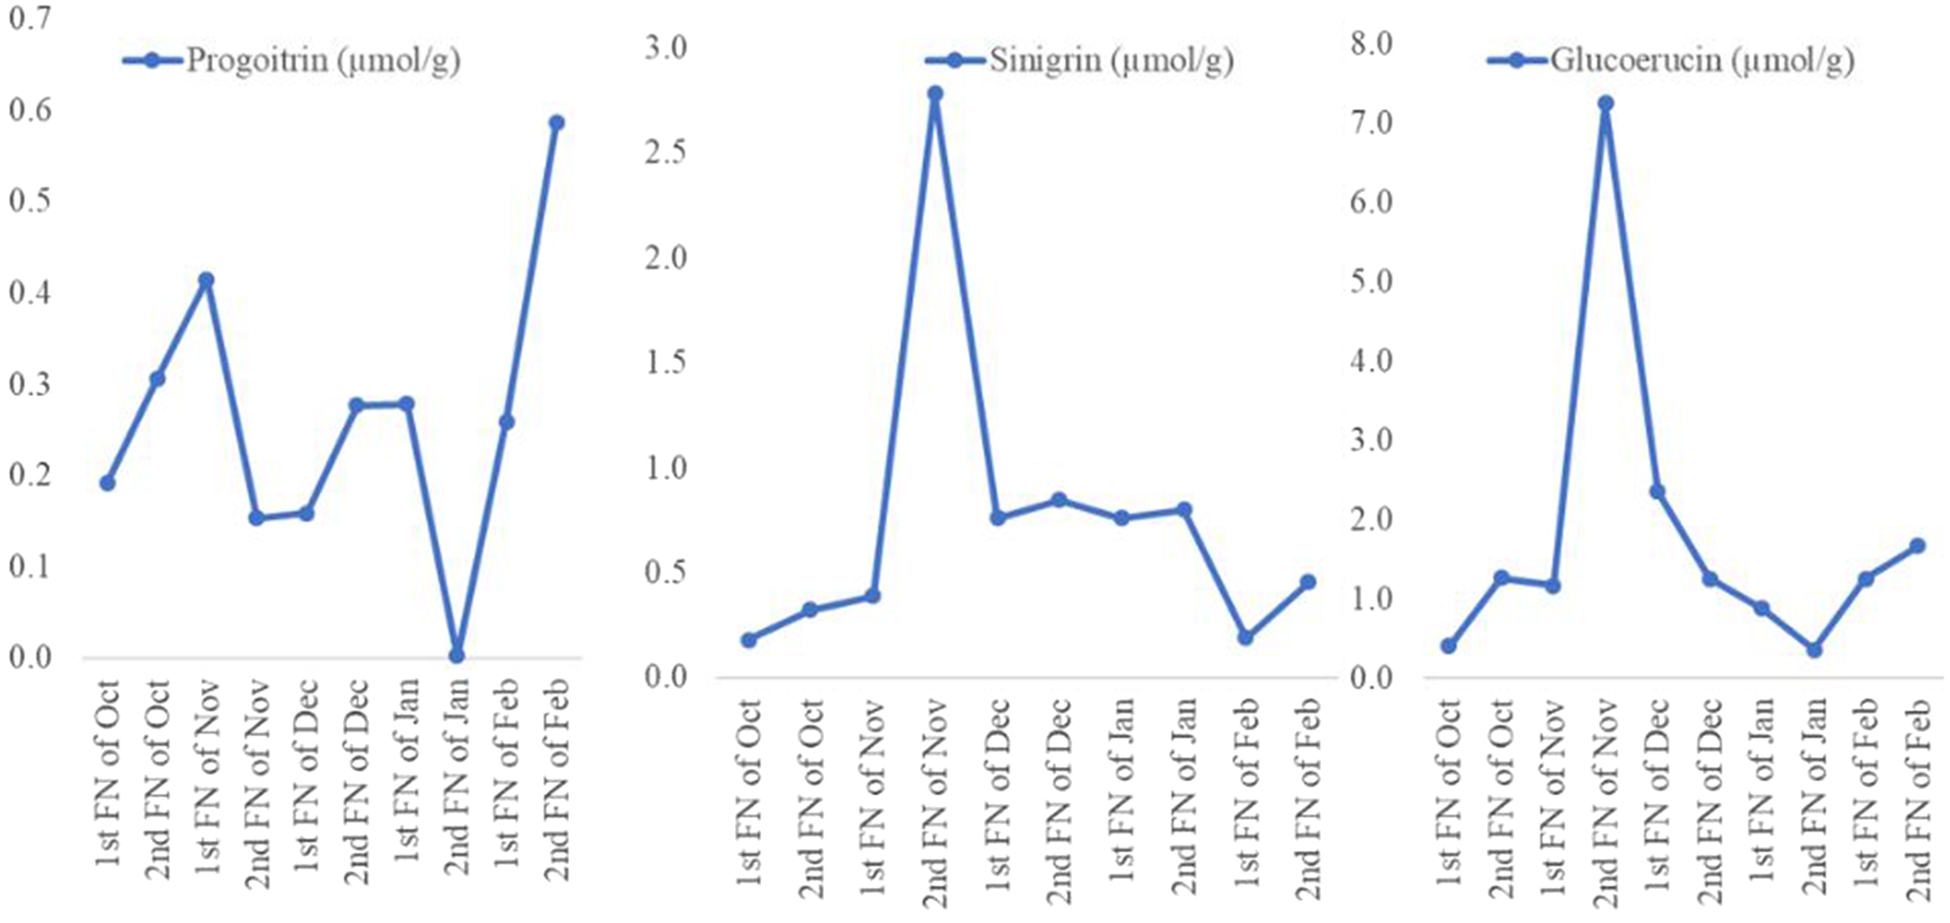
The four maturity groups of cauliflower encountered different temperature regimes during their vegetative growth and curd formation (Fig. 1). The groups showed significant differences in GSLs. Progoitrin was minimum in the mid-early group (0.189 μmol/g) while maximum in the late group (0.423 μmol/g). The mid-early group had maximum sinigrin (1.284 μmol/g) and glucoerucin (3.601 μmol/g). Glucoerucin analysis revealed a descending order of maturity groups as: mid-early>late>mid-late>early. Progoitrin was high in February harvesting genotypes, while sinigrin and glucoerucin were prominent in the November maturing genotypes (Fig. 3). The progoitrin was lowest in genotypes matured in 2nd fortnight of January.
Glucosinolates content in the curd portion of cauliflower genotypes at the maturity stage at different time points.

Principal component analysis (PCA) and correlation analysis
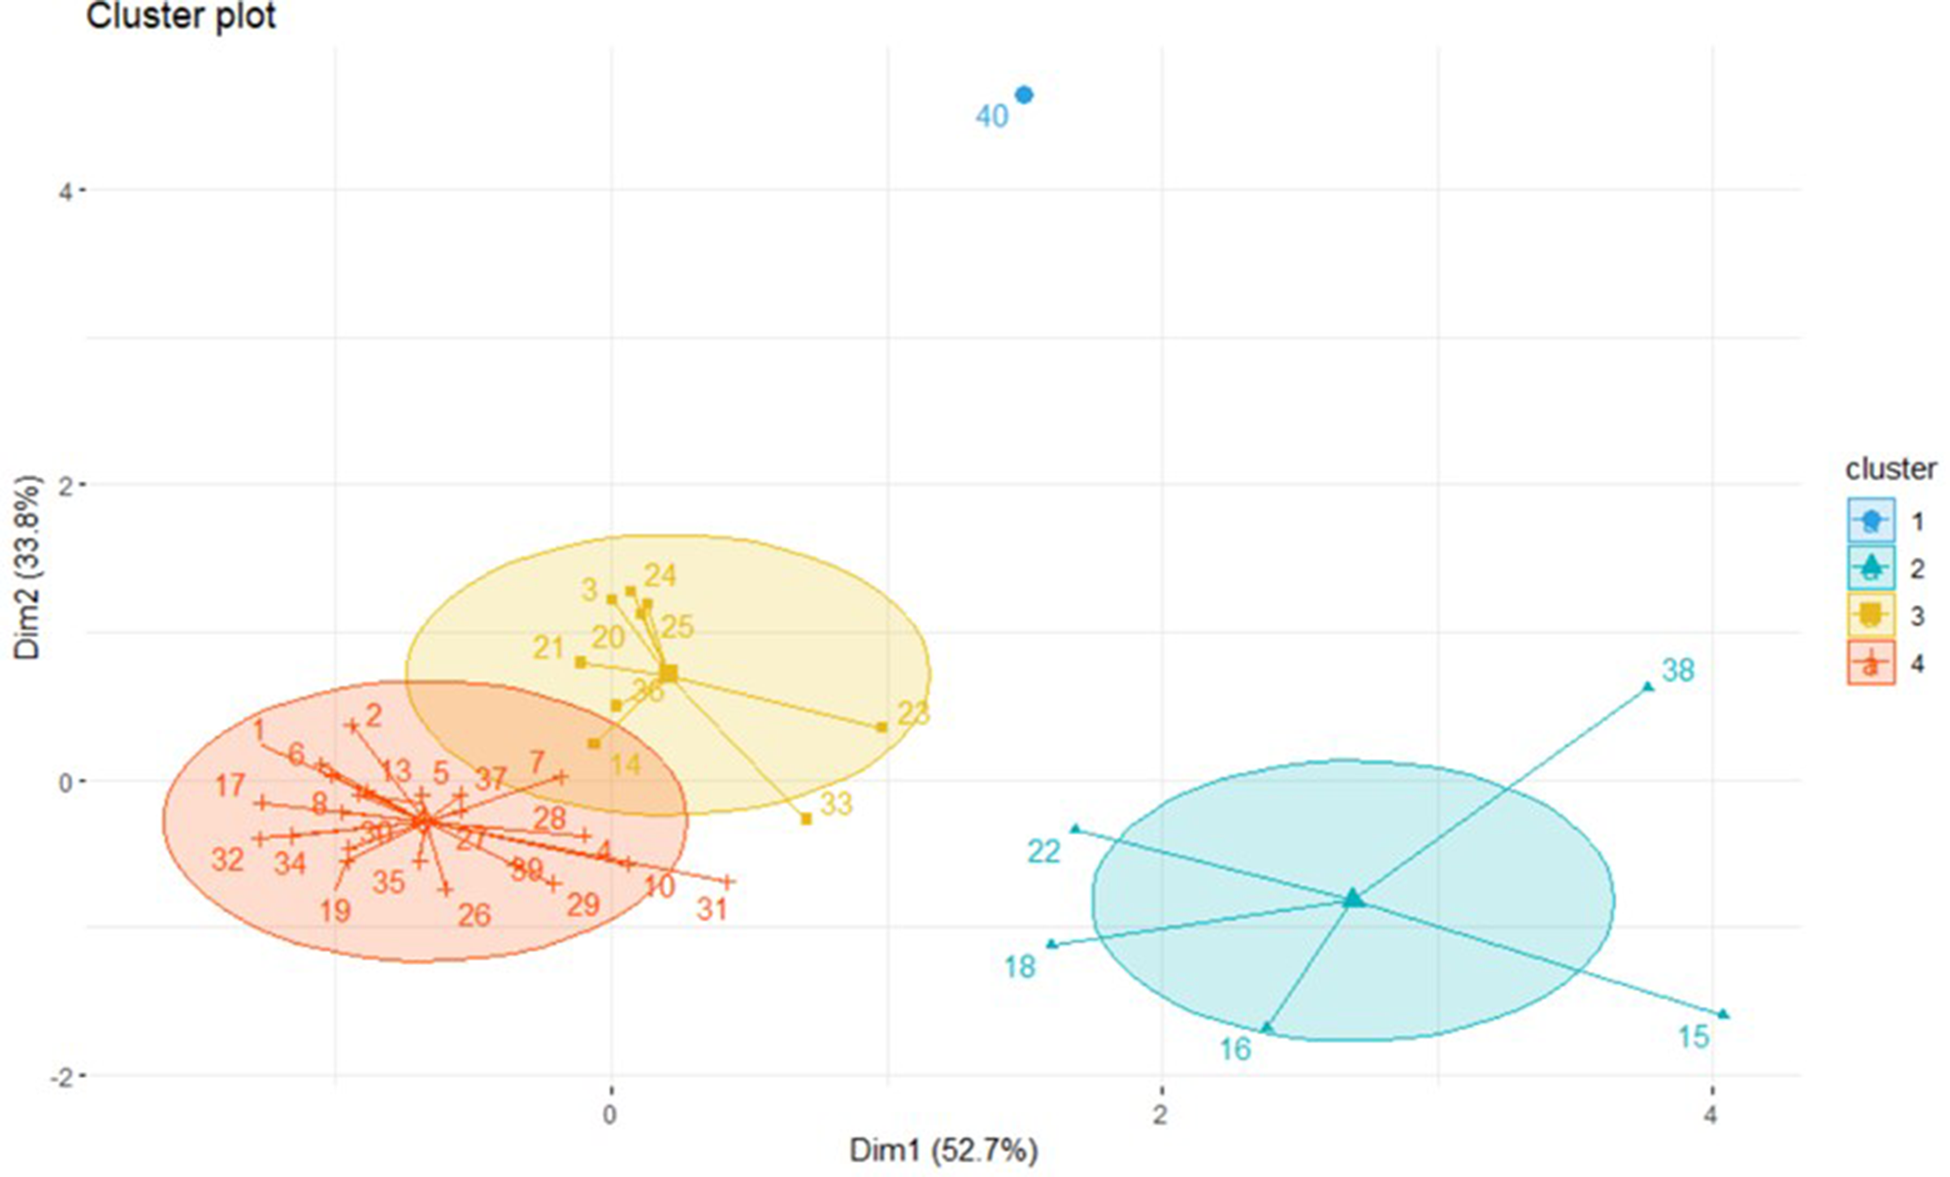
The PCA resulted in two principal components (PCs) with eigenvalues greater than 1. The eigenvalues for PC1, PC2 and PC3 were 1.58, 1.01 and 0.40, respectively. The first two PCs accounted for 86.52% of the total variation, which was depicted in the scree plot (online Supplementary Fig. S3). The PCA revealed two prominent PCs with 52.7% and 33.8% contributions. All three compounds contributed to the variation significantly. The optimal number of clusters were identified to be four (Fig. 4). These clusters had DC 405 (Sl. No. 26), DC 98-2 (8), Pusa Kartik Sankar (5) and Pusa Meghna (1) genotypes, respectively (online Supplementary Fig. S4). Sicilian Purple (No. 40) was a sole genotype in a group, placed in the right quadrant. Pusa Himjyoti (22), DC 407 (18), Pusa Sharad (16), GPMT 100 (15) and Purple Broccoli ‘DPB-1’ (38) were grouped in one cluster. Maximum genotypes were in the left quadrant, while the right quadrant had only five genotypes with maximum loading values. The clusters had genotypes from different maturity groups. Correlation analysis revealed a significant positive correlation between glucoerucin and sinigrin (online Supplementary Fig. S5), however, no correlation was observed between glucoerucin and progoitrin.
Cluster plot of cauliflower genotypes for glucosinolates content (Sl. No. as in Table 2).

Discussion
Information on the GSLs in genetic resources is a crucial requirement for breeding varieties with a desirable GSL profile. The present study detected a wide range for glucoerucin, sinigrin, and progoitrin content in 40 genotypes of Indian cauliflower, broccoli, and Sicilian Purple. The study is more extensive regarding the number of genotypes and GSLs examined over a two-year period. Previous studies focused solely on sinigrin in a limited number of genotypes within a single-year effort, which had limited scope for breeding use (Neelavathi et al., Reference Neelavathi, Pal and Shankaraswamy2015; Vanlalneihi et al., Reference Vanlalneihi, Saha, Kalia, Jaiswal, Kundu, Saha, Sirowa and Singh2019, Reference Vanlalneihi, Saha, Kalia, Singh, Saha, Kundu, Singh and Bhowmik2020).
Glucoerucin was prominent in 83.78% of the genotypes, followed by sinigrin (16.22%) and progoitrin (5.40%). The prominence of sinigrin in the six genotypes of cauliflower agrees with the previous findings of Kushad et al. (Reference Kushad, Brown, Kurilich, Juvik, Klein, Wallig and Jeffery1999), Ciska et al. (Reference Ciska, Martyniak-Przybyszewska and Kozlowska2000), Charron and Sams (Reference Charron and Sams2004), Schonhof et al. (Reference Schonhof, Krumbein and Brückner2004) and Giuffrida et al. (Reference Giuffrida, Agnello, Mauro, Ferrante and Leonardi2018). The high level of glucoerucin in 31 genotypes compared to sinigrin signifies a notable genotypic difference. Compared to previous investigators that focused on European cauliflower, the current study examined Indian cauliflower genotypes, excluding Pusa Snowball K-1 and Pusa Snowball Kt-25 from the snowball group. Indian and European cauliflowers exhibit genetic variations attributable to major and minor mutations (Dey et al., Reference Dey, Bhatia, Sharma, Bhardwaj, Pandey, Parkash and Kumar2018; Rakshita et al., Reference Rakshita, Singh, Verma, Sharma, Saini, Iquebal, Sharma, Dey and Behera2021). These mutations also contribute to the variation in the GSL profile (Yan and Chen, Reference Yan and Chen2007).
The present study measured progoitrin in the range of 0.004 to 0.849 μmol/g, which was consistent with the previously reported range of 0.60 to 1.77 μmol/g (Schonhof et al., Reference Schonhof, Krumbein and Brückner2004) and 0.2 to 0.3 μmol/g (Charron et al., Reference Charron, Saxton and Sams2005). However, 31 and 21 genotypes had progoitrin level below the minimum value reported by Schonhof et al. (Reference Schonhof, Krumbein and Brückner2004) and Charron et al. (Reference Charron, Saxton and Sams2005), respectively. None of the tested genotypes had higher progoitrin than the maximum limit reported by Schonhof et al. (Reference Schonhof, Krumbein and Brückner2004). Pusa Paushja and Pusa Shukti of the mid-late group were found as progoitrin-free commercial varieties. Very low progoitrin was found in Pusa Deepali and Pusa Sharad of early and mid-early groups, respectively. The differences in the genotypes for progoitrin level were attributed to the variation in the genotypes. Further, variation in environment during growth and curding stages of the genotypes also contributed to significant variation. The growing conditions and analytical methods might have contributed to the variation from the findings of Schonhof et al. (Reference Schonhof, Krumbein and Brückner2004) and Charron et al. (Reference Charron, Saxton and Sams2005). Further, they used only two to three varieties, while the present study analysed 37 genotypes. The observed progoitrin in broccoli (0.001 to 0.891 μmol/g) aligns with the findings of Wang et al. (Reference Wang, Gu, Yu, Zhao, Sheng and Zhang2012), who reported a range of 0.0 to 13.73 μmol/g in the broccoli germplasm from China. Overall, progoitrin in the tested cauliflower and broccoli genotypes was lower than the minimal goitrin level (25 mg or 194 μmol) that reduces the absorption of iodine (Felker et al., Reference Felker, Bunch and Leung2016). The purple broccoli ‘DPB-1’ (0.891 ± 0.09 μmol/g) also had lower progoitrin than previously reported (1.03 ± 0.33 μmol/g) in ‘Viola,’ a purple broccoli (Schonhof et al., Reference Schonhof, Krumbein and Brückner2004). The differences were due to the genotype and growing conditions (Verkerk et al., Reference Verkerk, Schreiner, Krumbein, Ciska, Holst, Rowland, De Schrijver, Hansen, Gerhäuser, Mithen and Dekker2009).
The significant variation in the tested cauliflower genotypes for sinigrin content is consistent with the previous findings in Indian cauliflower (Vanlalneihi et al., Reference Vanlalneihi, Saha, Kalia, Jaiswal, Kundu, Saha, Sirowa and Singh2019, Reference Vanlalneihi, Saha, Kalia, Singh, Saha, Kundu, Singh and Bhowmik2020). They reported DC 41-5 (0.164 μmol/g fw) of the early group and DC 326 (0.36 μmol/g fw) of the mid-early group as the highest sinigrin-containing genotypes. However, the present study found seven and ten genotypes containing higher sinigrin than DC 41-5 and DC 326 in early and mid-early groups, respectively. In cauliflower, Ciska et al. (Reference Ciska, Martyniak-Przybyszewska and Kozlowska2000) and Charron et al. (Reference Charron, Saxton and Sams2005) also reported sinigrin in the range of 5.7–12.9 μmol/g and 0.15–3.5 μmol/g, respectively. High sinigrin is a stimulant for the oviposition of specialist insects, suggesting further investigation using genotypes high in sinigrin (GPMT 100, Pusa Himjyoti, and DC 407) to explore as a trap crop and low sinigrin genotypes (DB 6, DC 23000, DC 309 and DC 405) for insect resistance (Raybould and Moyes, Reference Raybould and Moyes2001).
The glucoerucin hydrolysis product erucin converts into glucoraphanin due to the oxidation process by FMO GS-OX1 gene, which serves as a precursor of sulforaphane (Li et al., Reference Li, Liu, Li, Fang, Yang, Zhuang, Zhang and Lv2019). The present study observed a wide range of 0.067 to 7.248 μmol/g in cauliflower, which was higher than the range of 0.0 to 0.19 μmol/g dw reported by Ciska et al. (Reference Ciska, Martyniak-Przybyszewska and Kozlowska2000). The commercial varieties found to be rich in glucoerucin were Pusa Deepali, Pusa Sharad, Pusa Shukti and Pusa Snowball K-1 of early, mid-early, mid-late, and late groups, respectively. These high-glucoerucin commercial varieties can be used in further studies for health benefits. Besides, glucoerucin-rich DC-71 (early), GPMT 100 (mid-early) and DC-476 (mid-late) have potential in breeding use. These genotypes were also found as good combiners for curd yield (Verma and Kalia, Reference Verma and Kalia2011) and dietary minerals (Karigar et al., Reference Karigar, Singh, Mangal, Saroha, Saini, Ray and Behera2023). Further, the observed range of glucoerucin in broccoli (1.006–4.319 μmol/g) agreed with the findings of Wang et al. (Reference Wang, Gu, Yu, Zhao, Sheng and Zhang2012), however, they reported a wider range of 0.0–6.10 μmol/g DW in 143 broccoli genotypes from China.
The climatic conditions, such as mean temperature, day length and sunshine hours during crop growth and curd formation stages, contribute to the variation in GSLs (Cartea et al., Reference Cartea, Velasco, Obregón, Padilla and de Haro2008; Zhang et al., Reference Zhang, Schonhof, Krumbein, Gutezeit, Li, Stützel and Schreiner2008; Di Bella et al., Reference Di Bella, Toscano, Arena, Moreno, Romano and Branca2021). Charron et al. (Reference Charron, Saxton and Sams2005) and Cartea et al. (Reference Cartea, Velasco, Obregón, Padilla and de Haro2008) reported the influence of climatic factors on GSLs using the same set of varieties grown in different environments. The present study tested a total of 37 genotypes of cauliflower in their respective maturity groups during the two years. These groups pass through different climatic conditions for their vegetative growth and curd development (Mangal and Singh, Reference Mangal and Singh2023). The early, mid-early, mid-late and late maturity groups pass through different temperature regimes during vegetative growth, i.e. 28.9–31.75, 20.5–30.9, 16.3–27.1 and 10.7–19.8 °C and the curd development phase, i.e. 20.5–29.3, 16.3–17.9, 12.0–16.6 and 10.7–17.6 °C, respectively. The early group had a lower sinigrin level (0.278 μmol/g) than the mid-early group (1.114 μmol/g), which might be due to the high temperature during growth and curd development of the early group. Vanlalneihi et al. (Reference Vanlalneihi, Saha, Kalia, Jaiswal, Kundu, Saha, Sirowa and Singh2019, Reference Vanlalneihi, Saha, Kalia, Singh, Saha, Kundu, Singh and Bhowmik2020) also reported lower sinigrin in the early group (0.084 μmol/g fw) than in the mid-early group (0.208 μmol/g fw).
In the evolutionary process, the Sicilian purple is an intermediary of broccoli and cauliflower hence, they have commonality in the genes involved in developmental and biochemical processes (Singh et al., Reference Singh, Kalia, Meena, Mangal, Islam, Saha and Tomar2020). The difference in GSLs in these crops might be due to differences in three major GSL pathway genes, namely BoGSL-ELONG, BoGSL-PRO and BoGSL-ALK (Li and Quiros, Reference Li and Quiros2002). The dominant alleles of BoGSL-ELONG and BoGSL-PRO synthesize 4-carbon GSLs and 3-carbon GSLs, respectively. The dominant alleles of BoGSL-ELONG were reported in broccoli and Sicilian purple, BoGSL-PRO in cauliflower and BoGSL-ALK in Sicilian purple and cauliflower. Null alleles of BoGSL-ELONG in cauliflower, BoGSL-PRO in broccoli and Sicilian purple and BoGLS-ALK in broccoli produce only traces, if any, of the aliphatic GSL.
The observed positive correlation between sinigrin and progoitrin agrees with the findings of Sun et al. (Reference Sun, Tian, Chen, Zhang, Luo, Wang, Li, Gong, Wang, Zhang and Tang2019). They also reported a significant correlation between sinigrin, gluconapin and glucobrassicin in stem mustard. This could be due to GSL pathway genes, namely BoGSL-ELONG (chain elongation), BoGSL-ALK (formation of sinigrin or progoitrin), BoGSL-PRO (formation of glucoerucin) and BoGSL-OXID (conversion of glucoerucin to glucoraphanin) (Li and Quiros, Reference Li and Quiros2002; Ishida et al., Reference Ishida, Hara, Fukino, Kakizaki and Morimitsu2014).
The PCA-biplot analysis revealed high-performing genotypes, namely No. 22 (Pusa Himjyoti), 18 (DC 407), 16 (Pusa Sharad), 15 (GPMT 100) and 38 (purple broccoli ‘DPB-1’), which can be effectively utilized for breeding use. Closer distance between the genotypes and variables denotes a higher value. Traits with eigenvector values >0.4 could be effectively utilized for selection. In broccoli, Li et al. (Reference Li, Zheng, Liu, Fang, Yang, Zhuang, Zhang, Lv, Wang and Xu2021) reported three principal components (PCs) of glucobrassicin, neoglucobrassicin and glucoraphanin explaining 60.53% of the total variance. However, the present study found that two PCs contributed 86.5% variation.
The present study revealed wide variation in sinigrin, progoitrin and glucoerucin in Indian cauliflower genotypes. Progoitrin was less than the harmful range, a key finding for reversing some negative perception, particularly about the tropical cauliflower. Low progoitrin genotypes in early (DC 98-2, DC 121), mid-early (DB 6, DC 407) and mid-late (DC 244, DC SM) groups are potential candidates for breeding use. Both high and low sinigrin genotypes have potential in host-plant resilience against biotic stresses, while glutacoerucin-rich genotypes hold promise for future consumer health studies.
Supplementary material
The supplementary material for this article can be found at https://doi.org/10.1017/S1479262125000061
Acknowledgements
Authors are grateful to Director, IARI, New Delhi for facilities financial support.
Competing interests
There is no conflict of interest. SS conceptualized the research, RKM performed field trials and sampling, and AK performed HPLC analysis. SS analysed data and prepared the manuscript. All the authors read and approved the manuscript.