1 Introduction
Increasingly, political scientists confront not just large amounts of data but different types of data. For example, political actors will often generate text data and vote data (e.g., Lauderdale and Clark, Reference Lewis and Tausanovitch2014); countries may have sets of qualitatively distinct attributes, such as political, social, and economic indicators (e.g., Coppedge et al., Reference Coppedge2015); the same survey questions may be given to different groups of actors (e.g. Shor and McCarty, Reference Stewart and Woon2011); campaign contributions may flow from the same actors to both state and federal candidates (Bonica, Reference Bonica2014). In each case, the researcher must analyze data on different attributes for the same actors (say, tweets and votes from legislators, Barbera Reference Barbera2016), or the same attributes but on different actors (say, surveys given to both legislators and the mass public, Bafumi and Herron Reference Bafumi and Herron2010).
As a first pass, the data from different sources may simply be pooled and scaled (Quinn, Reference Roberts2004; Hoff, Reference Jackman and Trier2007; Jackman and Trier, Reference Jacoby2008; Murray et al., Reference Poole and Rosenthal2013). Pooling suffers, although, when one dataset has much more information, swamping the information from the other set. Combining data from different sources creates even more subtle theoretical and empirical issues. Jessee (Reference Keele, McConnaughy and White2016) illustrated the underlying problem rather elegantly. Using survey data for citizens and legislators, he showed that scaled locations can vary as the relative numbers of individuals from two samples are pooled and used to estimate ideological positions. The problem arises because the different groups give different weights to each question, and it generalizes to the problem of how to weight data coming from two different sources.
Existing approaches have addressed, but not quite solved, the issue of how to weight different types of data. For example, Kim et al. (Reference Klami, Virtanen and Kaski2018) develop a choice-theoretic model for combining words and votes, but a tuning parameter that balances the proportion of information coming from each source is not estimated within the model. The strength of this earlier work is grounding the estimates in a choice-theoretic model and estimating ideal points. As explained below, the method presented in this paper resolves the issue of how to optimally weight two data sources.Footnote 1 In doing so, it eschews a formal choice-theoretic model, which allows it to extend to any two data sources, at the cost of returning scaled locations rather than estimated ideal points.
Authors like Hobbs (Reference Hobbs and Roberts2017) combine information from multiple text sources using a version of canonical correlation analysis (e.g., Hastie et al., Reference Hobbs2013, Sec. 3.7), a method closely related to ours. The method advanced by Hobbs (Reference Hobbs and Roberts2017), though, is tailored to short bursts of speech and does not offer means of inference. Similarly, Weighted Multidimensional Scaling (WMDS) (Borg et al. (Reference Borg, Groenen and Mair2013); Borg and Groenen (Reference Borg and Groenen2005)) combines multiple dissimilarity matrices to recover a single underlying dimension (see also Jacoby, Reference Jacoby1986, Reference Jacoby and Armstrong2009). WMDS, though, returns only locations for the observations and not for the outcomes, that is votes or words, on which the observations are measured. This issue also plagues methods that must pre-select, rather than estimate, ideologically charged words (Groseclose and Milyo, Reference Gupta, Phung, Adams and Venkatesh2005; Gentzkow and Shapiro, Reference Goplerud2010; Martin and Yurukoglu, Reference Murphy2017).
We develop a general framework for combining data from multiple sources. The method, Multi-Dataset Multidimensional Scaling (MD2S) simultaneously scales two datasets, decomposing the data into three separate factors: one spanning a latent space common to both datasets, and two idiosyncratic subspaces—one per dataset. For example, combining votes and words on the same actors, MD2S estimates three latent scales. The first is a joint scale informed by both words and votes. The second is informed by words, but contains no information from votes. Likewise, the third is informed by votes, but not words.
We build off work in statistics and education focusing on recovering the correlation and shared factors across multiple surveys or exams (Tucker, Reference Tucker1958; Browne, Reference Browne1979; Anderson, Reference Anderson1989; Klami et al., Reference Ladha2013; Bach and Jordan, Reference Bach and Jordan2005; Gupta et al., Reference Hahn, Carvalho and Scott2011; Tipping and Bishop, Reference Tucker1999). This model, “Inter-Battery Factor Analysis,” is precisely the model described above. We offer a likelihood-based method for optimally weighting the information coming from the two sources, allow the user to include covariates in estimating the scaled locations, and derive and implement an efficient algorithm for estimation.
The advances of our proposed method are fourfold. First, we recover scaled locations for both observations (say, legislators) and features (say, text and votes). Estimating, for example, which words anchor a dimension’s extremes greatly facilitates interpretation. Second, we allow for inference on the number of latent dimensions. Distinguishing a dimension that is signal from one that is noise is a perennial problem, often unaddressed, in the scaling literature. To this end, we implement a permutation test to distinguish a given dimension from noise. Our third advance is in terms of estimation. Building on insights first advanced in Aldrich and McKelvey (Reference Aldrich and McKelvey1977), we implement an efficient estimation routine that performs well when the number of attributes grows large, as with text data where the researcher has a document-term matrix with counts on thousands of n-grams for each speaker. Inference on the scaled locations for both shared and idiosyncratic subspaces is performed via bootstrapping. Finally, scaled locations are modeled as a function of covariates. This facilitates conducting inference on whether or how scaled locations relate to covariates of interest, giving a principled way to explore the estimated latent scales with substantive information.
We illustrate the method’s use and efficacy through a simulation exercise and an empirical application. We show in the simulation study that MD2S recovers a shared and idiosyncratic dimensions more accurately than existing methods that combine multiple datasets, especially as the number of attributes grows large. We then apply it to roll call votes and floor speech in the U.S. Senate, where there has been a long interest by congressional scholars on recovering legislators’ latent scales. Our shared first dimension aligns with the standard ideological dimension running from liberals to conservatives recovered using only roll-call votes (e.g., Poole, Reference Quinn2005). By combining senators’ votes and floor speech, we recover the selected words that differentiate Senators on this dimension, mostly on economic terms. Additionally, we further differentiate senators by recovering a word-specific subspace that ranges from national security to budget concerns, and a vote-specific subspace with Tea Party senators on one extreme and senior committee leaders on the other.
2 Motivation and Use Cases
To illustrate the basic problem and insight, consider the case where we observe two different streams of data, votes in a roll call matrix and word counts in a document-term matrix, that are observed on the same actors. As is common in text data, assume that we have many more words than votes. Were we to simply join the two datasets and estimate a single scale, it would be closer to the words-only scaling than the votes-only scaling. The words contain more information, but we are not interested in all of the word data. We are most interested in the word data that contribute to explaining the joint variation in both types of data. We could conduct multiple analyses after reweighting the matrix, to find a suitable balance between words and votes in the scaling procedure as in Kim et al. (Reference Klami, Virtanen and Kaski2018), but this sidesteps the problem of relative weighting rather than solving it.
MD2S solves this problem by returning three factors from the two datasets. The first is a joint factor, estimated to explain the largest amount of variance common to both datasets. The next two are idiosyncratic factors, unique to each data source and uncorrelated with the common factor:

This model is the Inter-Battery Factor Analysis (IBFA) model of Tucker (Reference Tucker1958). Applied to the words and votes example, the shared factors are scaled locations for legislators jointly informed by both words and votes. The idiosyncratic word factors are informed by words but not votes. Colloquially, these factors give locations on issues legislators talk about but do not vote on. Similarly, the idiosyncratic vote factors give locations on issues legislators vote on but do not speak about. Partitioning the observed datasets into these three groups adds nuance to scaling, allowing estimated locations to vary across different sets of observed behaviors. Importantly, if there is in-truth no joint information between the two datasets, the model collapses onto just scaling the two datasets separately.
As noted above, MD2S builds on this model in several regards: estimating the number of latent dimensions, providing an efficient and effective estimation algorithm for a large number of attributes, and modeling the scaled locations with covariates.
Use Cases and Scope
If the data come from a single source, or the researcher is willing to ignore the problem of one data source overwhelming the other, then a standard principal components or factor analysis should be utilized. There may be several cases, although, where the researcher may wish to model the two different data sources. Our interest in this method was motivated by combining text and votes, where the sheer volume of the textual data may overwhelm the vote data. Beyond this particular case, the method’s use fall into two broad categories: combining datasets and contrasting them.
Combining datasets may involve bringing auxiliary information to bear on a problem. For example, roll call votes are not informative in legislatures with strong party systems or in the presence of pressures for unanimous or lopsided voting, so words can be used to differentiate among members (for more, see Kim et al., Reference Klami, Virtanen and Kaski2018; Kellerman, Reference Kim, Londregan and Ratkovic2012). Relatedly, one data source may not have sufficient signal to generate a reliable scale, so a second data source can help leverage the first (e.g., Hobbs, Reference Hobbs and Roberts2017). Combining the two sources offers an additional benefit. Placing words and actors in the same space, as in our applied example, allows the researcher to use the selected features to characterize the substantive meaning of each dimension.
Bridging across different actors is another form of combining data. Jessee (Reference Keele, McConnaughy and White2016) highlighted the problem of weighting data from different sources when bridging across different sets of respondents (e.g., Lewis and Tausanovitch, Reference Mair, Borg and Rusch2015; Tausanovitch and Warshaw, Reference Tipping and Bishop2013; Shor and McCarty, Reference Stewart and Woon2011; Bafumi and Herron, Reference Bafumi and Herron2010). If the two groups have different item discrimination parameters, simply pooling the two sets generates ambiguity in their ideal point estimates. The estimates will vary based on either the amount of information or based on the number of respondents, in the two sets.Footnote 2
A third instance for combining datasets comes when constructing indices. Consider the impressive set of measures for cross-national political, civic, and institutional comparison assembled by Coppedge et al. (Reference Coppedge2015). Generating an index by aggregating from finer to coarser measures requires a method that is not sensitive to the number of items at each level.
A second use of the method is for contrasting the two information sources. This approach differs from methods that only uncover a single scale; we discuss these methods in more detail below. MD2S offers the ability to isolate a set of factors based off whether they are informing both datasets, or exclusively one or the other. With data on word usage on the same individuals before and after an event of interest, three sets of factors can be recovered: a factor common to variation in word usage both before and after, one unique to word usage before the event, and one unique to information after the event. Examples of this analysis involve contrasting Twitter data (Barbera, Reference Barbera2016), transcripts of Federal Open Market Committee Meetings before and after a transparency shock (Hansen et al., Reference Hare, Armstrong, Carroll and Poole2018), or Weibo microblogs before or after censorship (Hobbs and Roberts, Reference Hoff2018). Our method offers a structured way of separating out a common factor, allowing the researcher to estimate how latent factors vary across the two datasets.
3 The Proposed Method
For a each observation  $i \in \{1, 2, \ldots , N\}$, and covariate
 $j \in \{1, 2, \ldots , K_{(m)} \}$ in dataset
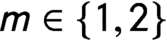 $m \in \{1, 2 \}$, we denote the realized outcome as
 $y_{(m) i, j}^{\ast }$. Therefore, the outcome data matrices take the following form:
 $$ \begin{align} \mathbf{Y}^\ast_{(m)} = \begin{bmatrix} y_{(m)1, 1}^{\ast} & y_{(m) 1, 2}^{\ast} & \cdots & y_{(m) 1, K_{(m)}}^{\ast} \\ y_{(m) 2, 1}^{\ast} & y_{(m) 2, 2}^{\ast} & \cdots & y_{(m) 2, K_{(m)}}^{\ast} \\ \vdots & \vdots & \ddots & \vdots \\ y_{(m) N, 1}^{\ast} & y_{(m) N, 2}^{\ast} & \cdots & y_{(m) N, K_{(m)}}^{\ast} \end{bmatrix} \end{align} $$
making  $\mathbf {Y}^{\ast }_{(m)}$ of size
 $N \times K_{(m)}$. Note that
 $K_{(1)}$ and
 $K_{(2)}$ (the number of features of each dataset) may not be equal. For example, the ith row of the dataset
 $1$, denoted by the vector
 $Y_{(1) i, \bullet }^\ast $, may be a vector of
 $K_{(1)}$ word counts uttered by legislator i, while the corresponding row in dataset 2, denoted by
 $Y_{(2) i, \bullet }^\ast $ may be a set of
 $K_{(2)}$ observed roll call votes for the same legislator.
We assume that each matrix  $\mathbf {Y}_{(m)}^\ast $ is on a common scale. This may be due to a natural scale, such as binary vote data, columns may be normed to have sample standard deviation one, or some other method may be used to place all columns of
 $\mathbf {Y}_{(m)}^\ast $ on a common scale (e.g., Quinn, Reference Roberts2004; Hoff, Reference Jackman and Trier2007; Murray et al., Reference Poole and Rosenthal2013). The important point for our method is that all columns of
 $\mathbf {Y}_{(m)}^\ast $ be on a common interval scale. While each matrix must be on a common scale, the two separate matrices may be on different scales. For example,
 $\mathbf {Y}_{(1)}^\ast $ may word counts and
 $\mathbf {Y}_{(2)}^\ast $ roll calls.
3.1 The Model
In practice, as the intercept is rarely of interest, we preprocess the matrices by double-centering them, so that the row-mean, column-mean, and grand mean is zero. We denote the double-centered matrices as  $\mathbf {Y}_{(m)}$.Footnote 3 Thus, we model
 $\mathbf {Y}_{(1)}$ and
 $\mathbf {Y}_{(2)}$ in terms of their latent factors asFootnote 4
 $$ \begin{align} \mathbf{Y}_{(1)} &= \mathbf{Z}_S \mathbf{L}_{(1)} \mathbf{W}_{(1)}^\top + \mathbf{Z}_{(1)} \mathbf{D}_{(1)} \mathbf{B}_{(1)}^\top + \Omega_{(1)} \end{align} $$
 $$ \begin{align} \mathbf{Y}_{(2)} &= \mathbf{Z}_S \mathbf{L}_{(2)} \mathbf{W}_{(2)}^\top + \mathbf{Z}_{(2)} \mathbf{D}_{(2)} \mathbf{B}_{(2)}^\top + \Omega_{(2)} . \end{align} $$
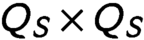
We will refer to the  $N \times Q_S$ matrix
 $\mathbf {Z}_S$ as the shared subspace and the
 $N \times Q_{(m)}$ matrix
 $\mathbf {Z}_{(m)}$ as the idiosyncratic subspace.
 $\mathbf {Z}_S$ contains latent locations on the shared subspace in columns for each of the
 $Q_S$ dimensions. Similarly, each column of
 $\mathbf {Z}_{(m)}$ contains the latent locations in the idiosyncratic subspace for
 $Q_{(m)}$ latent dimensions.
 $\mathbf {L}_{(m)}$ is
 $Q_S\times Q_S$ non-negative, diagonal matrix of loadings for the shared subspace. We assume that the two matrices
 $\mathbf {L}_{(1)}$ and
 $\mathbf {L}_{(2)}$ are proportional, so any difference between them is attributable to the relative scales across data sources
 $\mathbf {Y}_{(m)}$.
 $\mathbf {W}_{(m)}$ is a
 $ K_{(m)} \times Q_{S}$ matrix of factors for the shared subspace for dataset
 $\mathbf {Y}_{(m)}$.
 $\mathbf {D}_{(m)}$ is a
 $Q_{(m)}\times Q_{(m)}$ diagonal matrix of loadings for the idiosyncratic subspace, and
 $\mathbf {B}_{(m)}$ is the
 $K_{(m)} \times Q_{(m)}$ of factors for the idiosyncratic subspace. The
 $N \times K_{(m)}$ matrix
 ${{\Omega} }_{(m)}$ is of mean-zero, independent, and equivariant noise.
We have modeled each observed data matrix  $\mathbf {Y}_{(m)}$ in terms of a shared subspace
 $\mathbf {Z}_S$ and individual subspaces
 $\mathbf {Z}_{(m)}$. The researcher may believe, although, that the estimated scaled locations may vary systematically with some set of known covariates available for the N observations in the data. As in Roberts et al. (Reference Rockova and George2014), we allow the scaled locations to take the following form:
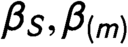
 $$ \begin{align} \mathbf{Z}_S& = \mathbf{X}_{S} \mathrm{\beta}_S + {{\Omega}}_{\mathbf{Z}_S}, \end{align} $$
 $$ \begin{align} \mathbf{Z}_{(m)}&= \mathbf{X}_{(m)} \mathrm{\beta}_{(m)} + {{\Omega}}_{\mathbf{Z}_{(m)}}, \text{ for } m \in \{1,2\}, \end{align} $$
where  $\mathbf {X}_S$ and
 $\mathbf {X}_{(m)}$ are matrices of size
 $N \times F_S$ and
 $N \times F_{(m)}$, respectively. These matrices of covariates structure the systematic factors of
 $\mathbf {Z}_{S}$ and
 $\mathbf {Z}_{(m)}$. The matrices need not be the same for each subspace, so one set of covariates could structure the shared subspace and another the idiosyncratic ones.Footnote 5 The
 $N \times Q_{(m)}$ matrix
 ${\mathrm{\Omega} }_{\mathbf {Z}_{(m)}}$ and the
 $N \times Q_S$ matrix
 ${\mathrm{\Omega} }_{\mathbf {Z}_{S}}$ are of mean-zero, independent, and equivariant noise.
In the estimation algorithm, we recover the matrices of parameters  $\mathrm {\beta }_{S}$ (of size
 $F_S \times Q_S$) and
 $\mathrm {\beta }_{(m)}$ (of size
 $F_{(m)} \times Q_{(m)}$) iteratively given Equations (4) and (5). Thus, adding the covariate information can potentially lead to different scaled locations.
We make five assumptions for identifying the model (for a discussion of identification, see Tipping and Bishop, Reference Tucker1999, Appendix A.1), where the assumptions hold for  $m\in \{1,2\}$:
 $$ \begin{align} &\mathbf{Z}_S^\top \mathbf{Z}_S = \mathbf{W}_{(m)}^\top \mathbf{W}_{(m)} = \mathbf{I}_{Q_S}, \end{align} $$
 $$ \begin{align} &\mathbf{Z}_{(m)}^\top \mathbf{Z}_{(m)} = \mathbf{B}_{(m)}^\top \mathbf{B}_{(m)} = \mathbf{I}_{Q_{(m)}}, \end{align} $$
 $$ \begin{align} &\mathbf{Z}_{(m)}^\top \mathbf{Z}_{S} = {\mathbf 0}_{Q_{(m)} \times Q_S}, \end{align} $$
 $$ \begin{align} &\mathbf{L}_{(1)} \propto \mathbf{L}_{(2)}, \end{align} $$
 $$ \begin{align} &\mathbf{L}_{(m)}, \mathbf{D}_{(m)} \text{ are diagonal with non-negative entries} \end{align} $$
Assumptions (6) and (7) state that, within a given subspace, the latent scalings and factors are uncorrelated and length one. Assumption (8) states that the common subspace spanned by  $\mathbf {Z}_S$ is not correlated with the idiosyncratic scalings. This assumption allows us to differentiate the shared subspace from each idiosyncratic subspace. Assumption (9) requires the variation in loadings for the shared subspace to be explained by the relative scales across data sources. Assumption (10) identifies the particular rotation that we estimate. Specifically, we are assuming that the factors
 $\mathbf {W}_{(m)}$ and
 $\mathbf {B}_{(m)}$ are numerically equal to singular decompositions of the shared and idiosyncratic subspaces of
 $\mathbf {Y}_{(m)}$, respectively.Footnote 6 Note that we only identify the latent factors
 $\mathbf {Z}_S, \mathbf {Z}_{(m)}, \mathbf {W}_S$ and
 $\mathbf {B}_{(m)}$ up to sign.Footnote 7 We follow convention and assume the elements of
 $\mathbf {L}_{(m)}$ and
 $\mathbf {D}_{(m)}$ are non-negative and arranged in decreasing order. We discuss relaxations of these assumptions in Section 3.5.
3.2 A Probabilistic Framework
We next embed our factor model in a probabilistic framework, where we recover maximum likelihood estimates of the factors. For the jth feature of dataset m, denoted by vector  $Y_{(m),\bullet , j}$ of length N, the probabilistic MD2S model can be written as:
 $$ \begin{align} Y_{(m),\bullet, j} | W_{(m), j, \bullet}, B_{(m), j, \bullet}, \mathbf{L}_{(m)}, \mathbf{D}_{(m)} &\sim \mathcal{N}(\mathbf{Z}_S \mathbf{L}_{(m)} W^{\top}_{(m), j, \bullet} + \mathbf{Z}_{(m)} \mathbf{D}_{(m)} B^{\top}_{(m), j, \bullet} ; \sigma^2_{(m)} \mathbf{I}_N), \end{align} $$
where  $W_{(m), j, \bullet }$ and
 $B_{(m), j, \bullet }$ represent the row of the matrix of factors associated with the jth feature of the data.
This model is an extension of the Probabilistic Principal Components model of Tipping and Bishop (Reference Tucker1999); see also Bach and Jordan (Reference Bach and Jordan2005). We differ from these models as we are most interested in the actors’ spatial locations ( $\mathbf {Z}_S, \mathbf {Z}_{(m)})$, so we treat the weights
 $\mathbf {W}_{(m)}$ and
 $\mathbf {B}_{(m)}$ as random and the spatial locations as fixed (see also Aldrich and McKelvey, Reference Aldrich and McKelvey1977, p. 117). We maintain the assumption that the errors are of equal variance, and therefore do not vary systematically across individuals or features.
Marginalizing over 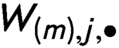 $W_{(m), j, \bullet }$ and
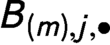 $B_{(m), j, \bullet }$, gives the unconditional densities for the vector
 $Y_{(m), \bullet , j}$ as
 $$ \begin{align} Y_{(m), \bullet, j} \sim \mathcal{N}(\mathrm{0}_N, \mathbf{C}_{(m)}), \end{align} $$
where, for  $m \in \{1, 2\}$, the symmetric
 $N \times N$ matrix,
 $\mathbf {C}_{(m)} = \mathbf {Z}_S \mathbf {L}_{(m)}^2 \mathbf {Z}_S^\top + \mathbf {Z}_{(m)} \mathbf {D}_{(m)}^2 \mathbf {Z}_{(m)}^\top + \sigma ^2_{(m)} \mathbf {I}_N$.
The data log-likelihood as a function of  $\{ \mathbf {Z}_S, \mathbf {Z}_{(1)}, \mathbf {Z}_{(2)}, \mathbf {L}_{(1)}, \mathbf {L}_{(2)}, \mathbf {D}_{(1)} , \mathbf {D}_{(2)} \}$ can be written as
 $$ \begin{align} &\ell \left(\mathbf{Z}_S, \mathbf{Z}_{(1)}, \mathbf{Z}_{(2)}, \mathbf{L}_{(1)}, \mathbf{L}_{(2)}, \mathbf{D}_{(1)} , \mathbf{D}_{(2)} | \mathbf{Y}_{(1)}, \mathbf{Y}_{(2)}\right) =\nonumber\\ & -\frac{1}{2}\left\{N(K_{(1)} + K_{(2)}) \log\left(2 \pi\right) - K_{(1)} \log\left(| \mathbf{C}_{(1)} |\right) - K_{(2)} \log\left(| \mathbf{C}_{(2)} |\right) - \mathrm{tr}\left(\mathbf{Y}_{(1)} \mathbf{Y}_{(1)}^\top \mathbf{C}_{(1)}^{-1} +\mathbf{Y}_{(2)} \mathbf{Y}_{(2)}^{\top} \mathbf{C}_{(2)}^{-1}\right) \right\}. \end{align} $$
We derive analytical expression for the maximum likelihood estimates in Appendix A.
3.3 Implementation
In the single dataset setting, Tipping and Bishop (Reference Tucker1999) show that the maximum likelihood estimates for each factor are principal components of the data. We extend the result to the MD2S model. Doing so allows for an efficient estimation strategy, whereby we can estimate  $\mathbf {Z}_S, \mathbf {Z}_{(1)},$ and
 $\mathbf {Z}_{(2)}$ directly using an iterative algorithm, then recover the remaining estimates,
 $\widehat {\mathbf {W}}_{(m)},\widehat {\mathbf {B}}_{(m)}, \widehat {\mathbf {L}}_{(m)}, \widehat {\mathbf {D}}_{(m)}$, afterwards. We prove the validity of this strategy in the following proposition:
Proposition 1 The maximum likelihood estimates for the shared and idiosyncratic subspaces can be written as singular vectors of functions of the data. Specifically:
1. The maximum likelihood estimates for
 $\mathbf {Z}_{(m)}$ are proportional to principal components of $\displaystyle {\mathbf {Y}_{(m)}^\top \mathbf {M}( \mathbf {Z}_S )}$ for $\displaystyle {m \in \{ 1, 2 \}}$.Footnote 8
2. Denote
$\mathbf {Z}_{S | (m) }$ as the $N \times Q_S$ matrix containing the first $Q_S$ principal components of $\mathbf {Y}_{(m)}^\top \mathbf {M}(\mathbf {Z}_{(m)})$. Then,(a)
; with where and are two diagonal matrices of size $Q_{S} \times Q_{S}$ with for $m \in \{1, 2 \}$ and $q \in \{1, \ldots , Q_S\}$.(b)
$\mathbf {Z}_S$ is selected to maximize $\mathrm {tr}\left (\mathbf {Z}_S^\top \mathbf {Y}_{(1)}^{}\mathbf {Y}_{(1)}^\top \mathbf {Y}_{(2)}^{} \mathbf {Y}_{(2)}^\top \mathbf {Z}_S\right )$.




Proof See Appendix A.
The proposition leads directly to our estimation strategy.Footnote 9 Our algorithm estimates the MD2S model using an iterative procedure that updates the estimate of each subspace one at a time, enforcing the constraints in Equations (6)--(10) along the way. That is, for every iteration until convergence, the estimation proceeds in two steps. Given the previous iteration estimate of the shared space  $\mathbf {Z}_S$, we update
 $\widehat {\mathbf {Z}}_{(1)}$ and then
 $\widehat {\mathbf {Z}}_{(2)}$. Second, we partial the idiosyncratic spaces out to update
 $\widehat {\mathbf {Z}}_S$, which is a weighted average of the first
 $Q_S$ principal components of
 $\mathbf {Y}_{(m)}^\top \mathbf {M}(\widehat {\mathbf {Z}}_{(m)})$ for
 $m \in \{1, 2\}$. After convergence in each subspace, we update our estimates of the remaining parameters.
Note that our algorithm allows the computational advantage of having to invert square matrices of whichever size is smaller,  $N \times N$ or
 $K_{(m)} \times K_{(m)}$.Footnote 10 For example, in the main empirical application below we observe 100 voting members, 486 votes, but 2,532 words. Our algorithm is fit through inverting matrices of size 100
 $\times $ 100 instead of 486
 $\times $ 486 or 2,532
 $\times $ 2,532, which gives us sizable computational gains. One advantage of our algorithm is that, at each step, it recovers estimates of the data,
 $\widehat {\mathbf {Y}}_{(1)}$ and
 $\widehat {\mathbf {Y}}_{(2)}$, conditional on current estimates of shared and idiosyncratic subspaces. Thus, all the information at hand is used in estimation.
3.4 Uncertainty
Uncertainty in Scaled Locations
We estimate uncertainty for two parts of the MD2S model: the scaled locations and the number of dimensions. For the scaled locations, we rely on the bootstrapping methodology introduced by Jacoby and Armstrong II (Reference Jessee2014). Let  $\{\widetilde {\mathbf {Y}}^b_{(1)}, \widetilde {\mathbf {Y}}^b_{(2)}\}$ denote two
 $b^{th}$ bootstrapped samples, with
 $b \in \{1,2, \ldots , B\}$, where B is some large number, such as 1,000. The bootstrapped sample is generated by fixing the number of rows and sampling
 $K_{(m)}$ columns for each matrix, with replacement. Uncertainty due to sampling error can be estimated through fitting MD2S to these bootstrapped estimates.
Distinguishing Scaled Locations from Random Noise
We present a statistical method for estimating the number of dimensions while acknowledging that the first empirical consideration should be substantive interpretability of the estimated subspaces. We recommend separating signal from noise dimensions through the use of a permutation test (e.g., Keele et al., Reference Kellerman2012). A permutation test requires estimating the density of a test statistic on a set of datasets permuted such that under the null hypothesis, there is in-truth no signal in the data, and then the observed value is compared to this simulated null distribution. We are not the first to use a permutation test to separate an estimated scale from noise (see e.g., Mair et al. Reference Martin and Yurukoglu2016 and references therein). However, these authors only compare the estimated weight on each dimension to the mean under the simulated null, rather than estimate a p value (figure 1 in Mair et al. Reference Martin and Yurukoglu2016).
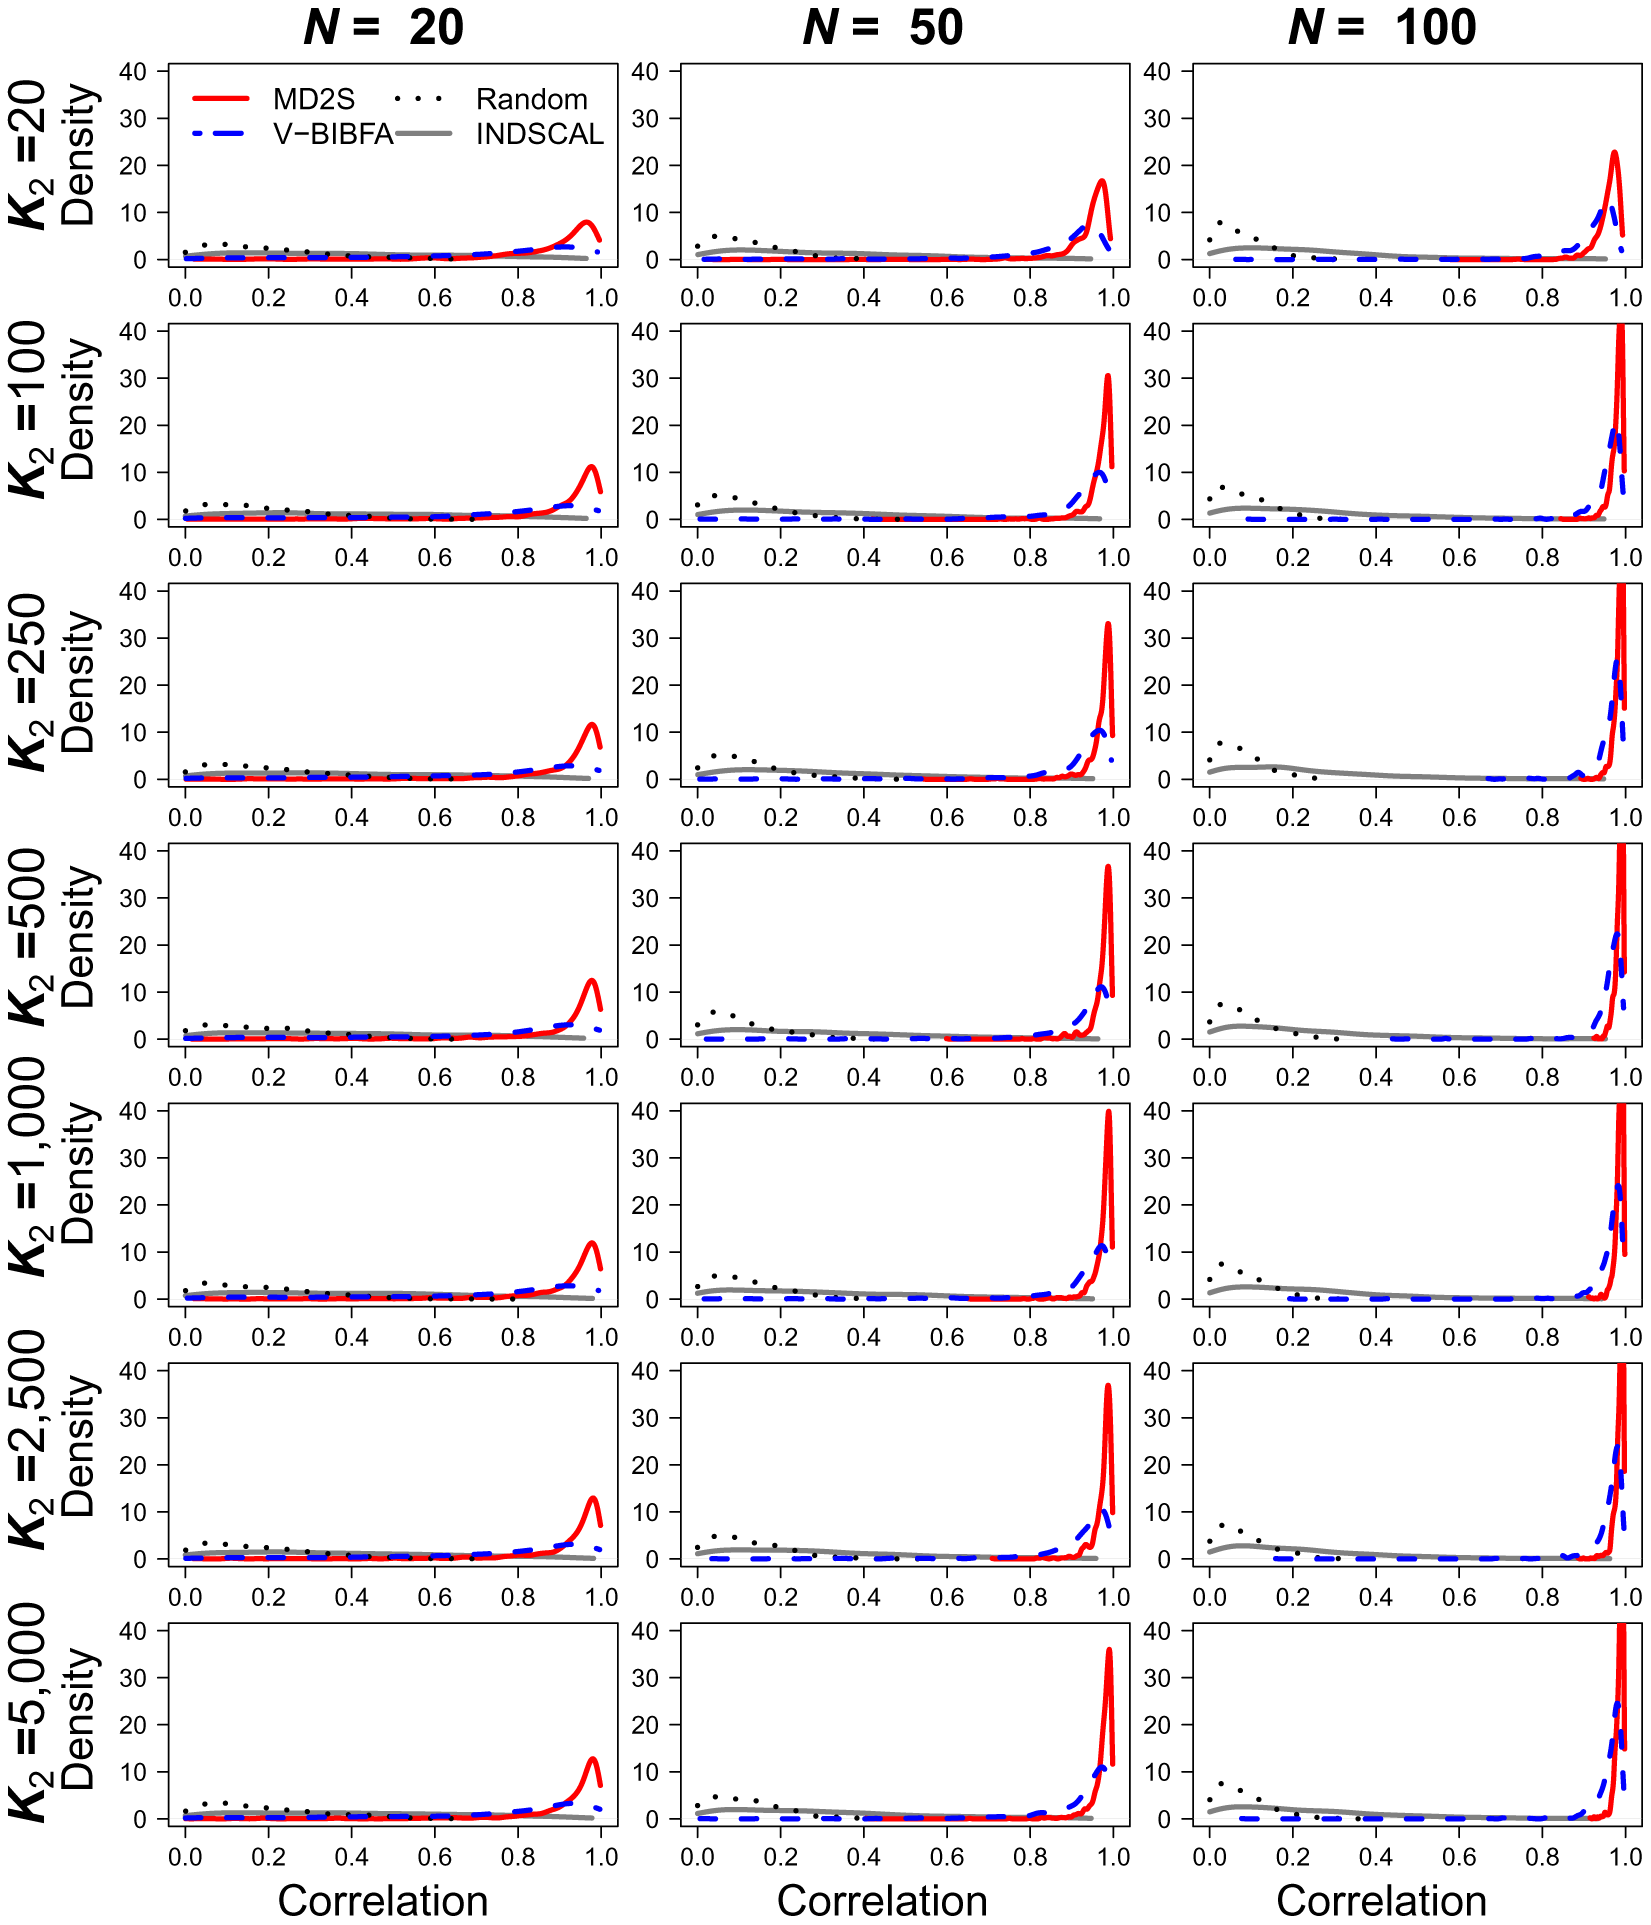
Correlation between common subspace ( $Z_{S;1}$) and its estimate, by method. Sample size is in columns (
 $N \in \{ 20, 50, 100\}$) and
 $K_{(2)} \in \{20, 100, \ldots , 5,000\}$ is in rows. The x-axis ranges from 0 to 1 and measures the correlation between the true and estimated values. The proposed method, MD2S, is compared to V-BIBFA and INDSCAL, as described in the text. All methods improve in N, but MD2S outperforms the rest along N and
 $K_{(2)}$.

For the permutation test, we assume that there is no structure in the data, so the subspace loadings are all zero. Formally,
 $$ \begin{align} \mathcal H^0_{\mathcal{L}_{(m); q}}: \mathcal{L}_{(m); q} = 0; \end{align} $$
 $$ \begin{align} \mathcal H^0_{\mathcal{D}_{(m); q}}: \mathcal{D}_{(m); q} = 0, \end{align} $$
where for all  $m \in \{ 1, 2 \}$,
 $\mathcal {L}_{(m)} = \mathrm {diag}(\mathbf {L}_{(m)})$, and
 $\mathcal {D}_{(m)} = \mathrm {diag}(\mathbf {D}_{(m)})$. In this setting,
 $\mathcal {L}_{(m); q}$ and
 $\mathcal {D}_{(m); q}$ represent the qth element (dimension) of
 $\mathcal {L}_{(m)}$ and
 $\mathcal {D}_{(m)}$, respectively. Under these hypotheses, the observed data is pure noise with no systematic structure, that is
 $\mathbf {Y}_{(m)} = \mathrm {\Omega }_{(m)}$. In other words, any permutation of the data is equally likely. We permute the data, estimate dimension weights, and then compare the statistic under the observed data to the statistic under the null distribution. To the extent that the statistic is an outlier under the null hypothesis, we can argue that the null hypothesis is not accurate and there is, in fact, some systematic relationship in the data.
Specifically, we permute the data such that within each column of  $\mathbf {Y}_{(m)}$, the rows are shuffled. In this case, in truth, there is no systematic relationship in the permuted data. Denote the
 $r^{th}$ permuted dataset out of R total as
 $\widetilde {\mathbf {Y}}^r_{(m)}$, with R some large number, say 1,000. For each permuted dataset, we calculate the dimension weights,
 $\widehat {\mathcal {L}}^r_{(m)}$ and
 $\widehat {\mathcal {D}}^r_{(m)}$. Then for each dimension q, those values are compared to the estimated values on the non-permuted data,
 $\widehat {\mathcal {L}}_{(m)}$ and
 $\widehat {\mathcal {D}}_{(m)}$.
Under this formulation, a p value for dimension q in the shared subspace or idiosyncratic subspace can be estimated as
 $$ \begin{align} \widehat p_{S;q} = \frac{\sum_{r=1}^R \mathbf 1\left (\widehat{\mathcal{L}}^r_{(1); q} \le \widehat{\mathcal{L}}_{(1); q} \right)}{R};\;\;\widehat p_{(m);q} = \frac{\sum_{r = 1}^R \mathbf 1\left(\widehat{\mathcal{D}}^r_{(m); q} \le \widehat{\mathcal{D}}_{(m); q}\right)}{R}. \end{align} $$
We adapt the test to our model by noting that the tests are not independent. The dimensions are estimated in order of decreasing loadings, such that more explanatory dimensions are estimated before less explanatory ones. Therefore, we take as our estimated dimensionality the first d dimensions such that each dimension has an estimated p value below a given threshold. In our empirical applications, we calculate the estimated dimensionality  $\widehat d=q$ as the largest q such that dimensions
 $1$ to q have estimated p values below 0.1. However, once the permuted p value is estimated, this threshold can be be manipulated to assess the sensitivity of the estimated number of dimensions.Footnote 11
3.5 Extensions and Discussion of Method
Although our method to recover scaled locations is data-driven, its algorithm can be used in the estimation of choice-theoretic utility models that recover ideal points under different behavioral assumptions (see, e.g., Kim et al., Reference Klami, Virtanen and Kaski2018; Ladha, Reference Lauderdale and Clark1991). For example, we can turn the model into a quadratic utility model through utilizing the latent normal representation of a probit model (Clinton et al., Reference Clinton, Jackman and Rivers2004; Albert and Chib, Reference Albert and Chib1993; Hare et al., Reference Hastie, Tibshirani and Friedman2015; Jackman and Trier, Reference Jacoby2008), leaving it commensurate with a binary choice model. Now, though, the researcher may combine votes on different issues and decompose the ideal points according to our model. We can also utilize scale- and location-mixtures of normals to accommodate ordinal and count data, as in Goplerud (Reference Groseclose and Milyo2019); Albert and Chib (Reference Albert and Chib1993). In this framework, our probabilistic model is the “M”-step of an EM routine, with the “E”-step as an adjustment to the observed data.Footnote 12 Our concern here is not with accommodating a particular class of data or formal choice structure, but instead to develop a framework for integrating multiple sources in a single coherent fashion.
Our method relies on two sets of orthogonality conditions, requiring orthogonality both across subspaces and across factors within a given subspace. The former, that the joint and idiosyncratic subspaces are uncorrelated, is the central element of our identification strategy. The latter, though, can be relaxed. Factors can be recovered within each subspace using any method favored by the researcher. For example, rather than identifying the factors in a given subspace through orthogonality conditions, the researcher could instead allow for correlated factors and identify them with a prior; see Klami et al. (Reference Ladha2013); Gupta et al. (Reference Hahn, Carvalho and Scott2011) for recent work. Placing a prior could shrink elements of the factor, returning a set of correlated factors that may be easier to interpret, particularly in high-dimensional settings (see, e.g., Rockova and George, Reference Shor and McCarty2016, for work in a factor model). In addition, a sparsity prior on the dimension weights could be used to select the number of underlying dimensions (e.g., Kim et al., Reference Klami, Virtanen and Kaski2018; Hahn et al., Reference Hansen, McMahon and Prat2012). The assumption of uncorrelated factors guarantees identification and simplifies several of the derivations in our estimation algorithm (see Supplemental Appendix A), but placing a different structure on the factors in each subspace can be incorporated into our model.
We have also assumed that all of the  $K_{(m)}$ columns in
 $\mathbf {Y}_{(m)}$ are on the same scale. If an analysis requires combining data on different scales, say a combination of continuous and categorical outcomes, we have two suggestions. First, if all of the data is continuous and approximately normal, each column may be converted to a z-scale by subtracting off the mean and dividing by the sample standard deviation. Recent literature has also suggested placing data on the same scale through an inverse z-transformation of the empirical distribution function,
 $$ \begin{align} y^z_{(m) i, j } = \Phi^{-1}\left(\frac{1}{N+1} \sum_{i^\prime=1}^N \mathbf1\left( y_{(m) i^\prime, j} \le y_{(m) i, j} \right)\right), \end{align} $$
where  $\Phi (\cdot )$ is the normal distribution function. For more on this and other methods, see Quinn (Reference Roberts2004); Hoff (Reference Jackman and Trier2007); Murray et al. (Reference Poole and Rosenthal2013).
The probabilistic PCA model allows us to recover point estimates even when there are more features than observations, causing existing common factor analytic implementations to fail due to a rank deficiency. This data structure is unavoidable in text data, where word features may greatly outnumber units of observation. A second approach, Weighted Multidimensional Scaling (WMDS) (Borg et al., Reference Borg, Groenen and Mair2013; Borg and Groenen, Reference Borg and Groenen2005), returns a common index across several datasets, with a measure of how much information each dataset contributes to the common index. MD2S optimally combines the two datasets to extract a common factor, as in WMDS, as well as idiosyncratic factors, allowing the researcher to estimate the location of features along each estimated scale. Doing so greatly aids interpretation, since we can use both the observations (e.g., legislators) and their features (e.g., words) to summarize the dimensions.
Lastly, we wish to qualify how the p values should be incorporated into the process of interpretation. Our permutation test offers a precise, but incomplete, measure of uncertainty; see Mair et al. (Reference Martin and Yurukoglu2016, esp. 778–779) for recent work on the topic.Footnote 13 We advocate three different criteria for ascertaining whether an uncovered dimension is systematic. First is the p value. If a dimension is not easily distinguished from noise, it should not be favored. This, of course, is necessary but not sufficient. The second criterion we recommend is substantive significance, namely the proportion of the observed variance explained by the method. The third criterion is whether the dimension has face validity. Every positive p value threshold leaves open the possibility of recovering a noise dimension, so the particular threshold should be selected based off the researcher’s tolerance of false positives. In our simulation and application exercises, we follow convention and implement a threshold of  $0.1$ below, but do so while emphasizing that the final elements of evaluating the recovered dimensions rely crucially on substantive understanding.
4 Simulation Study
In order to assess the proposed method, we conduct a simulation study which tests MD2S across two different elements: first, its ability to identify common and idiosyncratic factors, as well as its ability to distinguish systematic dimensions from noise.Footnote 14
4.1 Simulation Setup
The observed data consist of matrices  $\mathbf {Y}_{(1)}$ and
 $\mathbf {Y}_{(2)}$ with N rows and
 $K_{(1)}$ and
 $K_{(2)}$ columns respectively. N is varied along
 $\{20, 50, 100\}$ and
 $K_{(2)}$ along
 $\{20,100, 250, 500,1,000, 2,500, 5,000\}$.
 $K_{(1)}$ is held at 40. The data are generated as
 $$ \begin{align} \mathbf{Y}_{(1)}& = 2 Z_{S; 1} W_{(1); 1}^\top+ Z_{S; 2} W_{(1); 2}^\top + 4 Z_{(1); 1} B_{(1); 1}^\top + 2 Z_{(1); 2} B_{(1); 2}^\top + {\mathrm{\Omega}}_{(1)}, \end{align} $$
 $$ \begin{align} \mathbf{Y}_{(2)} &= 2 Z_{S; 1} W_{(2); 1}^\top+ Z_{S; 2} W_{(2); 2}^\top + 4 Z_{(2); 1} B_{(2); 1}^\top + 2 Z_{(2); 2} B_{(2)2}^\top + 2 Z_{(2); 3} B_{(2); 3}^\top + {\mathrm{\Omega}}_{(2)}. \end{align} $$
The latter means that are two shared dimensions denoted by the vectors  $Z_{S; q}$ for
 $q \in \{1, 2\}$. In terms of loadings, we have that the first shared dimension is twice the size of the second one that is,
 $\mathcal {L}_{(m)} = (2, 1)$. The matrix
 $\mathbf {Y}_{(1)}$ has two idiosyncratic dimensions and
 $\mathbf {Y}_{(2)}$ has three. In addition, we have that the dimension loading for the idiosyncratic subspaces are given by
 $\mathcal {D}_{(1)} = (4, 2)$ and
 $\mathcal {D}_{(2)} = (4, 2, 2)$. All systematic factors
 $Z_{(m); q}$,
 $W_{(m); q}$, and
 $B_{(m); q}$ are drawn from a standard normal. The error matrices
 ${\mathrm{\Omega} }_{(m)}$ are scaled such that the systematic component has twice the standard error of the random component, that is the true
 $R^2$ is
 $\left (2/(2+1)\right )^2=4/9 \approx 0.44$. All simulations were run 1,000 times.
We designed this simulation with two goals in mind. First, we wanted the common factor in  $\mathbf {Z}_S$ to not be the largest systematic factor of
 $\mathbf {Y}_{(1)}$ and
 $\mathbf {Y}_{(2)}$. Uncovering the common factor involves avoiding the idiosyncratic factors. Second, we wanted to have more variables than observations in one of the matrices. We did so to mimic text data, where we have more terms than observations and regular factor analysis is computational infeasible.
We compare our proposed algorithm to two additional methods that are able to recover a shared scale from multiple datasets. First, we use a variational approximation of the Bayesian Inter-Battery Factor Analysis (V-BIBFA) model of Klami et al. (Reference Ladha2013). The data generating process behind V-BIBFA is the same as ours, which is based on a linear latent variable model. In contrast to MD2S, V-BIBFA targets the factors or linear projections  $\mathbf {W}_{(m)}$ and
 $\mathbf {B}_{(m)}$ instead of the latent factors
 $\mathbf {Z}_S$ and
 $\mathbf {Z}_{(m)}$. This is done by placing a sparse prior over the linear projections in order to separate a shared linear mapping
 $\mathbf {W}_{(m)}$ from a specific one for each dataset m,
 $\mathbf {B}_{(m)}$. Given an estimated posterior distribution of factors, scaled locations can be recovered from a normal posterior.
We also compare MD2S to another scaling approach, weighted multidimensional scaling or “individual differences scaling” (INDSCAL) as implemented in the R library smacof. Instead of focusing on the scaling of two matrices of size N by  $K_{(1)}$ and N by
 $K_{(2)}$ as done by MD2S, INDSCAL recovers a shared scale from two matrices of dissimilarities of size N by N instead. First, a scale is recovered for each individual dataset and a matrix of weights is estimated to map this individual scales into a shared subspace.Footnote 15 We use the Manhattan distance (L1 norm) as the measure of dissimilarity between the rows of
 $\mathbf {Y}_{(1)}$ and
 $\mathbf {Y}_{(2)}$ to reduce them to square matrices of size N by N. In contrast to MD2S, INDSCAL does not directly return shared and idiosyncratic variation. In order to extract data-specific scales orthogonal to the shared subspace, we first estimate the shared latent dimension with the INDSCAL procedure. Next, with a linear mapping we partial this scale out from the
 $K_{(m)}$ outcomes in each original data matrix,
 $\mathbf {Y}_{(m)}^{\ast }$. Finally, each partialed out dataset is transformed into a squared dissimilarity matrix and scaled via metric multidimensional scaling.
4.2 Results
Our primary interest is in recovering a scaling informed by both sets of datasets. Figure 1 presents the results comparing estimates of the shared subspace and the true shared subspace. The figure is organized with sample size in columns ( $N \in \{ 20, 50, 100\}$) and the number of outcomes in
 $\mathbf {Y}_{(2)}$,
 $K_{(2)} \in \{20, 100, \ldots , 5,000\}$ in rows. The x-axis ranges from 0 to 1 and measures the correlation between the true and estimated values. The y-axis is a density scale. The methods presented include MD2S, the proposed method; the variational Bayesian implementation of Klami et al. (Reference Ladha2013) (V-BIBFA); the individual differences scaling (INDSCAL); and an estimate that is pure normal noise (Random).
Looking across the columns of Figure 1, each method benefits from an increase in sample size and is clearly differentiable from random noise. Table 3 in the Supplemental Appendix B.4 shows the mean correlation with the true shared subspace across different settings.Footnote 16 We see that, across settings, either MD2S or V-BIBFA performs the best in recovering the true shared subspace. Particularly, for small N and  $K_{(2)}$, V-BIBFA slightly outperforms MD2S in recovering the first dimension of the shared subspace,
 $Z_{S;1}$. As
 $K_{(2)}$ increases, the estimates in V-BIBFA deteriorate while MD2S improves. This is evidence that, with large outcome data matrices, such as the ones generated by text data, our iterative algorithm is able to recover a latent shared subspace that is closer to the true data generating process than available alternatives. The solid gray line shows that INDSCAL regularly outperforms random noise, but performs notably worse than MD2S and V-BIBFA.
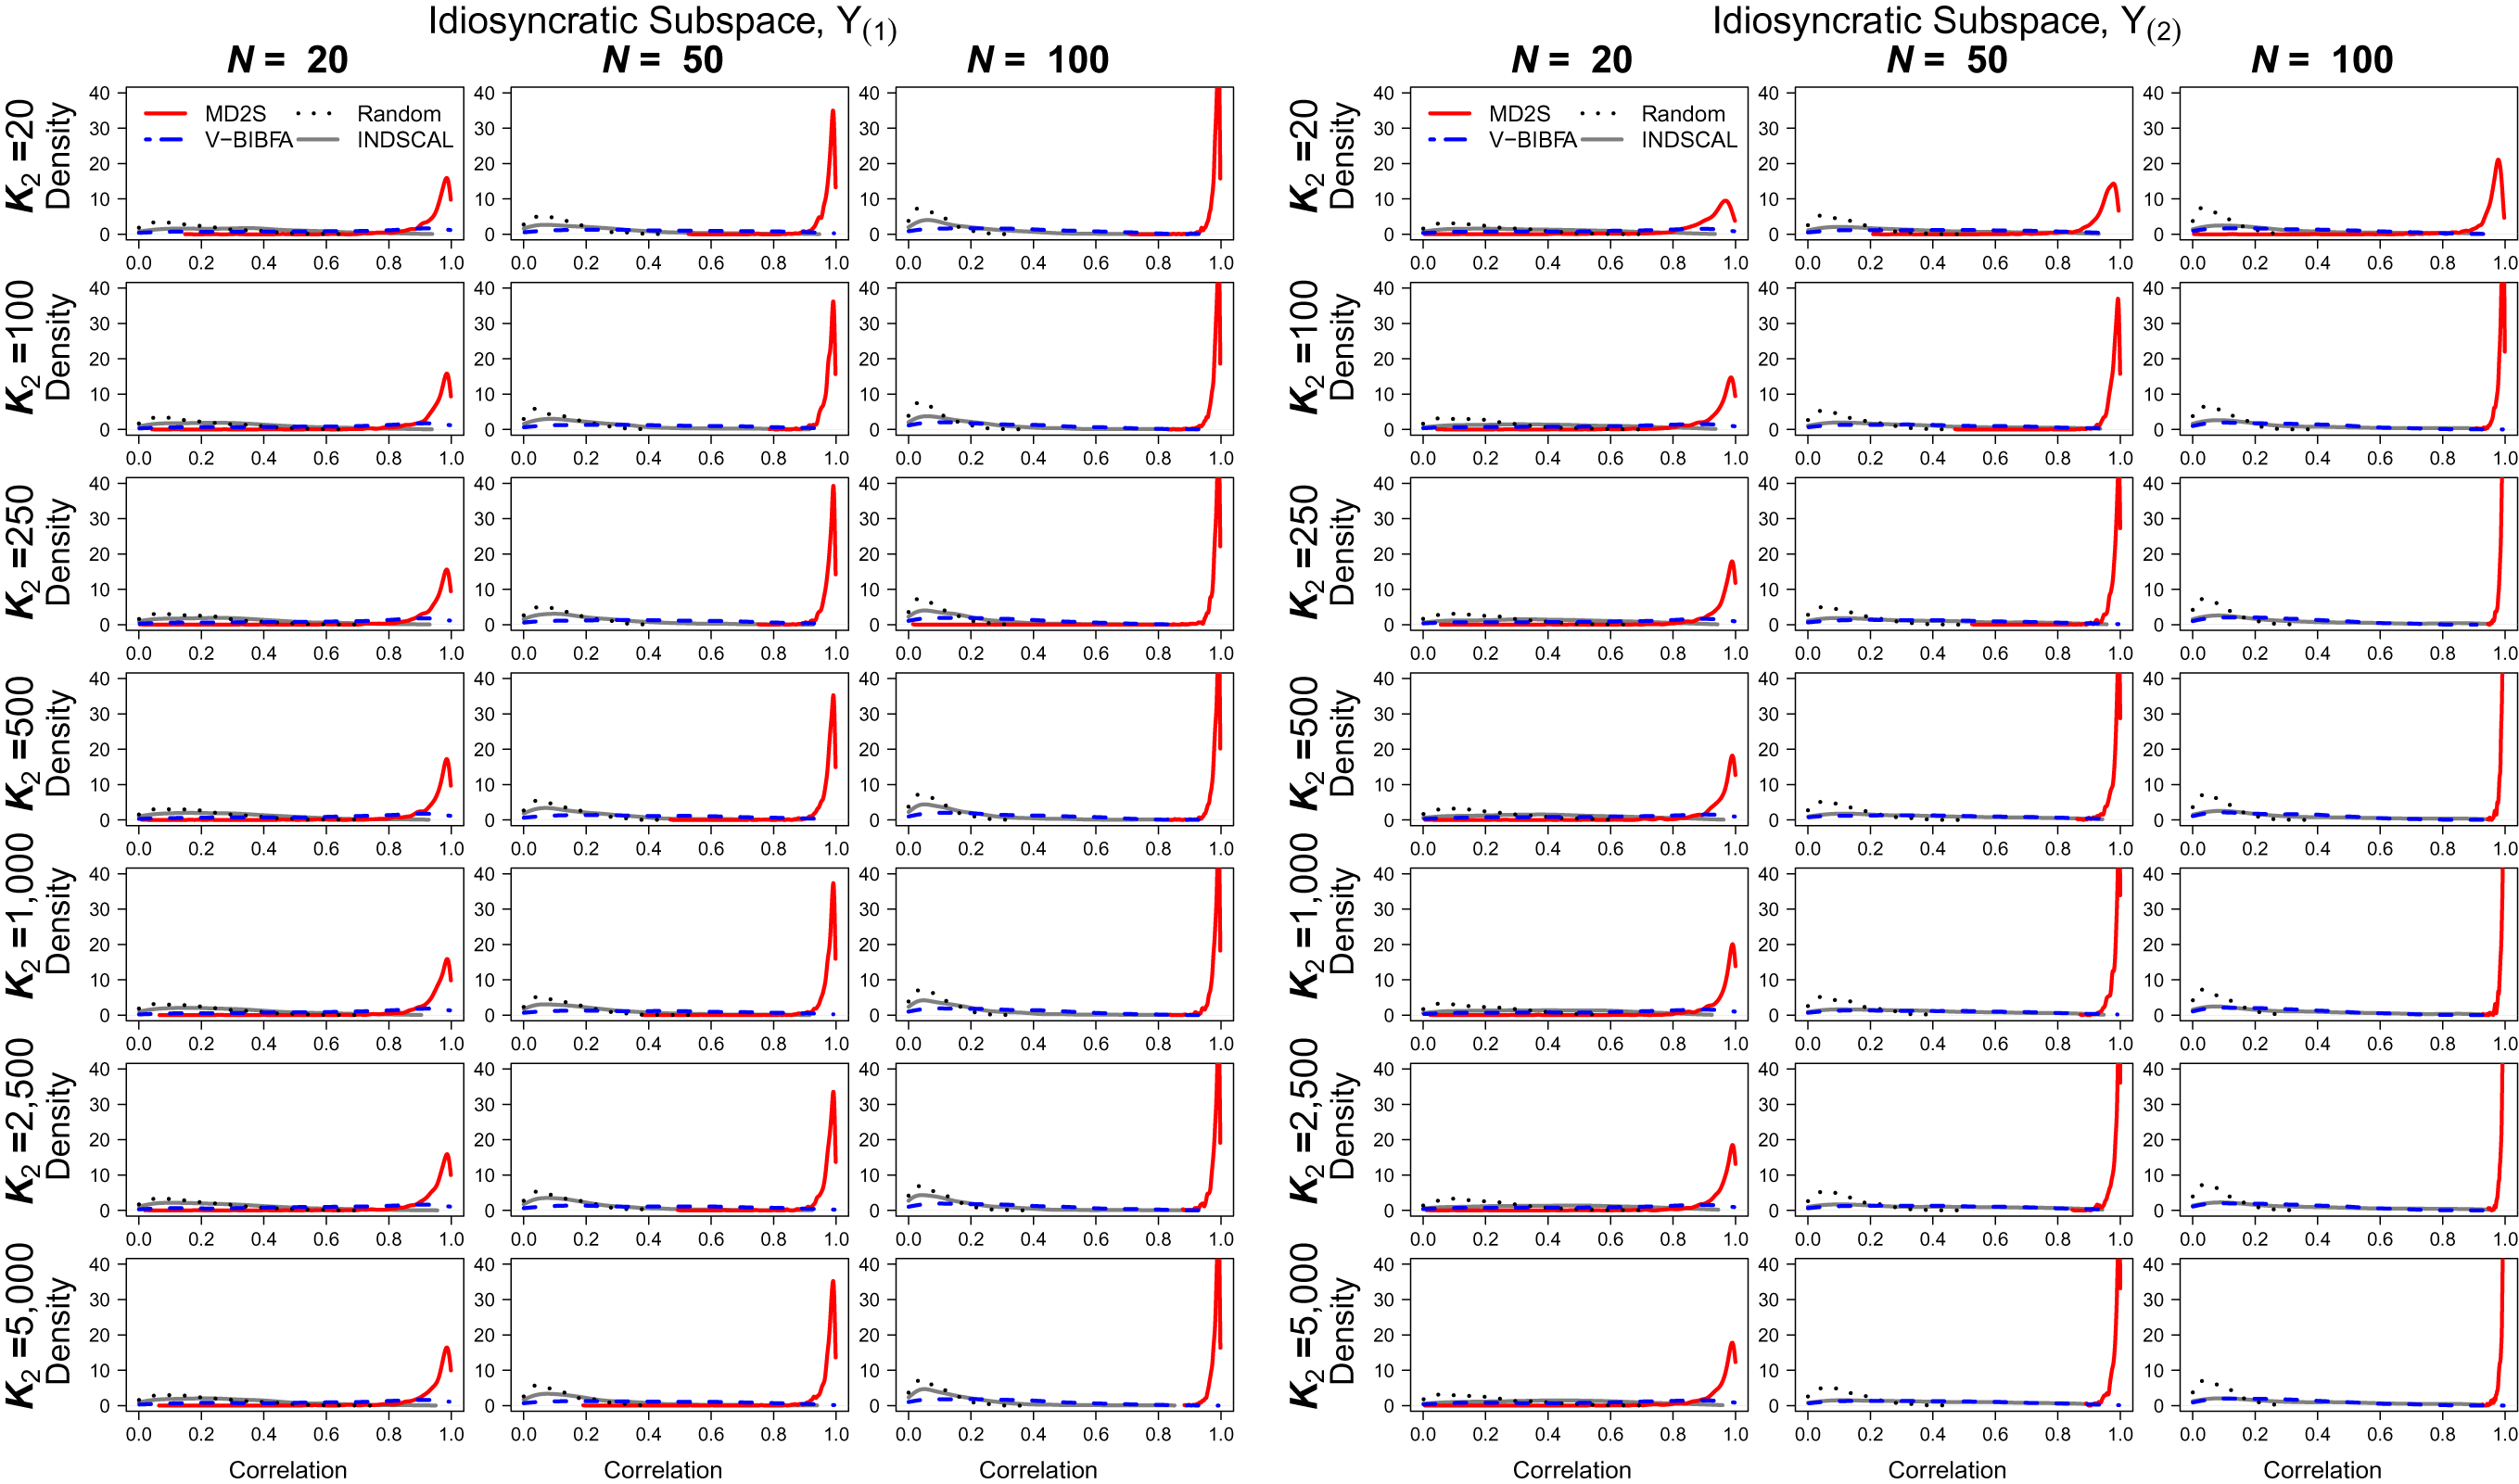
Figure 2 contains the same set of results as Figure 1, but for the first dimension of the idiosyncratic subspaces  $Z_{(1);1}$ from
 $\mathbf {Y}_{(1)}$ (left), and
 $Z_{(2);1}$ from
 $\mathbf {Y}_{(2)}$ (right). Consider the left-side panel. The number of features in
 $\mathbf {Y}_{(1)}$,
 $K_{(1)}$, is fixed across simulations, only
 $K_{(2)}$ is changing. Looking down rows, we see that the MD2S and V-BIBFA results for
 $Z_{(1);1}$ are almost invariant to changes in
 $\mathbf {Y}_{(2)}$. This is desirable: since
 $Z_{(1);1}$ is idiosyncratic to
 $\mathbf {Y}_{(1)}$, we do not want changes in
 $\mathbf {Y}_{(2)}$ to impact its estimate. Overall, INDSCAL’s performance is relatively the worst, with a correlation with
 $Z_{(1);1}$ of just
 $0.2$, whereas the correlation with
 $Z_{(1);1}$ for MD2S and V-BIBFA are 0.97 and 0.91, respectively (with
 $N=50$ and
 $K_{(2)} = 500$).Footnote 17 Looking across columns, as N increases, we see that MD2S performs better than V-BIBFA, with a higher correlation with the true subspace
 $Z_{(1);1}$ across all settings.
Correlation between idiosyncratic locations for  $\mathbf {Y}_{(m)}$ and their estimates, by method. The left and right figures are structured identically to Figure 1. Consider the left figure. Looking down rows, MD2S estimates for
 $Z_{(1);1}$ is invariant to changes in
 $\mathbf {Y}_{(2)}$. Other methods are similarly stable. Looking across columns, as N increases, MD2S performs best. Now, consider the right-hand figure. Looking across columns, all methods improve as N increases. As both N and
 $K_{(2)}$ increase, the performance of V-BIBFA deteriorates, while MD2S improves. For
 $N \in \{50,100\}$ and
 $K_{(2)}> 100$, MD2S is outperforming all other methods in recovering
 $Z_{(2);1}$. When
 $K_{(2)} \ge 1,000$ and
 $N \ge 50$, MD2S recovers
 $Z_{(2);1}$ near exactly, and quite a bit better than all other methods.

Next, consider the right-hand panel. Looking across columns, again, we see MD2S improving as either N or  $K_{(2)}$ increases. As with the case for the shared subspace, the performance of V-BIBFA deteriorates as
 $K_{(2)}$ increases. In fact, MD2S outperforms V-BIBFA in recovering
 $Z_{(2);1}$ across all configurations. Moreover, when
 $K_{(2)} \ge 500$ and
 $N \ge 50$, MD2S recovers
 $Z_{(2);1}$ near exactly and substantially better than all other methods.Footnote 18
The Supplemental Appendix contains additional simulation exercises that show the relative performance of MD2S when we vary relevant features in the data related to bridging, sparsity, and factor correlation across dimensions. Supplemental Appendix B.1 shows evidence that MD2S performs well at jointly estimating scaled locations when we allow actors across datasets to differ and use only common items for scaling. Supplemental Appendix B.2 focuses on adding different levels of sparsity, a common feature in text data. We show that even when sparsity reaches  $80 \%$ of the data, MD2S outperforms other methods in recovering scaled locations. Finally, the Supplemental Appendix B.3 shows the robustness of MD2S when we allow different levels of correlations across dimensions within each subspace.
4.3 Estimating Dimensions
We next illustrate the proposed method’s ability to separate systematic from noise dimensions through the use of the permutation test presented in Section 3.4.
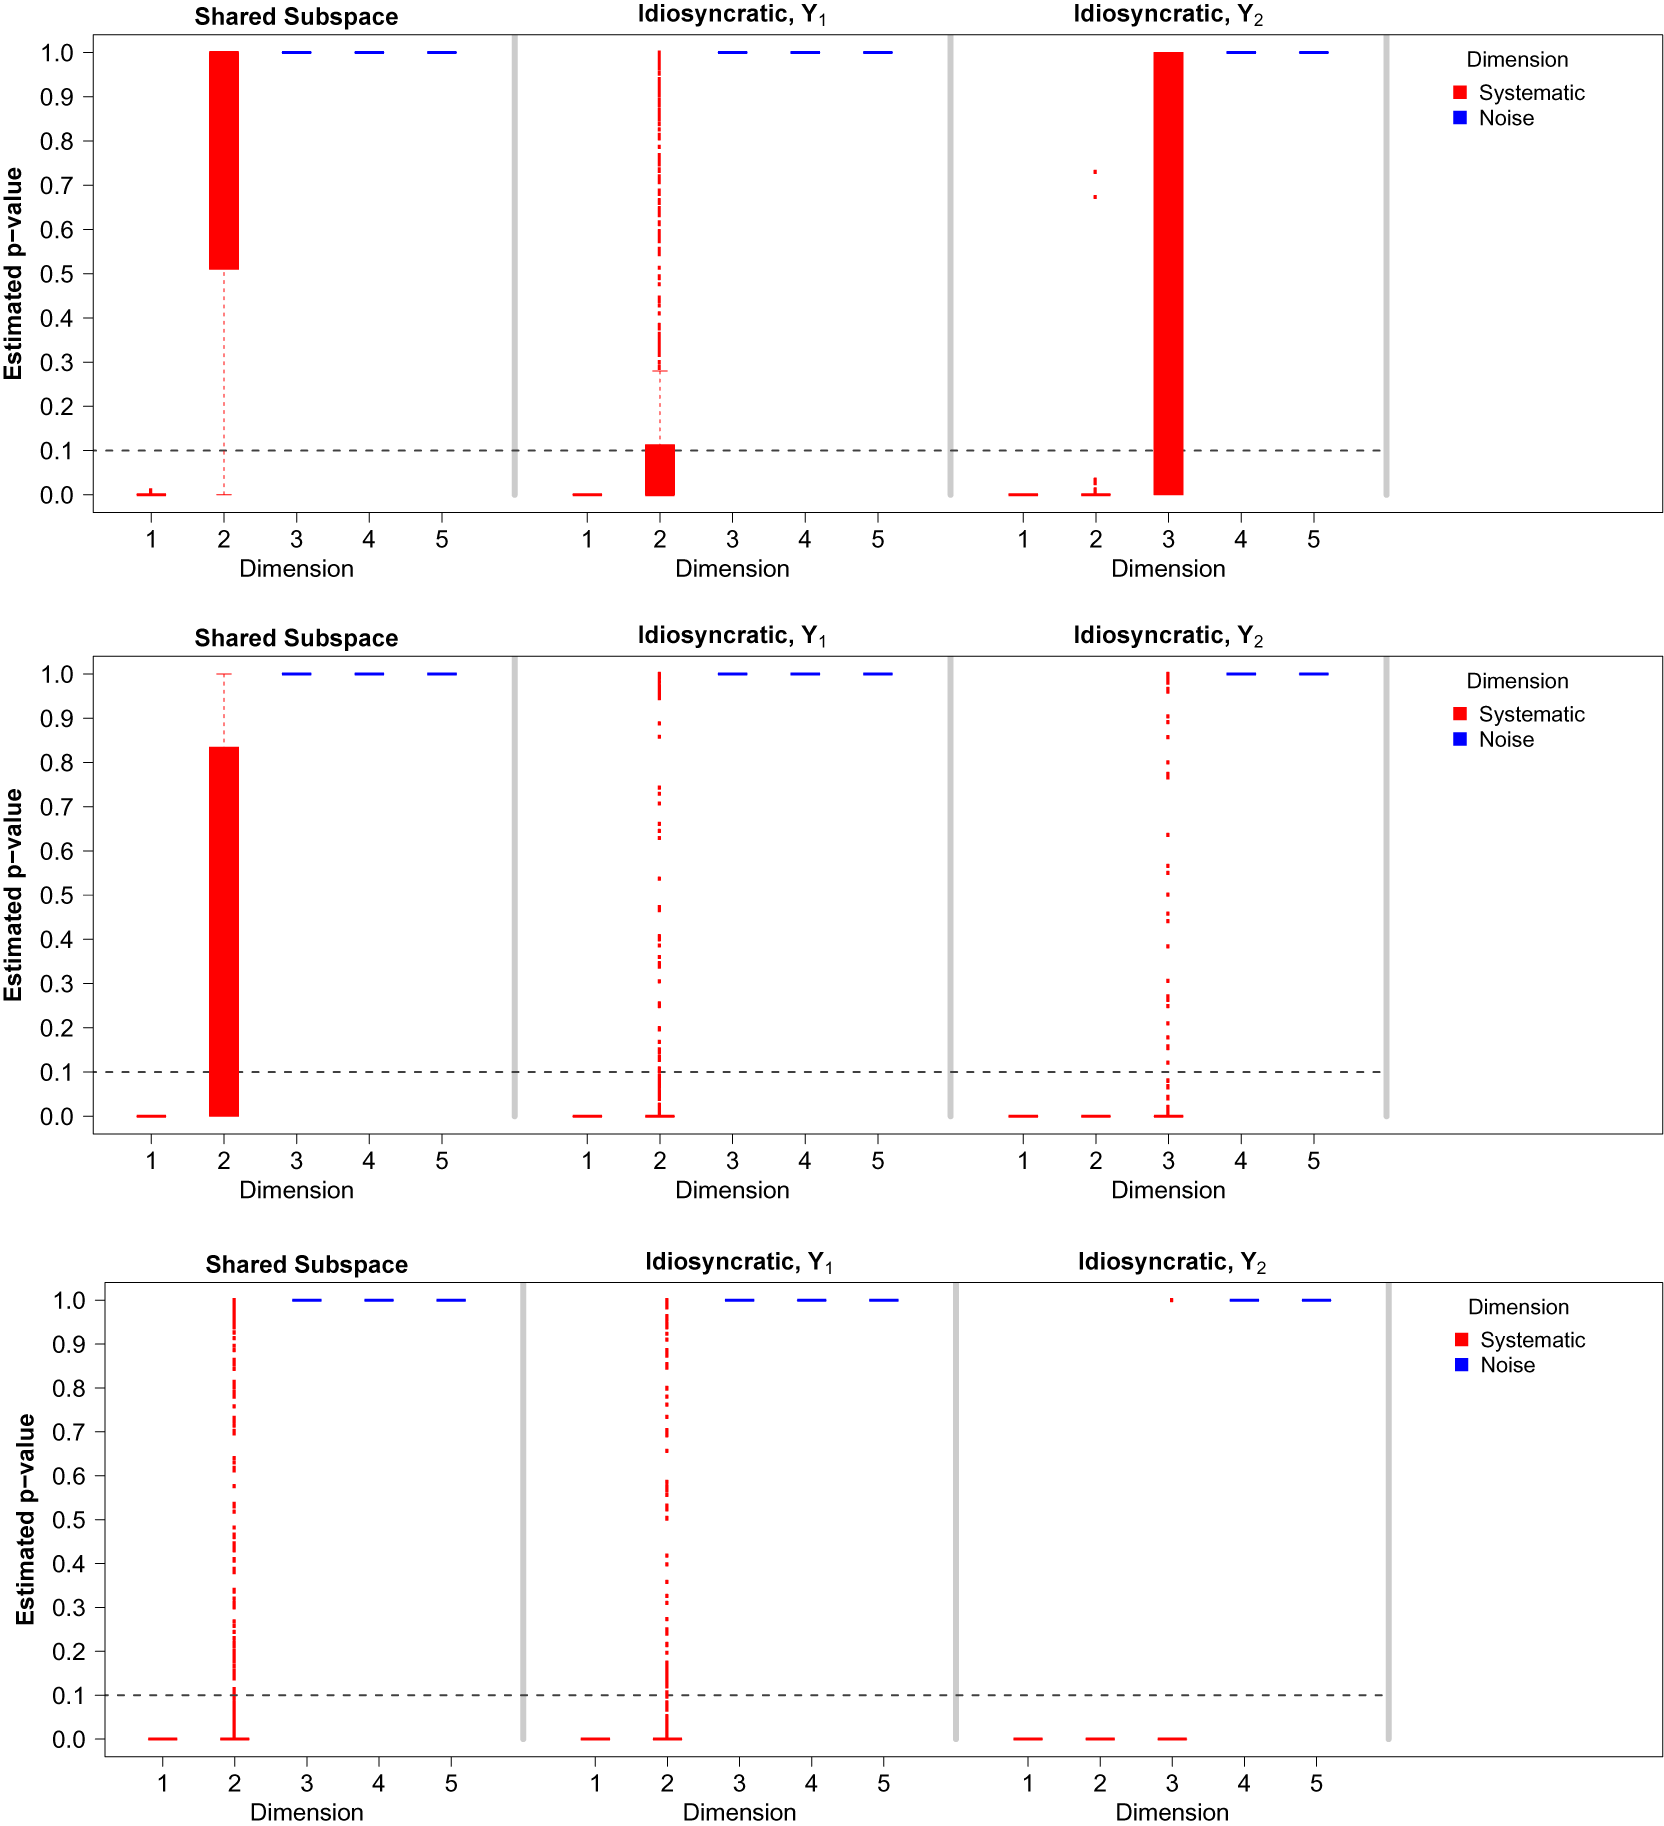
Figure 3 presents the results of the permutation test described in Section 3.4, for which five dimensions were fit to the shared and idiosyncratic subspaces, with  $K_{(1)} = 40$. To evaluate the ability of MD2S to recover the correct number of systematic dimensions per subspace, we use three settings. First, we set
 $N =$ 50 and
 $K_{(2)} = $ 100 in panel (a). Moving from panel (a) to (b), we increased N to 100 but kept
 $K_{(2)}$ fixed at 100. Finally, moving from panel (b) to (c), we kept
 $N =$ 100, but increase
 $K_{(2)}$ to 1,000. For each of the above-mentioned settings, 1,000 total simulations with 1,000 permuted datasets per simulation were used to estimate the p value.
Estimating dimensions. The three panels above present the results from the permutation test for the number of dimensions under three different settings. We use the same data generation process described in section 4, fixing  $K_{(1)} = 40$. For panel (a),
 $N = 50$ and
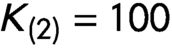 $K_{(2)} = 100$; for panel (b),
 $N = 100$ and
 $K_{(2)} = 100$; and for panel (c),
 $N = 100$ and
 $K_{(2)} = 1,000$. Values in the boxplot that fall below the dotted line at
 $p=$ 0.10 were estimated as systematic dimensions; those above were considered noise. As the three panels show, as we increase both the number of observations N and the number of features (
 $K_{(2)}$) of the larger dataset, MD2S is able to detect the correct dimensionality. Note that for each of the 1,000 simulations per setting, 1,000 permuted datasets were used to recover a p value.

Across panels, if we classify values below  $p =$ 0.10 as successful instances of uncovering signal from noise, MD2S consistently recovers the first dimension of the the shared subspace. However, if the number of observations (N) is small as in panel (a), MD2S recovers the second shared dimension, which is not noise, only 17% of the time. Increasing the number of observations, as done in panel (b), improves MD2S’ ability to recover the second shared dimension, as it is now detected
 $53\%$ of the time. If both N and
 $K_{(2)}$ are increased, as in panel (c), MD2S classifies the second shared subspace as signal 83% of the time.
A similar but less pronounced pattern, is observed for the two idiosyncratic subspaces. The noise dimensions, 3–5 in  $\mathbf {Y}_{(1)}$ and 4 and 5 in
 $\mathbf {Y}_{(2)}$ are never selected. However, dimensions 2 for
 $\mathbf {Y}_{(1)}$ and 3 for
 $\mathbf {Y}_{(2)}$ which contain systematic information, are difficult to recover for MD2S when both N and
 $K_{(2)}$ are small. In panel (a), MD2S correctly classifies dimensions 2 of
 $\mathbf {Y}_{(1)}$ and 3 of
 $\mathbf {Y}_{(2)}$ as signal
 $73\%$ and
 $46\%$ of the time, respectively. If the number of observations and features of our larger dataset are increased, as in panel (c), then MD2S correctly classifies dimension 2 of
 $\mathbf {Y}_{(1)}$ as signal 93% of the time, while dimension 3 of
 $\mathbf {Y}_{(2)}$ is always correctly classified as signal.
5 Combining Senate Roll Call and Text Data
In this empirical exercise, we apply MD2S to data from speech and roll call votes in the 112th U.S. Senate. The data consist of a term document matrix of  $2,532$ unique terms constructed from senators’ floor speech found in the Congressional Record, as well as the final roll call vote matrix of
 $486$ binary votes taken during this session.Footnote 19 The data was previously analyzed using the Sparse Factor Analysis (SFA) methodology introduced in Kim et al. (Reference Klami, Virtanen and Kaski2018), who found two dimensions in the space jointly informed by words and votes. The primary dimension was qualitatively the same as the ideological dimension identified by any common scaling method applied to roll call votes from the U.S. Senate (e.g. Clinton et al., Reference Clinton, Jackman and Rivers2004, Figure 1). The second dimension was a “leadership” dimension ranging from party leaders, on one end, to rank and file members on the other.
We present the results obtained from MD2S in two parts. First, we use our permutation test to assess which latent dimensions may not be noise. Second, we examine the substance of the scaled locations in the first shared subspace informed by both words and votes, as well as the first idiosyncratic dimensions specific to each type of data. We show the point estimates of the scaled locations for each senator in the results below. Results of the bootstrapped confidence intervals as described in Section 3.4 can be found in the Supplemental Appendix B.5.4.
We inform the scaled locations with available senators’ characteristics.Footnote 20 In particular, we allow the latent variables to be a function of senators’ party, gender, and seniority. We also account for measures of the number and type of committee assignments of each senator in this session.Footnote 21 We include membership, which is given by the total number of committees a senator belongs to. The variable leadership is a representation of the number of committees where a senator holds a leadership position. The remaining covariates: agricultural, economics, and security, measure the proportion of committees a senator belongs to that deal with these issues.Footnote 22 In the Supplemental Appendix B.5.5, we recover the estimated coefficients associated to each subspace on the set of senators’ covariates.
Estimating Dimensionality
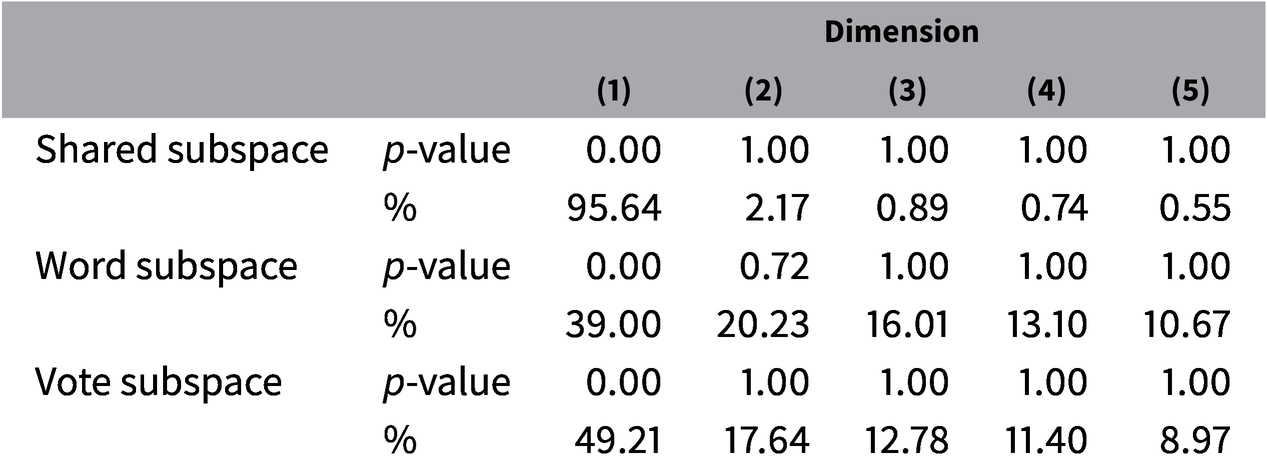
Table 1 presents the results from the permutation test presented in Section 3.4 applied to the Senate data. The table contains the results for the shared subspace and the two idiosyncratic dimensions on 5,000 permuted datasets.
Permutation test. % represents the percentage of explained variance for each dimension. Using any p value threshold between  $0.01$ and
 $0.71$ gives us two dimensions for the shared subspace and three for the idiosyncratic word and votes subspaces. Number of permuted datasets: 5,000.

Using any p value threshold between  $0.01$ and
 $0.71$ gives us one statistically significant dimension across the shared and idiosyncratic subspaces. In terms of explained variance, the first shared subspace explains most of the joint variance across votes and words (i.e.,
 $96 \%$). For the idiosyncratic subspaces the first dimension explains 49
 $\%$ and 39
 $\%$ of the variance unique to votes and words, respectively.
Scaled Locations
Since we are placing the words and the senators in the same subspace, words at one extreme are most used by legislators at the same extreme. Thus, connecting the words with the legislators greatly aids in interpretation, as we do not only have the locations of the legislators to go by in ascertaining the substantive meaning of the dimension.
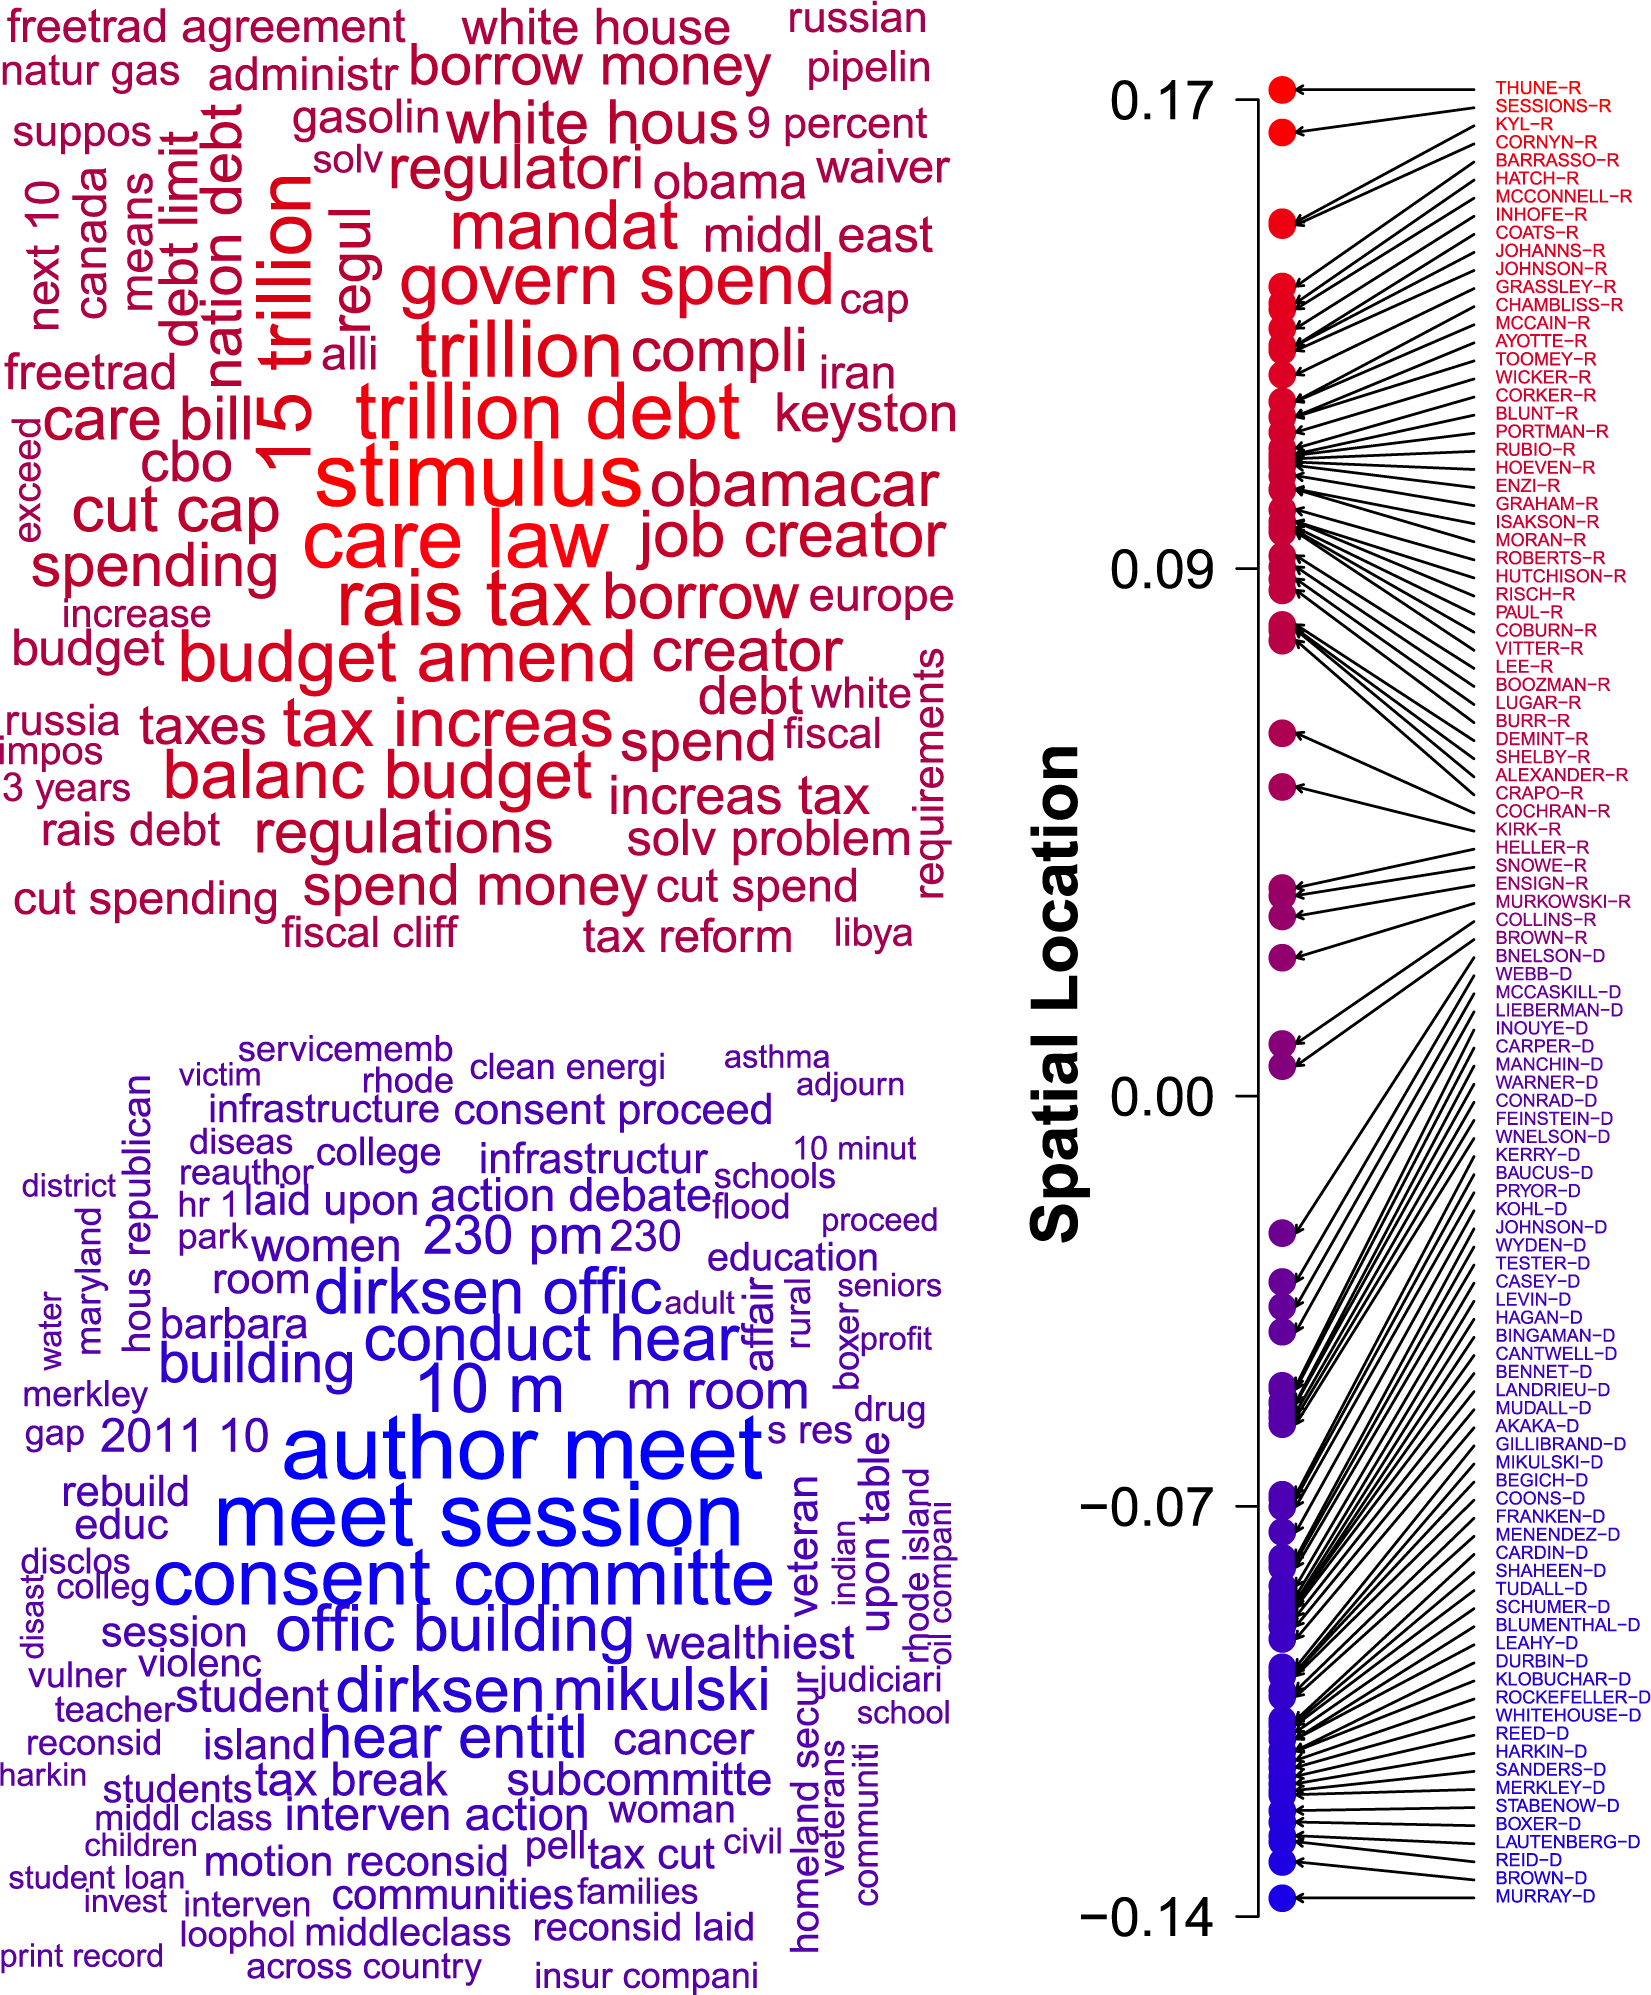
We present the scaling estimates of the first shared dimension in Figure 4. On the left panel, we present word clouds containing the top 100 positive (in red) and top 100 negative (in blue) words according to their weights in the estimated matrix of factors for the text data,  $\widehat {\mathbf {W}}_{(words)}$. The size and color intensity of each word in the wordclouds are proportional to the absolute value of the estimated weights, so words of one color are estimated as near legislators of the same color.
Shared subspace locations estimated via MD2S for the members of the 112th U.S. Senate.

The right panel of Figure 4 presents the estimated location of senators in the shared subspace  $\hat {\mathbf {Z}}_S$. For the shared subspace, we find the estimated weights balancing the proportion of information coming from votes and words to be, on average,
 $33\%$ and
 $67\%$, respectively.Footnote 23
The shared subspace differentiates the party, placing Republicans towards the top and Democrats towards the bottom. Our estimates are highly correlated with the SFA ideal point estimates at  $0.97$. With respect to scaling approaches using only data on roll call votes, our first shared dimension correlates with DW-NOMINATE (Poole, Reference Quinn2005) and IDEAL (Clinton et al., Reference Clinton, Jackman and Rivers2004) at
 $0.94$ and
 $0.95$, respectively. Therefore, the shared scale is consistent with the ideological dimension uncovered from a spatial vote choice model and from its extension to word choice.Footnote 24
These correlations serve as a validation exercise, as DW-NOMINATE and IDEAL have proven to be robust methods to extract information exclusively from roll call votes. Thus, by adding words into the equation in a structured fashion, MD2S is able to recover other interesting patterns, while also recovering the expected ideological dimension from the vote data obtained by popular methods such as DW-Nominate and IDEAL.Footnote 25
The words anchoring each dimension are similar to those identified in Kim et al. (Reference Klami, Virtanen and Kaski2018, see figure 3, righthand plot). In particular, we find parliamentary control terms on the side associated with the governing Democratic majority (meet session, author meet, conduct hear) with fiscal terms on the side associated with the Republican minority, (stimulus, trillion, budget, rais tax, and debt) commensurate with the party’s professed fiscal concerns. If we move past the parliamentary terms, the first set of substantive terms on the Democratic side are also fiscal in nature but diametrically opposite the Republicans: wealthiest, middleclass, tax break, tax cut, and hear entitl. Therefore, by recovering the associated terms with each scaled location, we find that the first shared dimension captures well the main differences between Democrats and Republicans in terms of fiscal policy, as identified by the words most associated with each side of the scale.
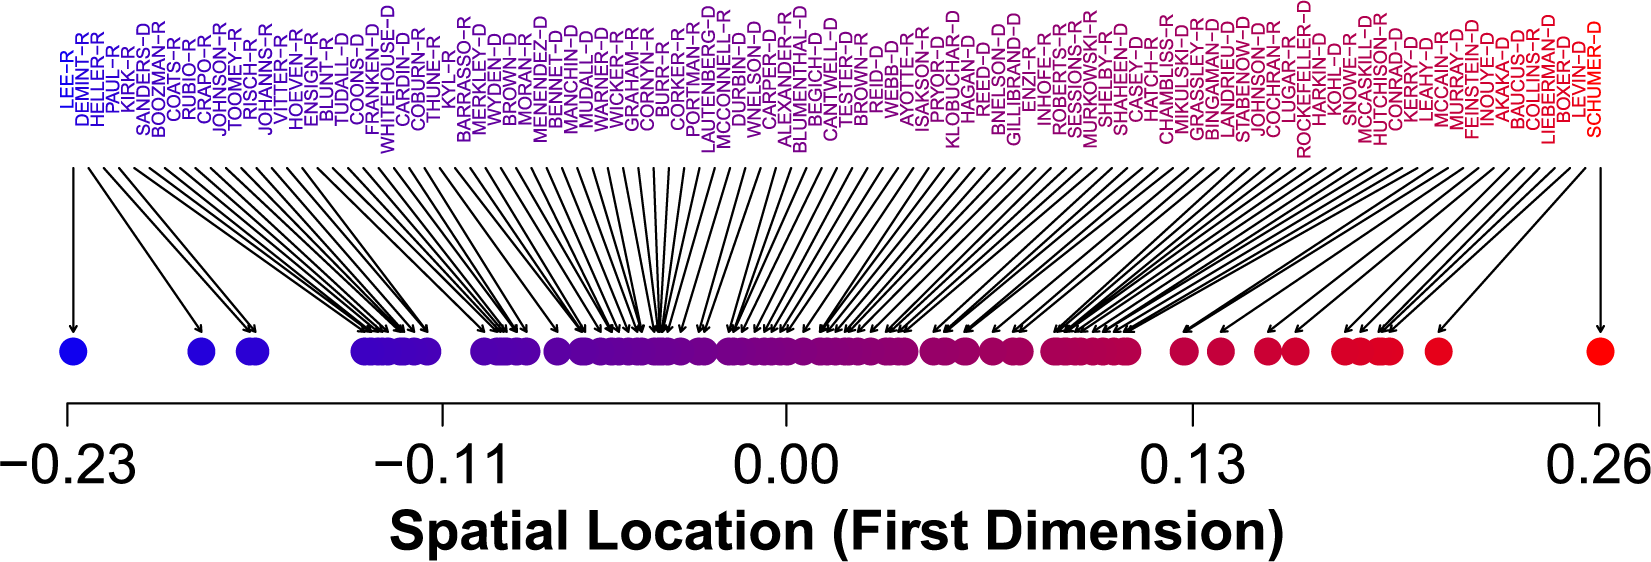
In terms of idiosyncratic subspaces, we first focus our attention on the vote subspace. As illustrated by Figure 5, we find a significant first dimension that organizes voting, but is unrelated to floor speech. On one extreme, this dimension is anchored by fiscal conservative senators DeMint, Lee, Toomey, Paul, and Risch, noted Tea Party and small government enthusiasts. In terms of the covariates included in the estimation, senators assigned to a leadership position in committees related to agricultural and economic issues are significantly correlated with this extreme of the scale. The other extreme of the vote subspace is anchored by prominent and more moderate senior senators like Schumer, Boxer, and Collins, who have been reelected at least once and hold a leadership position in a Senate committee. As shown in the Supplemental Appendix, we find that seniority and more leadership assignments, as well as membership in committees focused on national security issues, are systematically associated with positive locations in the vote subspace.
Idiosyncratic vote subspace locations estimated via MD2S for the members of the 112th U.S. Senate.

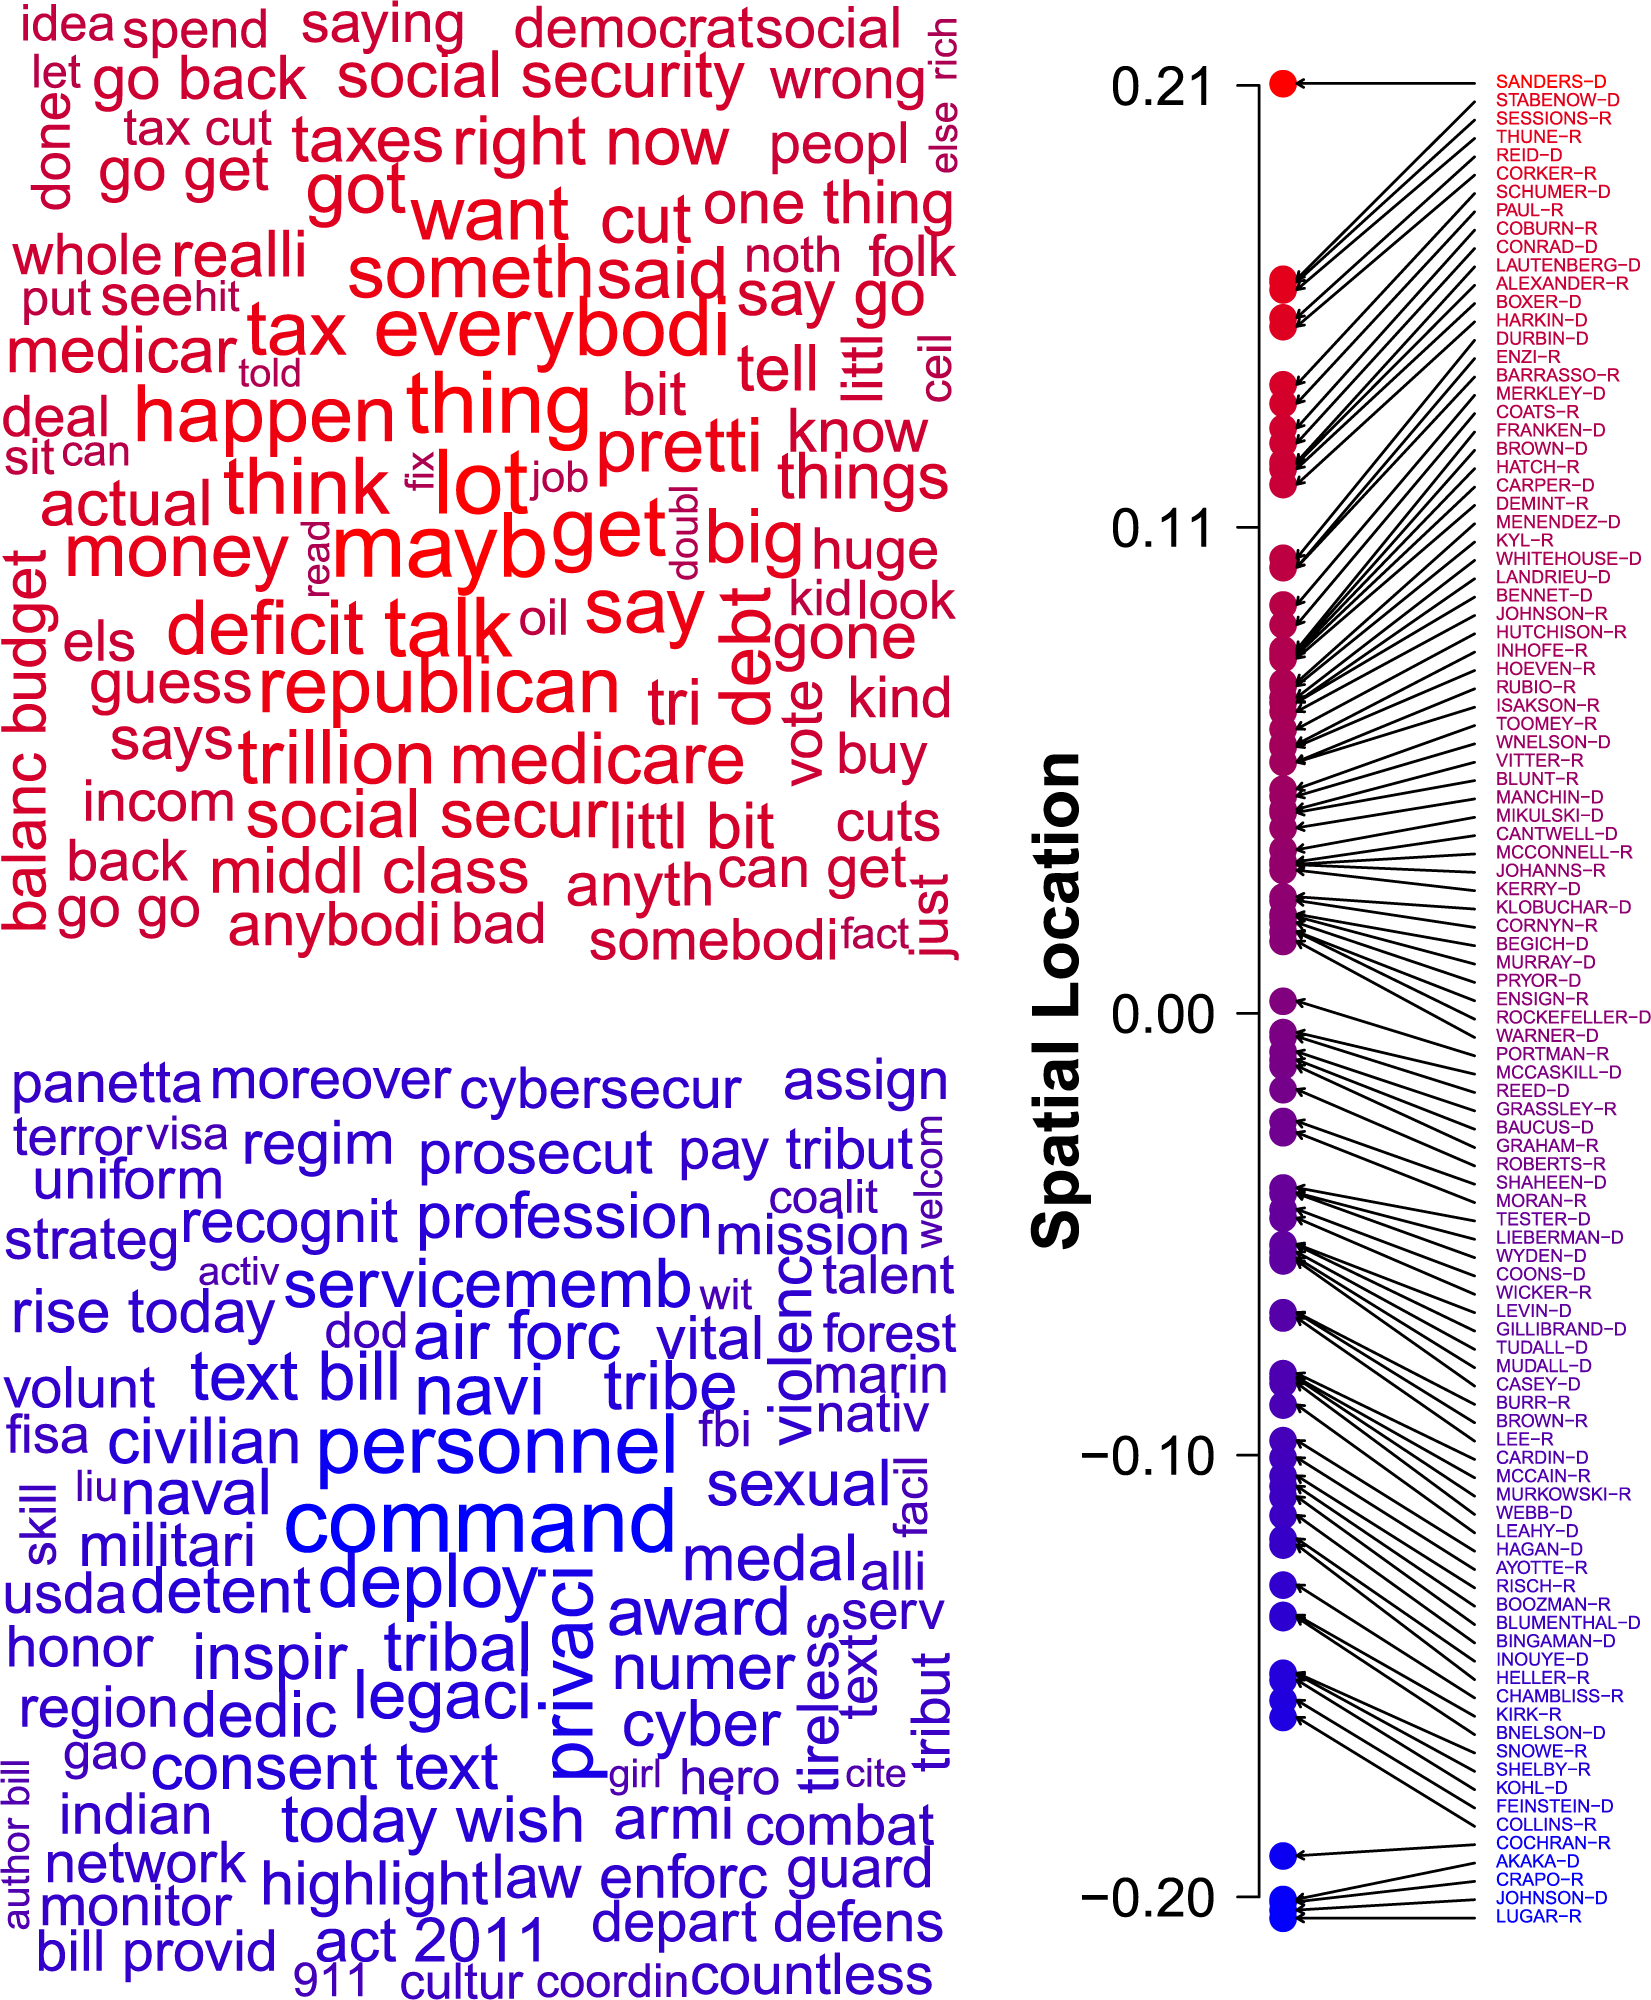
Similar to the results for the shared subspace, Figure 6 shows senators’ locations in the first dimension of the word subspace along with the word clouds of the top 100 words associated with each side of the scale given by the estimated text factor  $\widehat {\mathbf {B}}_{(\mathit{words})}$. In terms of the scaled locations, we have on one end, senators who put emphasis on national security issues, such as prominent members of the Committees on Armed Services and Homeland Security, as well as Governmental Affairs like senators Johnson, Akaka, and Collins. The associated terms on this extreme relate to the military (e.g, command, deploy, navi, and air forc), as well as personnel and privacy-protection issues (e.g., privaci, personnel, andcivilian). The opposite side of the words subspace is anchored by senators of both parties (Sanders, Stabenow, Sessions and Thune) addressing budget issues, with associated terms such as tax, deficit, debt, money, and medicare.
Idiosyncratic word subspace locations estimated via MD2S for the members of the 112th U.S. Senate. First dimension.

Notice that the estimated locations in these idiosyncratic vote and words dimensions allows us to further differentiate senators found to be moderate in the shared dimension, but that have substantive differences specific to either their roll-call or floor speech behavior.
6 Conclusion
As we enter a period of “big data,” we encourage political scientists to think not just of analyzing large datasets, but also how to combine data from disparate sources. We present such a method here, for scaling data from two separate datasets. The method, MD2S, successfully incorporates information from two different data sources, generating scaled locations with a higher internal validity than analyzing the two datasets separately. We include methods for checking validity, separating systematic dimensions from noise, and a way to relate scaled locations to covariates, all fit using an efficient statistical algorithm.
The method also allows the user to use the scaled locations from both datasets to help infer the meaning of the latent dimensions. In our empirical application, scaled locations were also associated with words that let us better interpret the meaning of the estimated latent scales. The idiosyncratic subspaces also offers new insights, allowing us to identify dimensions in which the members at the extremes of the shared subspace differed.
We anticipate several ways in which this project can be moved forward. First, we have presented the method in a geometric, least squares framework. Placing the method in a probabilistic framework will allow for an extension to commonly used Bayesian techniques (Hare et al., Reference Hastie, Tibshirani and Friedman2015; Tipping and Bishop, Reference Tucker1999). We also plan to extend the method to allow for cross-time comparisons, so as to place multiple observations in the same space over time. As noted above, an important avenue of future research is to scale information coming from more than two datasets, for example, scaling Senators’ roll calls, floor speeches, and social media statements. In principle, our framework and identification assumptions can be generalized to multiple databases. We leave for future research an empirical implementation of this extension to the method.
A Proof of Proposition 1
We first derive score conditions for the IBFA, extending the model of Tipping and Bishop (Reference Tucker1999). We then implement a Minorize-Maximization (MM) algorithm for estimation (for the use of this class of algorithm in scaling, see Borg and Groenen, Reference Borg and Groenen2005). The estimation procedure works by deriving a minorizing function that lies weakly below the true objective, maximizes, and iterates to convergence.Footnote 26
The Model and Likelihood
This section follows Tipping and Bishop (Reference Tucker1999). The two datasets,  $\mathbf {Y}_{(1)}$ and
 $\mathbf {Y}_{(2)}$ are modeled in terms of a shared subspace
 $\mathbf {Z}_S$ as well as dataset specific subspaces,
 $\mathbf {Z}_{(1)}$ and
 $\mathbf {Z}_{(2)}$, such that for column j:
 $$ \begin{align} Y_{(m),\bullet, j} | W_{(m), j, \bullet}, B_{(m), j, \bullet}, \mathbf{L}_{(m)}, \mathbf{D}_{(m)} &\sim \mathcal{N}(\mathbf{Z}_S \mathbf{L}_{(m)} W^{\top}_{(m), j, \bullet} + \mathbf{Z}_{(m)} \mathbf{D}_{(m)} B^{\top}_{(m), j, \bullet} ; \sigma^2_{(m)} \mathbf{I}_N) \end{align} $$
for  $m\in \{1,2\}$. Marginalizing over
 $W_{(m), j, \bullet }$ and
 $B_{(m), j, \bullet }$, gives the unconditional densities for the vector
 $Y_{(m), \bullet , j}$ as
 $$ \begin{align} Y_{(m), \bullet, j} \sim \mathcal{N}(\mathrm{0}_N, \mathbf{C}_{(m)}), \end{align} $$
where, for  $m \in \{1, 2\}$, the symmetric
 $N \times N$ matrix,
 $\mathbf {C}_{(m)} = \mathbf {Z}_S \mathbf {L}_{(m)}^2 \mathbf {Z}_S^\top + \mathbf {Z}_{(m)} \mathbf {D}_{(m)}^2 \mathbf {Z}_{(m)}^\top + \sigma ^2_{(m)} \mathbf {I}_N$.
The data log-likelihood as a function of  $\{ \mathbf {Z}_S, \mathbf {Z}_{(1)}, \mathbf {Z}_{(2)}, \mathbf {L}_{(1)}, \mathbf {L}_{(2)}, \mathbf {D}_{(1)} , \mathbf {D}_{(2)} \}$ can be written as
 $$ \begin{align} \nonumber &\ell \left(\mathbf{Z}_S, \mathbf{Z}_{(1)}, \mathbf{Z}_{(2)}, \mathbf{L}_{(1)}, \mathbf{L}_{(2)}, \mathbf{D}_{(1)} , \mathbf{D}_{(2)} | \mathbf{Y}_{(1)}, \mathbf{Y}_{(2)}\right) =\\ & -\frac{1}{2}\left\{N(K_{(1)} + K_{(2)}) \log\left(2 \pi\right) - K_{(1)} \log\left(| \mathbf{C}_{(1)} |\right) - K_{(2)} \log\left(| \mathbf{C}_{(2)} |\right) - \mathrm{tr}\left(\mathbf{Y}_{(1)} \mathbf{Y}_{(1)}^\top \mathbf{C}_{(1)}^{-1} +\mathbf{Y}_{(2)} \mathbf{Y}_{(2)}^{\top} \mathbf{C}_{(2)}^{-1}\right) \right\}. \end{align} $$
Denoting  $\mathbf {L}_{(2)}^2=\lambda ^2 \mathbf {L}_{(1)}^2$, the score conditions for the shared subspace model are
 $$ \begin{align} \frac{\partial \ell(\cdot) }{\partial \mathbf{Z}_S}& = \left\{\frac{1}{2} \left(K_{(1)} \mathbf{C}_{(1)}^{-1} + K_{(2)} \mathbf{C}_{(2)}^{-1}\right) - \frac{1}{2} \left\{\mathbf{C}_{(1)}^{-1} \mathbf{Y}_{(1)} \mathbf{Y}_{(1)}^\top \mathbf{C}_{(1)}^{-1} + \lambda^2 \mathbf{C}_{(2)}^{-1} \mathbf{Y}_{(2)} \mathbf{Y}_{(2)}^\top \mathbf{C}_{(2)}^{-1} \right\} \right\} \mathbf{Z}_S \mathbf{L}_{(1)}^2 , \end{align} $$
 $$ \begin{align} \frac{\partial \ell(\cdot) }{\partial \mathbf{Z}_{(m)}}& =\left\{ \frac{1}{2} K_{(m)} \mathbf{C}_{(m)}^{-1} - \frac{1}{2} \mathbf{C}_{(m)}^{-1} \mathbf{Y}_{(m)} \mathbf{Y}_{(m)}^\top \mathbf{C}_{(m)}^{-1} \right\} \mathbf{Z}_{(m)} \mathbf{D}_{(m)}^2. \end{align} $$
It may appear at first that  $\mathbf {Z}_{(m)}$ and
 $\mathbf {Z}_S$ are solutions to an eigen problem of the form
 $\mathbf {A} \mathbf {Z} = \lambda \mathbf {Z}$. This does not immediately follow from Equations (23) and (24), though, because
 $\mathbf {Z}_{(m)}$ and
 $\mathbf {Z}_{S}$ enter into
 $\mathbf {C}_{(m)}$ nonlinearly. The work in the proof below comes from using the identification conditions (Equations 6–10) and making use of the Woodbury identity to isolate
 $\mathbf {Z}_S$ in
 $\mathbf {C}_{(m)}^{-1}$. With this done, it is apparent that the maximum likelihood estimates are indeed singular vectors. We formalize that result in the Proposition 1, which is given in the text.
Proof of Proposition 1
1. We proceed in two steps. First, we simplify the term
$\mathbf {C}_{(m)}^{-1} \mathbf {Z}_{(m)} \mathbf {D}_{(m)}^2$, leaving it a function of only $\mathbf {Z}_{(m)}$ and not $\mathbf {Z}_{S}$. Second, we substitute this simplified term back into the score conditions, showing that $\mathbf {Z}_{(m)}$ are singular vectors. First, denote $\tilde {\mathbf {A}} = (\mathbf {Z}_{(m)} \mathbf {D}_{(m)}^2 \mathbf {Z}_{(m)}^\top + \sigma ^2_{(m)} \mathbf {I}_N)$ and $\tilde {\mathbf {U}} = (\mathbf {L}_{(m)}^{-2} + \mathbf {Z}_S^\top \tilde {\mathbf {A}}^{-1} \mathbf {Z}_S)$. Then, $$ \begin{align*} \mathbf{C}_{(m)}^{-1} \mathbf{Z}_{(m)} \mathbf{D}_{(m)}^2 &= \mathbf{C}_{(m)}^{-1} \mathbf{M}(\mathbf{Z}_S) \mathbf{Z}_{(m)} \mathbf{D}_{(m)}^2 \qquad \qquad \qquad \qquad \qquad \qquad \qquad \mathbf{Z}_S \perp \mathbf{Z}_{(m) } \nonumber \\ &= \left\{\tilde{\mathbf{A}}^{-1} - \tilde{\mathbf{A}}^{-1} \mathbf{Z}_S \tilde{\mathbf{U}}^{-1} \mathbf{Z}_S^\top \tilde{\mathbf{A}}^{-1} \right\} \mathbf{M}(\mathbf{Z}_S) \mathbf{Z}_{(m)} \mathbf{D}_{(m)}^2 \qquad \qquad {\text{Woodbury identity to }} \mathbf{C}_{(m)}^{-1}\nonumber\\ &= (\mathbf{Z}_{(m)} \mathbf{D}_{(m)}^2 \mathbf{Z}_{(m)}^\top+\sigma^2_{(m)} \mathbf{I}_N)^{-1} \mathbf{M}(\mathbf{Z}_S) \mathbf{Z}_{(m)} \mathbf{D}_{(m)}^2 \end{align*} $$where the last line follows from distributing and that
$\tilde {\mathbf {A}}^{-1}$ is not a function of $\mathbf {Z}_S$, leaving the second summand linear in $\mathbf {Z}_S$ and therefore annihiliated by $\mathbf {M}(\mathbf {Z}_S)$. We further simplify through reapplying the Woodbury identity to $(\mathbf {Z}_{(m)} \mathbf {D}_{(m)}^2 \mathbf {Z}_{(m)}^\top +\sigma ^2_{(m)} \mathbf {I}_N)^{-1}$: $$ \begin{align*} &= \frac{1}{\sigma^2_{(m)}} \left\{\mathbf{I}_N - \mathbf{Z}_{(m)}\left(\sigma^2_{(m)} \mathbf{D}_{(m)}^{-2} + \mathbf{Z}_{(m)}^\top \mathbf{Z}_{(m)}\right)^{-1} \mathbf{Z}_{(m)}^\top \right\} \mathbf{M}(\mathbf{Z}_S) \mathbf{Z}_{(m)}\mathbf{D}_{(m)}^2 \\ &= \mathbf{M}(\mathbf{Z}_S) \mathbf{Z}_{(m)} \widetilde {\mathbf{D}}_{(m)}, \end{align*} $$where we denote the diagonal matrix
$\widetilde {\mathbf {D}}_{(m)} = \frac {1}{\sigma ^2_{(m)}} \{\mathbf {I}_{Q_{(m)}}- (\sigma ^2_{(m)} \mathbf {D}_{(m)}^{-2} + \mathbf {I}_{Q_{(m)}})^{-1}\} \mathbf {D}^2_{(m)} $. That this matrix is diagonal is crucial to our result, illustrating where the advantage of the probabilistic PCA enters our results.Substituting into the score conditions gives: $$ \begin{align*} & K_{(m)} \mathbf{C}_{(m)}^{-1} \mathbf{Z}_{(m)} -\frac{1}{\sigma^2_{(m)}} \mathbf{C}_{(m)}^{-1} \mathbf{Y}_{(m)} \mathbf{Y}_{(m)}^\top \mathbf{M}(\mathbf{Z}_S) \mathbf{Z}_{(m)} \widetilde {\mathbf{D}}_{(m)} = 0_{N \times Q_m} \nonumber \\ &\Rightarrow K_{(m)} \mathbf{Z}_{(m)} -\frac{1}{\sigma^2_{(m)}} \mathbf{Y}_{(m)} \mathbf{Y}_{(m)}^\top \mathbf{M}(\mathbf{Z}_S) \mathbf{Z}_{(m)} \widetilde {\mathbf{D}}_{(m)} = 0_{N \times Q_m} &\mathrm{Premultiply\ } \mathbf{C}_{(m)} \nonumber \\ &\Rightarrow K_{(m)} \mathbf{M}(\mathbf{Z}_S) \mathbf{Z}_{(m)} - \frac{1}{\sigma^2_{(m)}} \mathbf{M}(\mathbf{Z}_S) \mathbf{Y}_{(m)} \mathbf{Y}_{(m)}^\top \mathbf{M}(\mathbf{Z}_S) \mathbf{Z}_{(m)} \widetilde {\mathbf{D}}_{(m)} = 0_{N \times Q_m} &\mathrm{Premultiply\ } \mathbf{M}(\mathbf{Z}_S) \nonumber \\ &\Rightarrow K_{(m)} \mathbf{Z}_{(m)} - \frac{1}{\sigma^2_{(m)}} \mathbf{M}(\mathbf{Z}_S) \mathbf{Y}_{(m)} \mathbf{Y}_{(m)}^\top \mathbf{M}(\mathbf{Z}_S) \mathbf{Z}_{(m)} \widetilde {\mathbf{D}}_{(m)} = 0_{N \times Q_m} &\mathbf{M}(\mathbf{Z}_S)\mathbf{Z}_{(m)} = \mathbf{Z}_{(m)} \nonumber \\ &\Rightarrow K_{(m)} \mathbf{Z}_{(m)} \mathbf{I}_{Q_{(m)}} - \frac{1}{\sigma^2_{(m)}} \mathbf{V}_{(m)} \mathbf{Z}_{(m)} \widetilde {\mathbf{D}}_{(m)}= 0_{N \times Q_m}, \nonumber \end{align*} $$where we define
$\mathbf {V}_{(m)} \equiv \mathbf {M}(\mathbf {Z}_S) \mathbf {Y}_{(m)} \mathbf {Y}_{(m)}^{\top } \mathbf {M}(\mathbf {Z}_S) $ in the last line. Considering this last equality columnwise shows that each column of $\mathbf {Z}_{(m)}$ is a singular vector of $\mathbf {V}_{(m)}$, which was to be shown.2. Denote
$\mathbf {Z}_{S | (m)}$ as the first $Q_S$ principal components of $\mathbf {Y}_{(m)}^\top \mathbf {M}(\mathbf {Z}_{(m)})$. To prove part (a), just repeat the proof for point 1 using $\mathbf {M}(\mathbf {Z}_{(1)})$ and $\mathbf {M}(\mathbf {Z}_{(2)})$ in equation (23). Then, by a similar argument, the maximum likelihood estimates of $\mathbf {Z}_S$ are proportional to singular vectors of a weighted average of $\mathbf {Y}_{(1)} \mathbf {Y}_{(1)}^\top $ and $\mathbf {Y}_{(2)} \mathbf {Y}_{(2)}^\top $. To prove part (b), we maximize a minorizing function that lies weakly below the true likelihood function. To generate the minorizing function, note $$ \begin{align*} &\mathbf{Y}_{(m)}^\top \mathbf{Y}_{(m)} \ge \mathbb{E}\left( \mathbf{Y}_{(m)}^\top \mathbf{Y}_{(m)} | \mathbf{Z}_{S}, \mathbf{Z}_{(m)},\sigma^2_{(m)}\right) = \mathbf{C}_{(m)}\\ \Rightarrow & \left(\mathbf{Y}_{(m)}^\top \mathbf{Y}_{(m)}\right)^{-1} \le \mathbf{C}_{(m)}^{-1} \end{align*} $$with the inequalities meant in a matrix sense. Define
$$ \begin{align*} \nonumber & Q\left(\mathbf{Z}_S, \mathbf{Z}_{(1)}, \mathbf{Z}_{(2)}\big| \mathbf{Y}_{(1)}, \mathbf{Y}_{(2)}, \mathbf{C}_{(1)}^{-1}, \mathbf{C}_{(2)}^{-1}\right) =\\ \nonumber&\quad -\frac{1}{2}\bigg\{N(K_{(1)}+K_{(2)}) \log\left(2 \pi\right) + K_{(1)} \log\left(|\mathbf{C}_1|\right)+K_{(2)} \log\left(|\mathbf{C}_2|\right) \\ &\quad +\mathrm{tr}\left(\mathbf{C}_2^{-1} \mathbf{Y}_{(2)} \mathbf{Y}_{(2)}^{\top} \mathbf{Y}_{(1)} \mathbf{Y}_{(1)}^\top \mathbf{C}_1^{-1} + \mathbf{C}_1^{-1} \mathbf{Y}_{(1)} \mathbf{Y}_{(1)}^\top \mathbf{Y}_{(2)} \mathbf{Y}_{(2)}^{\top} \mathbf{C}_2^{-1}\right) \bigg\}. \end{align*} $$By construction,
(25)$$ \begin{align} Q\left(\mathbf{Z}_S, \mathbf{Z}_{(1)}, \mathbf{Z}_{(2)}\big| \mathbf{Y}_{(1)}, \mathbf{Y}_{(2)}, \mathbf{C}_{(1)}^{-1}, \mathbf{C}_{(2)}^{-1}\right) \le \ell\left(\mathbf{Z}_S, \mathbf{Z}_{(1)}, \mathbf{Z}_{(2)}\big|\mathbf{Y}_{(1)}, \mathbf{Y}_{(2)}\right). \end{align} $$Following the steps in the proof of part (1),
$\mathbf {Z}_{S}$ is clearly proportional to a left singular vector of a weighted average of $\ddot {\mathbf {A}}$ and $\ddot {\mathbf {A}}^\top $, where $\ddot {\mathbf {A}} = \mathbf {Y}_{(2)} \mathbf {Y}_{(2)}^{\top } {\mathbf {Y}}_{(1)} {\mathbf {Y}}_{(1)}^\top $. That the maximizer of the minorizing function at convergence is also the ML estimate follows from invariance of the maximum likelihood estimator.


Acknowledgments
We are grateful to Arthur Spirling, Jacob Neihesel, John Londregan, and Dustin Tingley and audiences at Princeton University, New York University, and the University of Buffalo for for helpful comments on an suggestions.
Data Availability Statement
Replication code for this article has been published in Code Ocean, a computational reproducibility platform that enables users to run the code, and can be viewed interactively at Enamorado et al. (Reference Enamorado, López-Moctezuma and Ratkovic2020a) or https://doi.org/10.24433/CO.3824807.v1. A preservation copy of the same code and data can also be accessed via Harvard Dataverse at Enamorado et al. (Reference Gentzkow and Shapiro2020b) or https://doi.org/10.7910/DVN/FOUVELL.
Supplementary Materials
To view supplementary material for this article, please visit https://dx.doi.org/10.1017/pan.2020.24.