

1. Introduction
Wine has been produced in Europe for over 2,000 years, and in many places wine making appears to be governed more by tradition than by innovation. But following tradition at the expense of innovation may be a poor strategy for wineries in a dynamic, competitive industry. Unless it is protected from competition by government, a winery, like any other business, must consider innovation a strategic option in its attempt to outperform its rivals (Brenner, Reference Brenner1987). Furthermore, in a competitive industry for which cost saving or quality-enhancing innovation is available, any firm that does not keep up will experience losses and demise.
The competitiveness and dynamism of the California wine industry is not in doubt. Porter (Reference Porter1998), for example, singled out the California wine industry as a prime example of a dynamic cluster of related businesses and organizations whose dynamism is fueled by competition and innovation. Certainly, the California wine industry has been at the forefront of technological innovation and adoption. The introduction of stainless steel tanks and refrigeration systems in the 1960s and 1970s, coupled with sterile filtration and bottling, allowed the development of fruity, off-dry, white wines, spurring industry expansion in the 1970s. Barrels made specifically for wine production, as opposed to reused whisky barrels, quickly became the norm in the 1970s for red wine production. Today, California winemakers routinely employ micro-oxidation techniques as well as various forms of oak adjuncts, such as chips or staves, to mimic at reduced costs barrel aging in large tanks.
Curiously, however, empirical studies on diffusion and adoption of innovations in the California wine industry are hard to find, if they exist at all. Such studies might help to identify the roots of the industry's dynamism: Is innovation driven mainly by economic gain, as economists tend to assume? Or is it driven by the milieu in which wine businesses operate, as is suggested by sociologists (e.g., Rogers, Reference Rogers2003) as well as by Porter (Reference Porter1998)? Or is it governed by closely knit networks among the wineries, their managers, and their technical staff?
Wine is food. Maintaining high standards of hygiene is indispensable for a winery, and poor cellar hygiene can spoil a wine (Franson, Reference Franson2004; Payette, Reference Payette2005; Worobo, Reference Worobo2004). Wineries, therefore, take great pains and bear considerable costs in sanitizing barrels, tanks, bottling lines, floors, and hoses. New cleaning and sanitizing technologies that enhance a cellar's standard of hygiene, or that reduce the costs of cleaning and sanitation, would thus seem attractive for wineries. Sanitation using ozone dissolved in water is a technology that has become practical with the advent of commercially produced ozone units whose capacity is adapted to the needs of wineries.
For a new technology to be adopted by a winery, many conditions must be met: Its managers or owners must have an incentive to be alert to the availability of innovations; they must be able to become informed about the merits of the innovation and become convinced that adopting the innovation will be beneficial for the business; and they must have the material, technical, and cognitive resources at hand that make adoption of the innovation feasible. Models of business innovation emphasize different aspects of adoption and diffusion, and they differ considerably with regard to the methods and data that they require for their implementation. For example, taking adopters' information sources into account in empirical studies adds to the burden of respondents and researchers as well, and empirical network models require different and much larger data sets than conventional economic adoption models.
This study has two purposes. The first purpose is to gain insights into the adoption and diffusion of ozone sanitation technology (OST): How far has it spread? What distinguishes the wineries that have embraced OST? The second purpose is to gain information on the applicability and net benefits of alternative innovation models.
The paper is organized into seven sections. After the introduction, we provide a nontechnical description of ozone sanitation technology. Then we briefly introduce different perspectives and models for studying innovation adoption. Sections 4–6 comprise the empirical core of the paper. We report details of our OST-adoption survey in Section 4, and in Section 5 we analyze differences between OST adopters and non-adopters. Section 6 reports insights on the “grapevine” through which OST information has moved toward adopters and non-adopters. Here, we also acknowledge our concerns about our attempt to study information networks with relatively limited data. We end our paper with Section 7.
2. Ozone Sanitation Technology
2.1. Winery Sanitation Methods
Cleaning involves the removal of organic and inorganic deposits from a winery's premises and equipment. Cleaning is usually done with high-pressure water or with detergents dissolved in water. Proper cleaning enhances the effectiveness of the sanitation process, which is usually carried out after cleaning (Worobo, Reference Worobo2004). Sanitizing means reducing the number of microorganisms to a safe level. There is no hard and fast definition for safe levels of microorganisms in wineries, but a rule of thumb holds that sanitization should eliminate more than 99.9 percent of the microorganisms (Schiff, Reference Schiff1998).
Traditional technologies for winery sanitation include chlorine-based sanitizers, hot water, and steam. Recently, it was discovered that chlorine-based sanitizers facilitate the development of 2,4,6-trichloranisole (TCA)—the dreaded source of corkiness (cork taint) in wine. The industry, therefore, started using nonchlorinated chemicals (Franson, Reference Franson2004). The main shortcoming of chemicals, most of which are dissolved in water, is that they leave residue that must be removed after sanitation. Moreover, some chemicals are environmental hazards, and others, when applied in high concentrations, can extract valuable flavors from oak barrels. Hot water and steam are highly effective sanitizers, but their use has a higher cost, which increases as energy costs rise.
Ozone is a highly reactive substance that kills microorganisms such as bacteria, fungi, molds, and spores, and it destroys viruses. When used as a sanitation agent in wineries, ozone has several distinct advantages over conventional sanitation methods. Unlike water and steam, ozone is relatively inexpensive. Moreover, unlike most of the sanitation chemicals, ozone leaves no residue other than oxygen, and it does not harm the environment.
The primary applications of ozone in wineries are barrel and tank sanitation, but it can also be used in bottling-line sanitation and for mold control in corks. The key factor for an effective use of ozone is the concentration time (CT), defined as:

The CT value reflects that longer application times are needed for sanitation when water with low ozone concentration is used, and vice versa. Required CT values for specific sanitation tasks have been determined experientially but are kept confidential. CT times have been determined by the manufacturers for use by purchasers for their specific type of machine.
2.2. Ozone Units
Ozone can be generated in one of two ways: by passing oxygen-containing gas through a high-energy electrical field or through a source of ultraviolet radiation. The first method is known as corona discharge (CD) technology, and the other is called ultraviolet (UV). Ozone produced by either method is then dissolved in water, and the solution is used for sanitation (Coggan, 2003a; Hampson, Reference Hampson2000; Rich, Reference Rich1994).
An ozone unit is a mobile machine that generates ozone and dissolves it in water. The machine requires electricity and must be connected to a source of water; ozonated water flows out through a hose.
McClain Ozone of Napa, CA, is a developer and producer of ozone units for wineries. Its highest-selling product, the “Destroyer,” uses a patented gas-stripping system based on corona-discharge technology. Its capacity is 15 gallons per minute of water with 3–5 parts per million of ozone. In 2010, the unit sold for between $8,000 and $10,500, depending upon options (McClain, Reference McClain2010). McClain Ozone is the market leader, with a market share of about 80 percent of total ozone unit sales to the U.S. wine industry (Franson, Reference Franson2004; Madonna, Reference Madonna1999; McClain, Reference McClain2005a, 2005b).
Other American manufacturers of ozone units for the wine industry include Pacific Ozone Technology, Del Ozone, Carlson, and Piper Environmental Group.
2.3. Sanitation Costs
Cost estimates are unavailable for the different sanitation methods, and we have data for only some selected cost items. The methods differ, however, with regard to their cost composition. Sanitation with ozonated water as well as sanitation with hot water or steam require an initial investment, and they entail variable costs. Sanitation with chemicals, in contrast, typically involves only variable costs.
The cost of sanitation with chemicals include the cost of the chemicals, labor, and water. The cost of the chemicals depends on the type of chemical used. For example, the price of a chlorine-based sanitizer is about $1.50 per gallon, while the price of peracetic acid is about $15 per gallon (Delmar, Reference Delmar2005). Recommended concentration levels vary between chemicals and sanitation tasks. Recommended concentrations for peracetic acid range from 85 ppm to 300 ppm, while chlorine is generally used in concentrations of between 100 ppm and 200 ppm. However, use of chlorine sanitizers has fallen dramatically due to its link with the production of TCA, or cork taint (Ontario, 2006; Sipowicz, Reference Sipowicz2008). In some localities, the disposal of chemicals is subject to special assessments. The costs of wastewater disposal are negligible for wineries that operate their own sewage systems, as is the case at many Napa Valley wineries.
Sanitation with hot water and steam requires heat generators, which cost between several thousands of dollars for small to medium wineries and $40,000–50,000 for large wineries (Worobo, Reference Worobo2005). Variable costs include energy, labor, and water.
Prices of ozone generators range from $5,000 to $20,000, depending on the supplier and the machine's capacity. Sanitation with ozonated water entails some variable costs for labor, electricity, and maintenance of the ozone unit. By using the ozonated water, consumption of water is estimated to be reduced by 25% to 60% compared with conventional technologies; in addition, cost of heating water is saved.
3. Models of Innovation
In her review of innovation and diffusion studies, Hall (2005) distinguishes four disciplinary perspectives: history, sociology, economics, and networks, of which all but the first might be relevant for studying OST adoption.
The economics perspective has its roots in Griliches (Reference Griliches1957), the landmark study of hybrid corn adoption. The hallmark of the economics perspective is its focus on the adoption decision of individual agents. Economic adoption theory assumes that the agents decide for or against adoption on the grounds of the costs and benefits that accrue to them individually. Because costs and benefits are known only imperfectly at the time the adoption decision is made, the economics perspective includes the acquisition of information. Costs, benefits, or any other effects from adoption that arise outside the decision domain of individual agents are not usually considered in economic adoption and diffusion studies, although they could be incorporated into this framework.
Diffusion of Innovations (Rogers, Reference Rogers2003), now in its fifth edition, is the loadstar of adoption and diffusion sociology. Hall (Reference Hall, Fagerberg, Mowery and Nelson2004) found in Rogers (Reference Rogers2003) five categories of attributes with an impact on innovation adoption: “1) the relative advantage of the innovation; 2) its compatibility, with the potential adopter's current way of doing things and with social norms; 3) the complexity of the innovation; 4) trialability, the ease with which the innovation can be tested by a potential adopter; 5) observability, the ease with which the innovation can be evaluated after trial” (2004, pp. 4–5). Moreover, as it behooves sociologists, Rogers (Reference Rogers2003) identifies external and social conditions that accelerate or retard diffusion. Among the conditions identified by Rogers (Reference Rogers2003), one is of particular interest for us: the communication channels used by potential adopters for acquiring information about an innovation. Other conditions, such as whether the adoption decision is made collectively or through the promotional efforts of change agents are less pertinent in relation to OST.
The contrast between the economics and sociology perspectives on innovation adoption is also reflected in the adoption model typology that Nelson et al. (Reference Nelson, Peterhansel and Sampat2004) have suggested. Their typology distinguishes adoption models by two dimensions: (1) ability or inability to obtain clear and persuasive feedback about well-defined, objective performance criteria and (2) absence or presence of dynamic increasing returns. The four model types, then, are:
Model 1: Rational choice model: clear feedback—no dynamic increasing returns;
Model 2: Quasi-rational choice with possibility of lock-in: clear feedback—dynamic increasing returns;
Model 3: Social construction: no clear feedback—dynamic increasing returns;
Model 4: Fads: no clear feedback—no dynamic increasing returns.
There are no obvious, strong sources for dynamic increasing returns—or network effects—for OST users. The only source of network effects that we can determine is accumulated experience with optimal levels of concentration time (CT) values for different OST applications. Moreover, some evaluation criteria for OST are fairly clear and objective: costs of OST use, effectiveness, and level of sanitation achieved. Relatively few OST adopters and non-adopters are, however, also concerned about OST's environmental friendliness. The environment is vast, and friendliness is difficult to pin down. This criterion is, therefore, bound to muddy somewhat the otherwise clear evaluation criteria for OST. Nevertheless, the rational choice model appears to be suitable for studying OST adoption.
Economists have not been in the vanguard of specifying the mechanisms by which information travels in a population of potential adopters of an innovation. Typically, economists resort to metaphors when they describe how information about innovations spreads: Knowledge is said to be “in the air” (Marshall, Reference Marshall1926) or it “spills over” (Alston, Reference Alston2002). However, some attempts have been made to substitute metaphors with mechanisms. In particular, a quickly growing number of studies model the transfer of information as information networks (e.g., Conley and Udry, Reference Conley and Udry2001; Giuliani and Bell, Reference Giuliani and Bell2005). Following the heuristic that models are preferable to metaphors, we tried to obtain data that would allow us to specify a network model of OST information.
4. The Survey and the Respondent Wineries
4.1. The Sample Survey
Our survey targeted wineries in seven wine-growing regions in California: Mendocino, Sonoma, Napa, San Francisco Bay area, Santa Cruz, Santa Barbara, and the Sierra Foothills. For these areas, we had a list of 714 wineries. In addition, we obtained 171 winery addresses from McClain Ozone of Napa; of the 171 wineries, 139 were located within the seven wine areas. Our total list comprised 853 of the nearly 2,500 wineries in California at the time of our survey.
Our questionnaire included 39 questions in six sections:
(1) General characteristics about the respondent and his or her experience in the wine industry;
(2) General information about the winery;
(3) Sources of technical information regarding the winery operation;
(4) Technical collaborations with external organizations;
(5) Awareness and use of OST, and
(6) Source of information about OST.
We conducted the survey online from March 15 to June 15, 2007. We chose the web for communicating with our respondents because the response rate of California wineries was satisfactory in previous online surveys (Stricker et al., Reference Stricker, Mueller, Sumner, Schmitz, Moss, Schmitz, Kagan and Babcock2005). Wineries were approached by email and invited to participate in the survey by logging into a University of California, Davis, website where the questionnaire was posted. Data were captured and processed at the University of Kiel. Several weeks after the first contact, we recontacted wineries that had not responded to our initial request. After that, no further action was taken to obtain responses from the wineries originally approached.
We received a total of 128 responses. Of those who responded on behalf of the winery, most held a position of significant responsibility, either for the winery management in general or for wine making. Nearly half the respondents (62) identified themselves as owners, and 16.4% (21) as general managers. Three-quarters of the respondents (97) were wine makers, and 8.6% (11) were cellar masters. A minority (3) were public relations managers or occupied other roles in their wineries, such as assistant wine maker (2), bottling line technician (1), Marketing/CFO (1), vice-president of operations, Asst. (1), or vineyard manager (1).
Not all responses could be used for statistical analysis. One respondent skipped nearly all questions and many skipped some. Moreover, four respondents failed to tells us whether or not they were using OST. A response rate of 15 percent seems a satisfactory yield for an online survey, but one is always concerned about whether the sample is representative of a broader population.
4.2. Respondent Wineries
4.2.1. General Characteristics
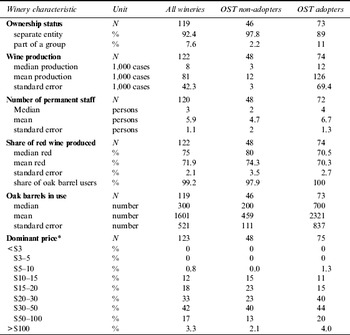
The median winery in our sample is a separate legal entity that produces 8,000 cases of wine with three permanent staff. Three-quarters of the wine produced is red, and it is cellared in 300 oak barrels. The modal sample winery earns most of its revenue from wines that have a retail price of $30–50 per bottle.
The size distribution of the wineries is skewed to the left. The mean size, measured in terms of cases produced, is 81,000 cases, and the maximum number of cases produced is 5 million. The size distribution, measured in terms of permanent staff, is similarly skewed to the left. The mean number of permanent staff is 5.9, and one winery reported having 100 permanent staff.
About 12 percent of the wineries produce only red wine, and nearly all (99.2%) use oak barrels. The distribution of oak barrels is also skewed to the left, with the mean number of 1,600 barrels exceeding by far the median number of 300 barrels; the maximum number of oak barrels in our sample is 60,000 barrels.
4.2.2. Cleaning and Sanitation Practices
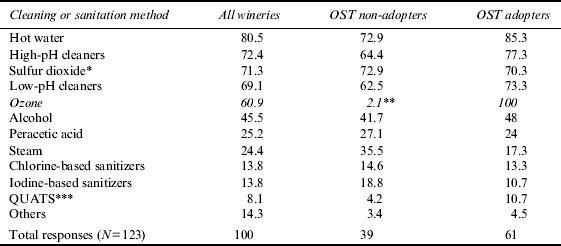
Ozone is not the most widely used cleaning and sanitation method used by wineries in our study. Only 61% (75) of the respondents reported using ozone technology. Hot water, high- and low-pH cleaners, and sulfur dioxide are more widely used than ozone (see Table 1). Ozone is, however, used as a cleaning and sanitization agent by more wineries than alcohol, peracetic acid, or steam. Chlorine- or iodine-based sanitizers are used only by one in seven wineries.
Cleaning and Sanitation Methods Used by the Wineries in the Survey (in percent)
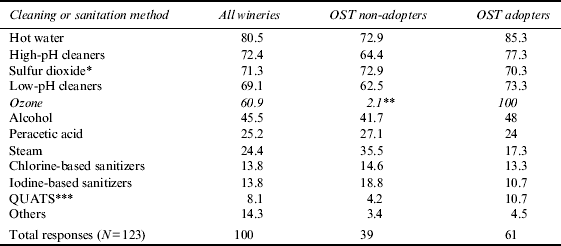
* N=122.
** One respondent returned an ambiguous response about the use of ozone.
*** QUATS: ammonium-based sanitizers.
We need to mention one inconsistency in the responses that we received. One respondent, who claimed that OST is not used in his or her winery, nevertheless claimed that ozone is used for cleaning and sanitization at the winery. We treated this respondent as a non-adopter.
5. Adoption of OST
5.1. Diffusion and Use of OST Units
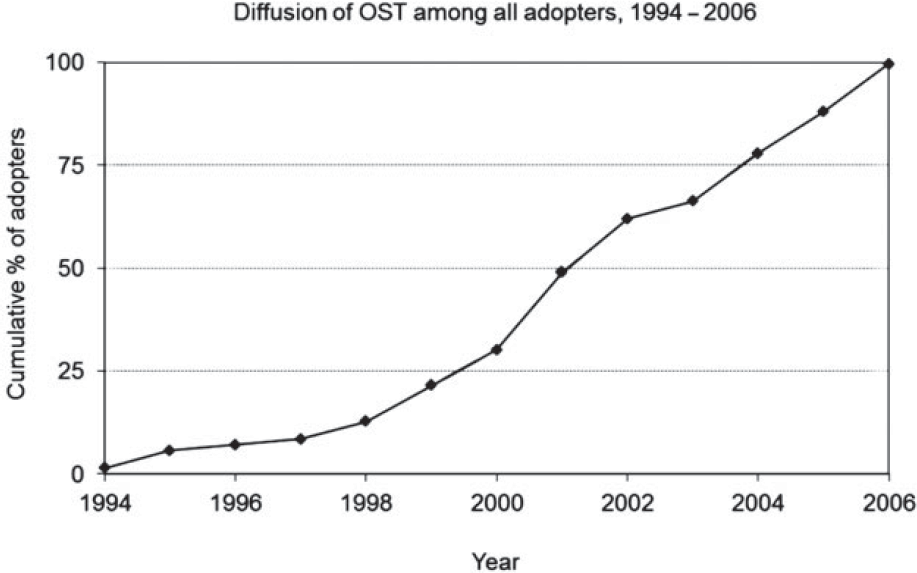
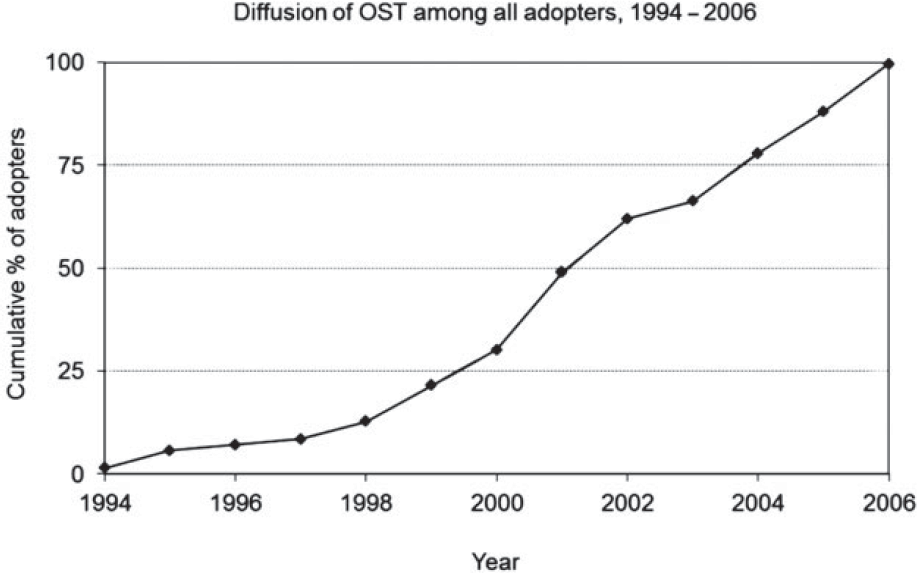
The first OST unit was adopted by our respondents in 1994. Until 1998, diffusion was slow but accelerated in 1999 and kept its pace until 2006, when 61 percent of our respondents reported using OST (Figure 1). The number of OST units per user averaged 1.2 in 2006, and the maximum number of OST units per user was 4.
Diffusion of OST, 1994–2006
OST users were asked to report on its weaknesses and limitations. Their most frequently cited weakness was the lack of a scientifically validated ozone dosage and application time (55%) followed by concerns about ozone safety (49%) and that ozone is effective for some but not all sanitation tasks (43%). Less than 10% were concerned about each of the following issues: time required for staff training, lack of effectiveness compared to alternative methods, user friendliness, environment friendliness, and the ozone-generating capacity being either too small or too large.
We also asked non-adopters why they had not adopted OST. The most important reason was the expense for OST (51% of 47 responses), followed by concerns about ozone safety (44% of 48 responses), and satisfaction with conventional cleaning and sanitization methods (33% of 48 respondents).
5.2. Are OST Adopters Different from Non-Adopters?
Wineries that have adopted OST produce, on average, more wine than wineries that have not. They employ more permanent staff, and they use a larger number of oak barrels. A much larger proportion of OST users than non-adopters are part of a group of wineries with a common owner (11% versus 2.2%) and OST adopters tend to earn most of their revenue in higher price brackets than non-adopters (Table 2). That non-adopting wineries are smaller in size and selling less expensive wine implies that they have less revenue than OST-wineries, and this would be consistent with a concern over the expense of the technology.
Characteristics of Respondent Wineries
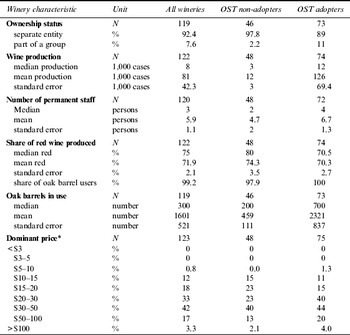
* Respondents could choose more than one price category and 26 wineries named more than one.
We asked the respondents for their age, their years of work at the winery and in the wine industry, and their level of education and their degree area. The differences in these characteristics between OST adopters and non-adopters in our sample are small. The respondents from the non-adopting wineries tend to be older than the respondents from the OST adopters. Whereas more than half (59%) of the respondents from OST-adopting wineries were 50 years or younger, about the same share of respondents (58%) from non-adopting wineries were older than 50 years. Respondents from non-adopting wineries had, on average, longer work experience at the winery (13 years) than respondents from OST-adopting wineries, who had worked at the winery for only 9.9 years, on average.
6. Exploring the Grapevine: Sources of OST Information
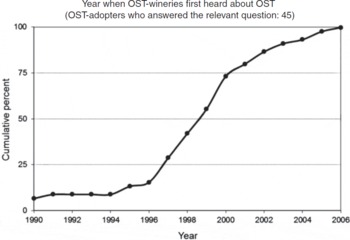
A central tenet of the sociology branch of diffusion studies is that information matters in technology diffusion. The fact that information about an innovation must precede its adoption is trivial, but the delay between becoming informed about a technology and its eventual adoption is a matter of interest. One of the OST adopters claimed to have heard about OST as early as 1976, and three OST adopters had heard about OST by 1990. Apparently, OST news spread earlier among North Coast wineries than elsewhere in California, where news about OST arrived at the OST adopters by 1997. Figure 2 shows how the OST grapevine crept forward in a typical S-shape: low on the bottom, then quickly climbing upward in the five years from 1996 to 2000, until growing as much sideways as upward from 2000 to 2006.
The OST-grapevine unfolding
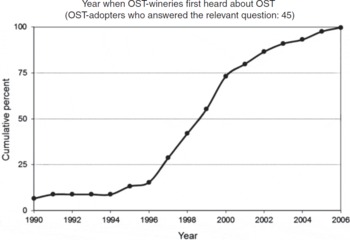
Half the OST adopters reacted within a year or less to the news about the advent of OST and adopted the technology; the other half took longer, and 9% of OST adopters took more than six years between learning about OST and adopting it.
6.1. Becoming Informed About OST
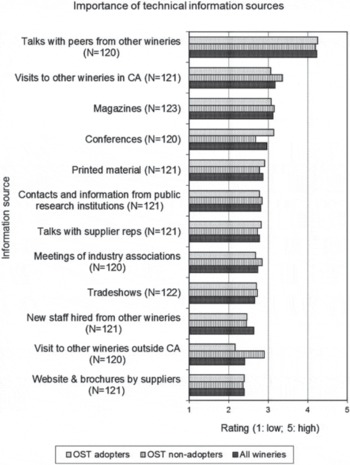
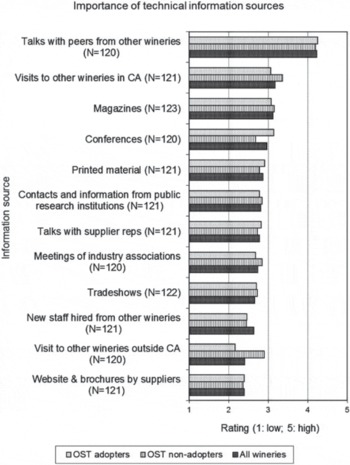
We asked the respondents to rate sources of technical information by their importance. The most important sources clearly are personal contacts, that is, talks with peers and visits to other wineries in California. Lower rated are websites and brochures as well as visits to wineries outside California.
The ratings of the sources of technical information are illuminating but cannot contribute much to an explanation of adoption and non-adoption because the ratings by adopters and non-adopters do not differ by much (Figure 3).
Importance for the wineries of technical information sources
We also investigated how the respondents learned about the availability of ozone units for winery cleaning and sanitation. A considerable minority (about one out of six respondents, or 17.5%) did not remember how they became aware of OST units. Those who did remember most often mentioned “wine industry exhibition or fair in California” as their original source (20%), followed by wine industry publication (15.8%) and visit to another winery (12.3%). All other information sources, including personal connections, such as friends and professional peers, were mentioned by less than 10% of the respondents.
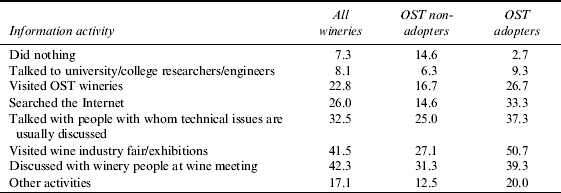
The decision to adopt or not to adopt an innovation is unique and can hardly be routine. It is, therefore, reasonable to expect that information is obtained in order to make an informed, deliberate adoption decision. Nearly all the adopters in our sample (97.3%) undertook some information collection activities before the OST-adoption decision. Of the non-adopters, nearly 15% claimed to have done nothing before their decision. In these cases, it is difficult to tell whether a deliberate decision about adopting OST was made. The response by the non-adopters implies that about 85% of them actively acquired information on OST but decided against adopting it. All information activities were undertaken by larger shares of the OST adopters than by OST non-adopters (Table 3).
Information Activities Before Adoption Decision Was Reached (in percent)
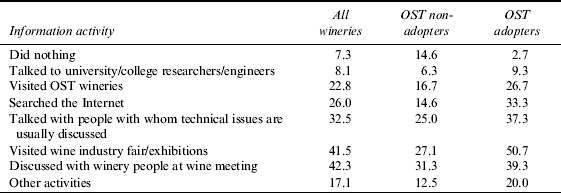
Note: Respondents were permitted to select more than one activity, so totals do not sum to 100.
6.2. Education
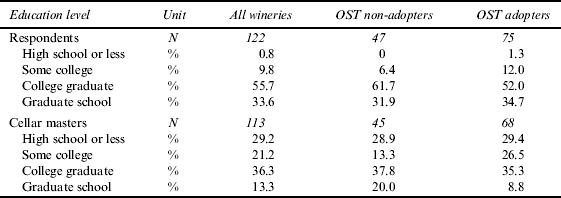
Education is often found to enhance the ability to acquire and understand information. We probed the education levels of the respondents as well as that of the cellar masters. The education level of the respondents at wineries that adopted OST did not differ much from the level of those at wineries that did not (Table 4). We found a higher share of college graduates among the respondents at non-adopting wineries (62%) than among the respondents at OST-adopters (52%) and a lower share of respondents who had some college but did not graduate at non-adopting wineries (6.4%) than at OST-adopters (12%).
Education Level of Respondents and Cellar Masters
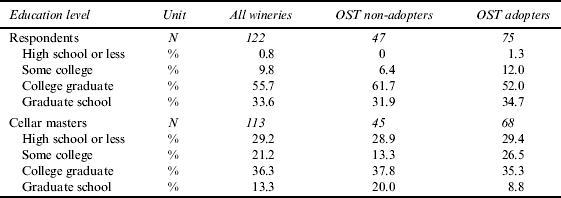
The share of cellar masters who had graduated from college is about the same for the adopting and the non-adopting wineries. However, the share of cellar masters who had attended graduate school is more than twice as large among non-adopters as among the cellar masters from OST-adopting wineries.
6.3. North Coast: A Cluster Within the Cluster?
The California wine cluster is vast and diverse (Mueller and Sumner, Reference Mueller and Sumner2006) and some regions, in particular Napa and Sonoma, might form a subcluster of it. The Napa and Sonoma valleys host a high-density of wineries, as well as many winery-related businesses. For example, the major manufacturer of OST units is located in Napa.
Using our data, we tested the idea that the North Coast region, that is, Napa, Sonoma, and Mendocino, is a separate cluster within the California wine cluster. A chi-square tests suggests that North Coast wineries are more likely to adopt OST than wineries outside the North Coast region.
6.4. Network Analysis with Limited Data—A Concern
Obtaining data on the linkages between agents is the Achilles' heel of network analysis (Scott, Reference Scott2000). Giuliani and Bell (Reference Giuliani and Bell2005) used a roster approach for generating the information on linkages in the Chilean winery network. The number of wineries in the Colchagua Valley in Chile is, however, small compared with the number of wineries in California, where the roster would have to comprise not just 32 wineries but several hundred.
We did not want to burden our respondents by asking them to search such a long list to indicate which wineries they have a relationship with. Instead, we asked them to name up to three persons from other wineries with whom they or their colleagues discuss important technical issues of winery operations and how regularly they talked with them. This question generated many names but no network: When the responses were arranged in an incidence matrix, the matrix was very sparse, with most column sums not exceeding 1 and never in excess of 4. In brief, our short-cut approach to obtaining network data failed. The substantive point is that the respondents' networks of very important colleagues did not overlap much. The methodological point is that to obtain the full set of connections among individuals and firms in a relatively large grouping probably requires a more extensive and time-consuming survey instrument with the concomitant concern about lower response rates.
6.5. What Counts in Adoption
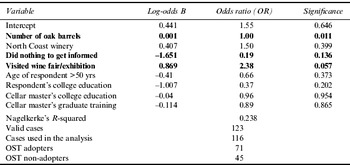
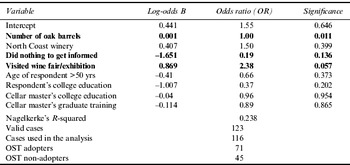
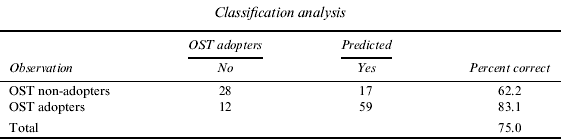
In order to see which variables explain OST adoption, we conducted a logistic regression analysis with OST non-adoption versus OST adoption as the dependent variable. Our first explanatory variable is the number of oak barrels in use at a winery, which is a measure of scale. We expected to find a positive impact of this variable because most OST users employ it for cleaning and sanitizing barrels. Next, we included being located in the North Coast wine region as a variable reflecting a subcluster of the large and diverse California wine cluster. Location in the North Coast is likely to lower costs of information about successful adoption and use of the technology. We expected to find that being located in the North Coast region increased the probability of a winery's OST adoption. Information collection was reflected by two variables: (1) whether or not wineries did anything to become better informed about OST after they had become aware of the technology and (2) whether or not they attended wine industry fairs and exhibitions to become better informed about OST. Both information collection variables were expected to contribute to OST adoption. The relevant capacities needed for managers and technical employees to gather information and use a technology depends on the complexity of the technology. OST is not complex, but it does have a scientific basis. We used three variables to represent the capacity of wineries to absorb the information needed for OST: (1) Whether the respondent had a college education; (2) whether the winery's cellar master had a college education, and (3) whether the cellar master had attended graduate school. All three variables could be expected to enhance a winery's capacity to absorb information about OST and, therefore, to increase the probability of adoption. Because age is often a significant variable explaining adoption, we also included a variable showing whether our respondent was younger or older than 50 years. There are, however, no strong expectations about whether being older than 50 increases or decreases the propensity to adopt OST.
The results from our logit analysis are presented in Table 5. The number of oak barrels has a statistically significant positive impact on OST adoption, and we can safely conclude that economic scale considerations affect OST adoption. Moreover, visiting wine industry fairs and exhibitions also enhances significantly the chances that a winery will adopt OST. In contrast, when a winery decides not to do anything to become better informed about OST, the odds that the winery will adopt OST are lower; the hypothesis of no effect is rejected only at a 0.14 level of significance. The rest of the variables do not make any statistically reliable contributions to explaining OST adoption.
What Matters in OST Adoption? Results from a Logit Regression
7. Summary and Conclusions
We started our research with the aim of shedding some light on the use of alternative perspectives and models for studying the adoption of winery innovations. We chose OST because it seemed to be a technical innovation that is typical of many other innovative technologies: There are several reasonably good conventional substitutes for OST; it makes some but not excessive demands on user knowledge; it is somewhat lumpy, giving rise to some limited economies of scale; and it was not promoted by government agencies.
Our online survey allowed us to describe in satisfactory detail how OST has spread among wineries in California. It also allowed us to demonstrate the need for alternative sets of variables to explain the adoption of OST. Variables that reflect the economic benefits of OST, in particular, the number of oak barrels used by a winery, help to explainadoption. With few exceptions, variables that represent information activities and wineries' capacity to absorb information, did not help explain the causes of OST adoption. What matters is that the decision makers do not shy away from acquiring more information before making an adoption decision, and they attend wine industry fairs and exhibitions. Information absorptive capacity, as measured by several education variables, did not matter in OST adoption. Our attempt to use a relatively short online survey to measure the information networks used by wineries provided only limited connections. We find that the level of communication among wineries is high. The most valued source of information is peers from wineries within California. Because the California wine industry is made up of more than 2,500 wineries, and our study includes only 123 wineries, a more extensive sample with a higher number of wineries would reveal more details of this information network.