The relationship between government performance and electoral outcomes—commonly known as “retrospective voting”—is one of the most studied topics in American political behavior (e.g., Fiorina Reference Fiorina1981; Key Reference Key1966; Kramer Reference Kramer1971; for a recent review, see Healy and Malhotra Reference Healy and Malhotra2013). Such electoral responsiveness is often touted as promoting democratic accountability by sanctioning failure or promoting the selection of more competent leaders (Fearon Reference Fearon, Przeworksi, Stokes and Manin1999; Ferejohn Reference Ferejohn1986). Recent research has progressed in exploring the microfoundations of retrospective voting behavior (e.g., Gasper and Reeves Reference Gasper and Reeves2011; Healy and Lenz Reference Healy and Lenz2014; Huber et al. Reference Huber, Hill and Lenz2012; Levendusky and Horowitz Reference Levendusky and Horowitz2012; Tucker and Brader Reference Tucker and Brader2012).
Despite these advances, the process by which voters blame political actors remains understudied, although some research in the last decade has started to address this question via experimental and other methods (e.g., Brown Reference Brown2010; Hobolt et al. Reference Hobolt, Tilley and Wittrock2013; Maestas et al. Reference Maestas, Atkenson, Croom and Bryant2008; Malhotra and Kuo Reference Malhotra and Kuo2008; Marsh and Tilley Reference Marsh and Tilley2010; Rudolph Reference Rudolph2003a, Reference Rudolph2003b, Reference Rudolph2006; Rudolph and Grant Reference Rudolph and Grant2002; Tilley and Hobolt Reference Tilley and Hobolt2011). Understanding the sources of voters’ attribution of responsibility for government failure is important because such attribution constitutes the intermediate psychological step between negative outcomes and retrospective voting. Citizens must first determine the extent to which various government actors are blameworthy for negative outcomes by considering the events that took place and then attributing responsibility. In a federal, separation-of-powers system such as the United States, blame attribution can be complicated and cognitively demanding. If such attributions are characterized by partisan bias and motivated reasoning, as opposed to objective evaluation of the events that took place, citizens may not be engaging in the type of retrospection necessary for effective democratic accountability. It is also important to understand the conditions under which partisan rationalization of blame is more or less likely. This article addresses these issues by exploring how citizens assigned blame to government officials after the 9/11 attacks.
A fundamental aspect of understanding the determinants of blame attribution in the wake of negative outcomes is the role of partisan bias. Recent research demonstrates that party labels often serve as useful heuristics that help cognitively constrained citizens deal with a complex policy environment (e.g., Bullock Reference Bullock2011; Jackman and Sniderman Reference Jackman, Sniderman and Monroe2002; Lupia and McCubbins Reference Lupia and McCubbins1998; Popkin Reference Popkin1994). In contrast, an official’s party affiliation likely reveals little about her competence or integrity in how she handled a crisis. In such situations, instead of providing meaningful information about performance, partisan cues may distort people’s perceptions and hinder proper blame attribution. People may selectively absorb information that is congruent with their partisan leanings and be skeptical of information that contradicts it, consistent with theories of motivated reasoning (Taber and Lodge Reference Taber and Lodge2006). Such individuals may therefore be more likely to defend co-partisans and blame opposing party officials simply based on partisan attachments. Per Bartels (Reference Bartels2002), we argue that proper blame attribution requires that Democrats and Republicans assess the situation in a similar way. Just as knowing whether a president is a Democrat or a Republican should not influence one’s estimate of the inflation rate or the budget deficit, party labels should not affect one’s interpretation of who should be blamed for a poor response to a natural disaster or a national security breach. Examining the effect of party cues in these contexts allow us to better identify partisan bias, as such labels should be uninformative.
Nevertheless, recent experiments have found evidence of partisan bias and motivated reasoning in attributions (Rudolph Reference Rudolph2006; Tilley and Hobolt Reference Tilley and Hobolt2011). At the same time, others have shown that diagnostic information can mitigate such biases (Hobolt et al. Reference Hobolt, Tilley and Wittrock2013; Malhotra and Kuo Reference Malhotra and Kuo2008).We build on this literature in several ways. First, no experiment has both examined a real-world case and randomly manipulated party cues for the same officials.Footnote 1 We accomplish this while avoiding deception by considering government officials in power on 9/11 who were at one time appointed by a Democratic president and at another time by a Republican president, thereby making it possible to truthfully refer to the same official as a “Democratic” or “Republican” appointee in different experimental conditions. Our results thus provide a cleaner test of partisan rationalization than is generally possible for elected officials while also providing supportive evidence for existing research that has examined attributions for elected politicians.
Second, previous studies have examined officials who are highly germane to the domains being studied. For instance, Rudolph (Reference Rudolph2006) examines attributions of blame and credit to governors for state economic policy. Tilley and Hobolt (Reference Tilley and Hobolt2011) explore evaluations of the British majority government with respect to economic performance and healthcare policy. This is a natural approach. However, we argue that it is also important to examine partisan bias in cases where officials are less relevant to the domain in question. Considering variation in domain relevance allows us to assess the accountability implications of partisan rationalization.
Domain relevance may moderate partisan bias in blame attribution in several ways. For instance, if officials are not domain relevant at all, we might expect the share of partisan bias relative to the total blame assigned to be even larger, since it may be difficult to make attributions under uncertainty; lacking other cues, citizens might prioritize party labels in making blame judgments. Or partisan bias may be greater if voters are particularly motivated to tailor their attributions to fit a preexisting partisan bias when the official and the related judgment are perceived to be consequential. Such a result would have troubling implications for representative democracy because it would suggest that partisan bias impedes democratic accountability the most when the stakes are the highest.
A third contribution is that our study is the first to explore partisan bias in the attribution of responsibility to appointed bureaucratic officials. A series of studies examine how citizens blame elected politicians, but the performance of bureaucracies can also influence the public’s evaluation of incumbent governments and the executive. For example, the poor performance of the Federal Emergency Management Agency under Michael Brown during Hurricane Katrina damaged public approval of President Bush (Fletcher and Morin Reference Fletcher and Morin2005). Similarly, the problems related to the Department of Health and Human Services’ implementation of the Affordable Care Act under the leadership of Kathleen Sebelius appears to have hurt President Obama’s approval rating (Feldmann Reference Feldmann2013). Last, the appointment of bureaucratic officials in the United States can be a politically contentious process, illustrating the importance of such officials to policy outcomes and the relevance of studying how citizens attribute blame to them.
We find that partisan bias influences evaluations more strongly when respondents evaluate domain-relevant actors. Partisan labels have a large impact on the blame that people assign to CIA Director George Tenet for the 9/11 attacks, a smaller effect on the blame they assign to a less-relevant actor (FBI Director Louis Freeh), and no effect on the blame assigned to an essentially irrelevant actor (Federal Reserve Chairman Alan Greenspan).
EXPERIMENTAL DESIGN
Using a nationally representative Internet-based survey experiment of 1015 respondents conducted by Knowledge Networks (KN),Footnote 2 the study sought to ascertain how Americans attributed blame of government officials for the terrorist attacks on September 11, a major failure of intelligence and national security that warranted federal investigations and commissions. We interviewed people years after 9/11, simulating a situation where voters evaluate government performance at election time well after a pivotal event has taken place and well after the attacks had been politicized by elites.Footnote 3 It is more likely that we observe partisan bias under these conditions (Berinsky Reference Berinsky2007). Partisan bias may be less pronounced shortly after a national security crisis due to citizens rallying around the flag (e.g., Hetherington and Nelson Reference Hetherington and Nelson2003). Given that elections can come after a national security issue has become politicized (as was the case with 9/11), the long-run persistence of partisan bias has important implications for electoral outcomes.
At the outset of the survey, respondents were told, “We would like to ask you a few questions about your thoughts and opinions on the September 11 terrorist attacks.” To measure the dependent variable, we asked respondents, “How much is [Official X] to blame for making American vulnerable to the attacks on September 11?”Footnote 4 We asked three versions of this question to each respondent, replacing “[Official X]” with the office title and name of: CIA Director George Tenet, FBI Director Louis Freeh, and Federal Reserve Chairman Alan Greenspan. Of these officials, the CIA and FBI directors had a significant role in managing foreign and domestic intelligence, respectively, whereas the Federal Reserve chairman had no responsibilities relating to averting the September 11 attacks.Footnote 5 Further, among intelligence officials, the CIA is likely more domain-relevant than the FBI given that it operates outside of the United States and is more responsible for dealing with international terrorism, and also because the 9/11 attacks were planned outside U.S. borders. While both security agencies obviously bear responsibility, recent scholarship documents the importance of initial intelligence failures at the CIA (as well as failures in CIA–FBI communication; Zegart Reference Zegart2007). Further, as we report below, the respondents themselves believed the CIA to be more responsible than the FBI.
For each of the three questions, respondents were randomly assigned to one of three conditions. In the control condition, the question appeared as above.Footnote 6 In the second condition, the official was identified as being appointed by a Republican administration. For example, for Tenet, the question was this: “How much is CIA Director George Tenet, a Republican appointee, to blame for making America vulnerable to the attacks on September 11?” In the third condition, the official was identified as being appointed by a Democratic administration: “How much is CIA Director George Tenet, a Democratic appointee, to blame for making American vulnerable to the attacks on September 11?”Footnote 7 These cues can have at least two effects on people which are not mutually exclusive. They can prime partisanship (i.e., make it more salient), or they can provide novel information.Footnote 8 For each respondent, manipulations for the three officials were independent. The order in which the officials were presented was also randomized.
For all three officials, the party cues presented are accurate across all experimental conditions. Tenet, Freeh, and Greenspan were all appointed by both Republican (George W. Bush) and Democratic (Bill Clinton) presidents. Hence, this design achieves multiple objectives: (1) we manipulated the party labels of the same officials to assess the causal impact of partisan cues; (2) we used a real-world scenario; and (3) we accomplished (1) and (2) without employing deception.
STATISTICAL MODEL
To determine the extent of partisan bias in blame attribution, we estimate the following ordinary least squares (OLS) regression model for each official:Footnote 9
 \begin{equation}
B_i = \beta _0 + \beta _1 I_i + \beta _2 D_i + \beta _3 R_i + \beta _4 (I_i \times D_i) + \beta _5 (I_i \times R_i) + \varepsilon _i ,
\end{equation}
In the first three columns of Table 1, we present the linear combinations of the parameters from equation (1) which correspond to the mean blame ratings of six categories of respondents: Republican/Democratic respondents in each of the three treatment conditions. The fourth column presents the category comparisons (and corresponding linear combinations of model parameters) that correspond to our three estimands of interest: (1) the difference in the blame rating between the “Republican cue” condition and the “Democratic cue” condition among Republican respondents, or β3 – β2; (2) the difference in the blame rating between the “Republican cue” condition and the “Democratic cue” condition among Democratic respondents, or (β3 + β5) – (β2 + β4); and (3) the difference in the partisan gap between Democratic and Republican respondents’ blame ratings between the “Republican cue” condition and the “Democratic cue” condition, or β5 – β4. The first two estimands evaluate whether the partisanship of officials affects evaluations within partisan subgroups of voters; the third estimand indicates how the partisan gap between Democratic and Republican respondents changes in response to party cues. The final column of Table 1 displays the expected signs of the estimands in the presence of partisan bias. Our strongest prediction is with respect to the last of these estimands. Partisan rationalization predicts that Democratic respondents, relative to Republican respondents, should increase their blame attribution of the official when changing his affiliation from Democratic to Republican. In other words, switching the partisan cue should affect polarization in blame attributions.
Interpretation of Model Parameters

RESULTS
Descriptive Statistics
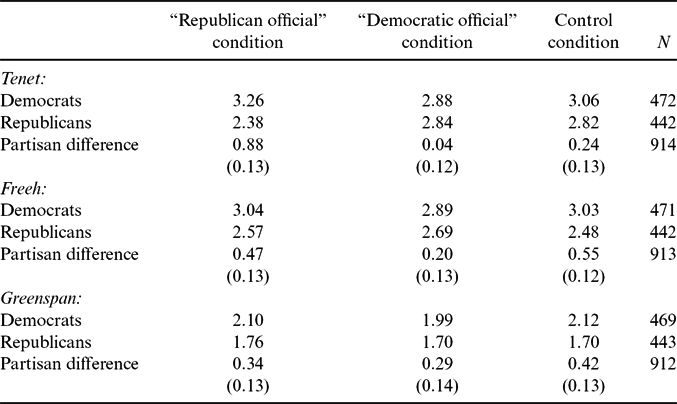
Before reporting the model estimates, we present some descriptive statistics. Table 2 contains the mean blame ratings of the three officials ranging from 1 (“not at all”) to 5 (“a great deal”) by respondent partisanship and experimental condition. The table also presents the partisan gap in the blame ratings across conditions. A few patterns stand out. First, we note that respondents believed that CIA Director Tenet was the most blameworthy for failing to prevent 9/11 followed by FBI Director Freeh, consistent with our claim that people viewed the CIA to be, overall, more domain relevant than the FBI. Federal Reserve Chairman Greenspan was seen as the least blameworthy. In the control group, 31.4% of respondents said Tenet deserved either “a great deal” or “a lot” of blame (compared with 34.0% who thought that he deserved either “a little” or “not at all”). At the same time, 25.9% of respondents assigned Freeh one of the top two response options (and 39.5% one of the bottom two). On the other hand, only 10.1% blamed Greenspan “a great deal” or “a lot,” whereas 67.8% blamed him “a little” or “not at all.” In the absence of party cues, respondents thus attributed blame to these officials in the expected order according to a priori expectations about domain relevance.
Descriptive Statistics (Mean Blame Ratings by Experimental Condition)
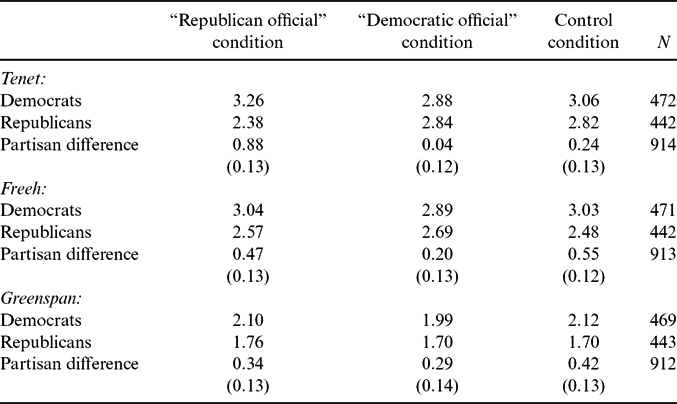
Note: Cells represent blame ratings of government officials ranging from “not at all” (1) to “a great deal” (5). Standard errors for the partisan differences are in parentheses.
Second, Democratic respondents blame the officials more than Republicans in the absence of any party labels (all the partisan differences in the third column of Table 2 are positive and statistically significant at the 10% level). There are several potential explanations for these baseline partisan gaps. Given that the attacks themselves occurred during the Bush Administration, it could be that Democratic respondents blame government officials more than Republican officials out of pure partisan bias. Or, it could be that Democratic identifiers are more anti-institutional in general. While extant research has suggested that Republicans are actually more distrustful of political institutions (e.g., Cook and Gronke Reference Cook and Gronke2005), there is little evidence about how this pattern might vary across policy domains. Democrats may be particularly distrustful of government officials in the domain of national security generally, or because national security policy at the time was being made by a Republican president (Citrin Reference Citrin1974). Regardless, our focus is not on these levels of blame attribution but rather the changes induced by the treatments. Since Democrats have a higher level of baseline blame, we will see that the “Democratic” cue causes the partisan gap to narrow, while the “Republican” cue expands it. This is because the “Democratic” cue counteracts the baseline high (low) levels of blame that Democrats (Republicans) have for the officials whereas the “Republican” cue reinforces this divide.
Model Estimates
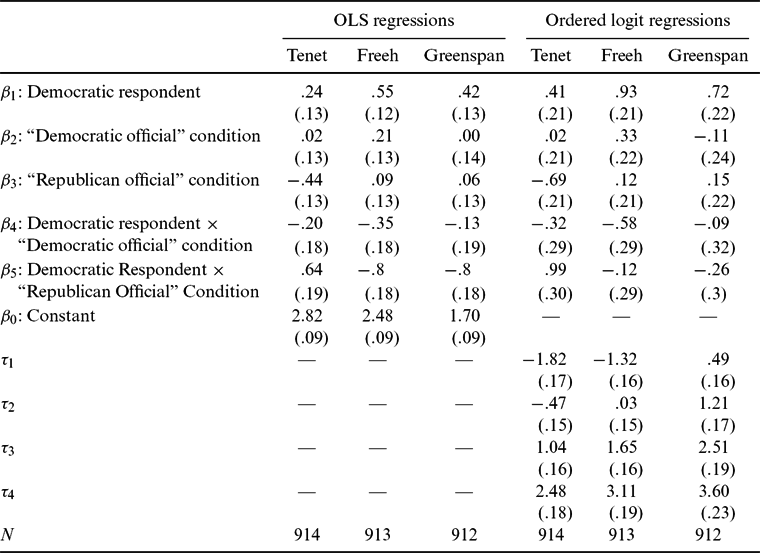
We present OLS and ordered logit model estimates from equation (1) in Table 3 for each of the three officials. Given the ease of interpretation and the similarity in the substantive results across model specifications, we describe the OLS results in detail here. The key estimands of interest (as defined in Table 1) are calculated from these regression estimates and presented in Table 4.
Model Estimates
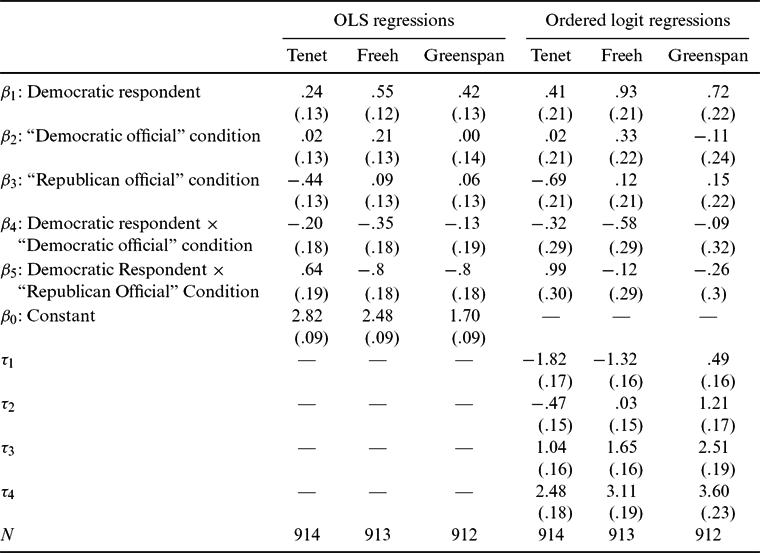
Note: Dependent variable is respondent’s reported blame of government officials on a five-point response scale ranging from “not at all” (1) to “a great deal” (5). Standard errors in parentheses. Covariate-adjusted estimates are from models including controls for age, gender, race/ethnicity, education, and marital status. Age entered into the specification linearly. All categorical variables were included as dummies.
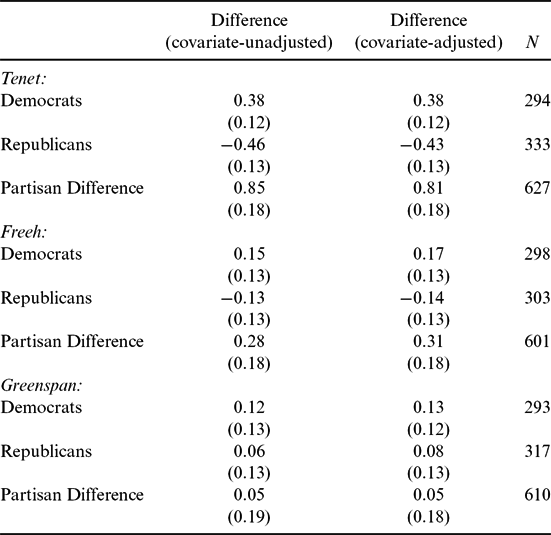
Difference in Blame Ratings between “Republican Official” Condition and “Democratic Official” Condition
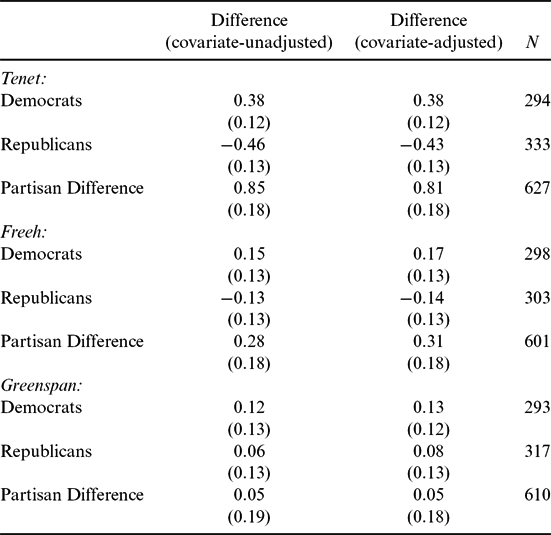
Note: Cells represent differences in blame ratings of government officials. Standard errors are in parentheses. Covariate-adjusted estimates are from models including controls age, gender, race/ethnicity, education, and marital status. Age entered into the specification linearly. All categorical variables were included as dummies.
We first describe the results for partisan subgroups before discussing how the treatment information affected the partisan gaps. As shown in the top row of Table 4, a “Republican” label makes Democratic respondents more likely to blame Tenet than a “Democratic” label (covariate-unadjusted: (β3 + β5) − (β2 + β4) = 0.38, p = .002;Footnote 12 covariate-adjusted: (β3 + β5) − (β2 + β4) = 0.38, p = .002). We see a similarly sized and oppositely signed effect for Republican respondents (see the second row of Table 4). A “Republican” label makes Republican respondents less likely to blame Tenet than a “Democratic” label (covariate-unadjusted: β3 − β2 = −0.46, p < .001; covariate-adjusted: β3 − β2 = −0.43, p = .001). The joint-null hypothesis that (β3 + β5) − (β2 + β4) = 0 and β3 − β2 = 0 is rejected at p < .001. We can combine the results from the Democratic and Republican subgroups to assess whether the partisan gap increased in response to the treatment information (see the third row of Table 4). Switching Tenet’s label from “Democrat” to “Republican” increases the partisan divide in blame attribution (β5 − β4) by about 0.85 points (covariate-unadjusted), or 21.3% of the total length of the scale, a substantively large amount and statistically distinguishable from zero (p < .001). Hence, for the most domain-relevant official (Tenet), we see clear evidence of partisan rationalization in blame attributions.
We see a similar pattern in the signs of the coefficients for Freeh (the next most relevant official), although the effects are considerably weaker (see the middle panel of Table 4). Democratic respondents are 0.15 percentage points more likely to blame him when he has a “Republican” label versus a “Democratic” label (p = .24), whereas Republican respondents are 0.13 percentage points less likely to blame him (p = .32). The coefficient estimates are similar when including covariates. The joint-null hypothesis that (β3 + β5) − (β2 + β4) = 0 and β3 − β2 = 0 cannot be rejected at conventional levels (p = .31). The difference between these treatment effects, captured by β5 − β4, is significantly different from zero at the 90% level (covariate adjusted). Switching Freeh’s label increases the partisan divide by a moderately sized, marginally significant 0.28–0.31 points (covariate-unadjusted: p = .125; covariate-adjusted: p = .087). Hence, the official in the middle in terms of domain relevance, as suggested by baseline levels of blame in the control group, also yields intermediate results with respect to partisan rationalization.
Finally, for Greenspan (the least domain-relevant official), there is no evidence of partisan bias. The difference between the “Republican official” and “Democratic official” conditions is statistically insignificant among both Republican respondents (covariate-unadjusted: p = .64; covariate-adjusted: p = .52) and Democratic respondents (covariate-unadjusted: p = .37; covariate-adjusted: p = .28). Switching Greenspan’s label from “Republican” to “Democrat” has almost no effect on the partisan gap in the blame rating (.05 points), both substantively and in terms of statistical significance (covariate-unadjusted: p = .78; covariate-adjusted: p = .78).Footnote 13 Thus, partisan bias in blame attribution decreases as the official becomes less domain-relevant.
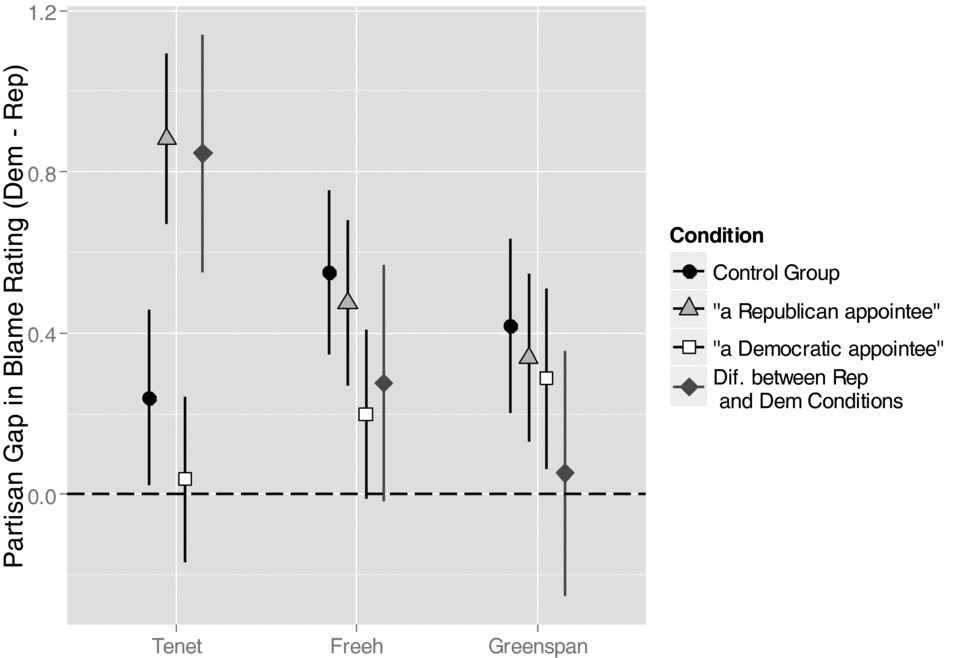
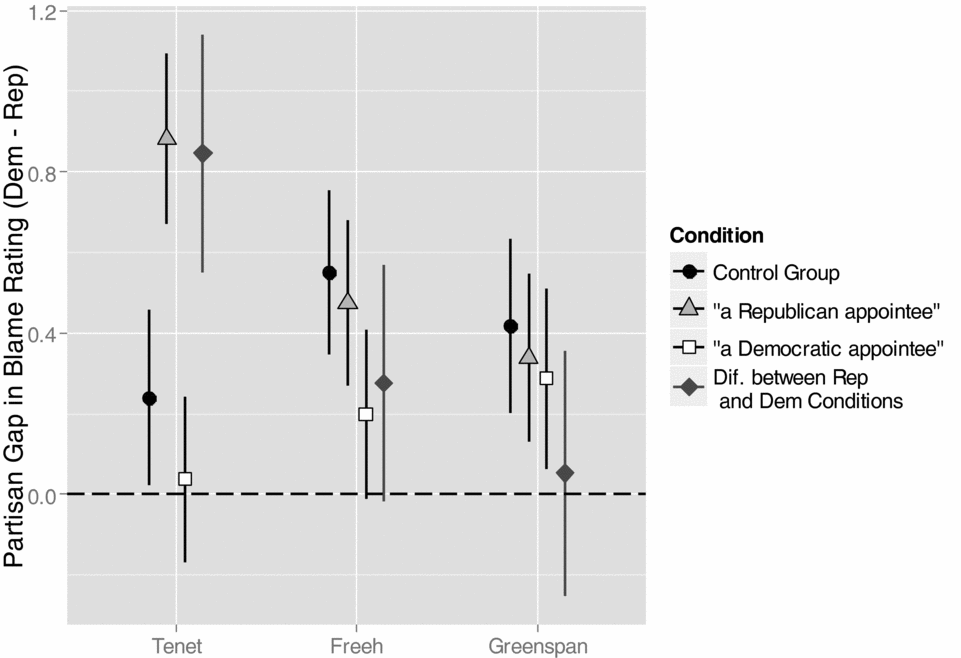
Figure 1 summarizes the results of the experiment by illustrating the partisan differences in the blame ratings of the three officials, or the average blame rating of Democratic respondents minus the average blame rating of Republican respondents (with 90% confidence intervals). These results correspond to those presented in the OLS estimations excluding control variables. The fourth set of points in Figure 1 (indicated by diamonds) describes our key quantity of interest: how the partisan divide changes when the official is referred to as “a Democratic appointee” compared to when he is referred to as “a Republican appointee.” By this measure, the figure shows that the level of partisan rationalization is highest for Tenet, moderate for Freeh, and virtually non-existent for Greenspan. The results show that citizens significantly rely upon partisan attachments in constructing blame attributions even in important contexts where the partisan attachments of officials in government should not matter. Further, this partisan bias in attributions is greater when the official is more domain relevant.
Partisan Gaps in Blame Ratings of Officials by Experimental Condition
DISCUSSION
Studying the psychological step of blame attribution is important for better understanding how citizens engage in retrospective voting. The psychological literature on group-serving bias (e.g., Taylor and Doria Reference Taylor and Doria1981) as well as the extensive political science literature on partisanship would suggest that partisan attachments are immensely powerful predictors of blame attribution after crisis events. However, such behavior would contradict Key’s (Reference Key1966) conception of democratic accountability, in which citizens reward incumbents of the opposite party for good performance and punish co-partisans for poor performance.
Our study found evidence of partisan rationalization in how citizens blame politicians in the wake of negative events. Our results come from a new experimental design that advances previous survey experiments methodologically by manipulating party labels for the same official in a real-world context. These experimental findings have some disconcerting implications for democratic accountability. It is precisely for the official deemed most responsible—for whom Key might predict that people pay the least attention to partisan labels—where partisan labels actually matter the most.Footnote 14 This suggests that when constructing blame attributions, citizens’ partisan biases may be most active in situations where there is actually more relevant information available. Future research should consider whether these findings apply to other cases of government failure.