I. Introduction
The dynamics of commodity price cycles are of continuing interest to researchers, policymakers, and market participants, in view of the significant impact on economic and financial developments around the world. Although commodity prices have long exhibited boom-and-bust patterns, with high and varying volatility in nominal and real terms, the past decade has witnessed a prolonged, broad-based upsurge followed by a deep slump with the global financial crisis and a bout of recovery afterward.Footnote 1 This paper explores empirically the causes of extreme fluctuations in commodity prices from January 1990 to June 2010 and seeks to identify the relative contribution of advanced and emerging market economies to the changes in commodity prices through a model that incorporates both supply- and demand-side variables on a global scale.
Analyzing two very distinct goods—crude oil and fine wine—could help identify common macroeconomics determinants of commodity prices. The spot price of crude oil, as measured by the monthly average of Brent and West Texas Intermediate, surged from $20 per barrel in January 2002 to $134 in July 2008, surpassing its 1980 record high in constant prices. Similarly, fine wine prices—measured by the Liv-ex Fine Wine Investable Index—increased by 243 percent over the same period. Triggered by the credit market turbulence, the sudden downturn in global economic activity lowered crude oil and fine wine prices by 70 percent and 42 percent, respectively, in the second half of 2008. The post-crisis recovery, however, brought about a renewed surge in crude oil and fine wine prices, which increased by 86 percent and 62 percent, respectively, between January 2009 and June 2010 (Figure 1). The statistical behavior of crude oil and fine wine prices has shown remarkable similarity, with a high degree of correlation during the sample period.Footnote 2 This co-movement raises important questions regarding the underlying determinants of two very different goods, with implications for other industrial and agricultural commodity prices. Even though fine wine as a differentiated product may not be an obvious choice, we reason that would make the empirical identification of the underlying macroeconomic factors even stronger.
Crude Oil and Fine Wine Prices

Is it possible to find a common model to capture the macroeconomic determinants of both crude oil and fine wine prices? The recent literature has provided three competing theories to explain the pervasive increase in agricultural and industrial commodity prices, as outlined by Frankel and Rose (Reference Frankel, Rose, Fry, Jones and Kent2009): (i) global demand growth; (ii) destabilizing financial speculation; and (iii) accommodative monetary policy. Notwithstanding the continuing debate over the nature of price volatility, a plethora of recent studies has emphasized demand-side factors as the main determinants of crude oil prices over the past decade (Barsky and Kilian, 2001, 2004; Belke et al., Reference Belke, Bordon and Hendricks2010; Hamilton, Reference Hamilton2009; Kilian, Reference Kilian2008, Reference Kilian2009; Kilian and Murphy, Reference Kilian and Murphy2010; Thomas et al., Reference Thomas, Mühleisen and Pant2010; Wirl, Reference Wirl2008). In particular, Kilian (Reference Kilian2009) showed that oil price shocks are mainly a result of global aggregate demand shocks, rather than oil supply shocks, as is usually thought. At the same time, most empirical research tends to explain the formation of wine prices with microeconomic matters such as climatic conditions, grape quality, age effects, and external quality ratings (Cardebat and Figuet, Reference Cardebat and Figuet2004; Gergaud, Reference Gergaud1999; Jones and Storchmann, Reference Jones and Storchmann2001; Lecocq and Visser, Reference Lecocq and Visser2006). Beyond wine prices, the literature has emphasized the recent role of environmental policies in determining agricultural commodity prices (Drabik, Reference Drabik2011; de Gorter and Just, Reference de Gorter and Just2009a, Reference de Gorter and Just2009b; de Gorter et al., Reference de Gorter, Drabik and Just2013). Nevertheless, we argue that global macroeconomic variables also account for the bulk of the variation in fine wine prices, similar to the behavior of crude oil prices, over the sample period. To the best of our knowledge, no study attempts to explain the common determinants of the behavior of two very distinct goods like crude oil and fine wine. Building on Cevik and Saadi Sedik (Reference Cevik and Saadi Sedik2011), Bouri (Reference Bouri2013) examines the dynamics of volatility transmission between crude oil and fine wine prices.
This paper makes three contributions to the literature on the behavior of agricultural and industrial commodity prices. First, we explicitly divide global demand into two separate components—emanating from advanced and emerging market economies—to empirically separate the underlying determinants of the shifts in the composition of crude oil and fine wine demand.Footnote 3 Second, unlike most studies, we use gross domestic product (GDP)–weighted monthly data, which contain more information than quarterly and annual series given the swift adjustment of commodity prices to shocks. Accordingly, monthly data permit better investigation of the effect of the underlying macroeconomic developments and their relative weight in determining (nominal and real) crude oil and fine wine prices. However, there is a trade-off in that monthly data of economic activity are not comprehensive.Footnote 4 Third, we introduce a measure of global excess liquidity—defined as the difference between broad money growth and estimates for money demand in the G-4 economies (i.e. Japan, the EU, the United Kingdom, and the United States)—to capture the impact of monetary developments on commodity price formation.
The remainder of the paper is structured as follows. Sections 2 and 3 describe recent developments in the oil and wine markets, respectively. Section 4 provides an overview of data used in the analysis. Section 5 outlines our methodology for modeling the behavior of crude oil and fine wine prices, while Section 6 focuses on interpreting results and identifies the key determinants of price fluctuations. Section 7 offers concluding remarks.
II. Developments in the Oil Market
Global supply of crude oil expanded at an annual rate of about 1.5 percent, on average, from 66 million barrels per day (mbpd) in 1990 to 85 mbpd in 2008 (BP, 2010).Footnote 5 Similarly, average global crude oil consumption grew from 67 mbpd in 1990 to 77 mbpd in 2000 and 86 mbpd in 2008 (Figure 2). Furthermore, the composition of crude oil consumption has shifted from advanced to emerging market economies, as between 1990 and 2008 the crude oil demand surged 52 percent in non-Organization for Economic Cooperation and Development (OECD) countries, compared with an increase of 14 percent in OECD countries. In other words, emerging market economies made the greatest contribution to the upsurge in global crude oil demand, accounting for 69 percent of the increase in world oil consumption between 1990 and 2008 and more than 100 percent of the change in global crude oil demand since 2000, as oil consumption in OECD countries declined during that period.
Global Crude Oil Supply and Demand
From 1950 to the early 1970s, total primary energy consumption and real GDP increased at almost the same annual rate. In contrast, from the mid-1970s to 2008, the relationship between energy consumption and real GDP growth changed dramatically, with energy use expanding at less than one-third the previous average rate while output growth continued at its historical rate (EIA, 2010). This structural shift in the relationship between output growth and energy consumption resulted in a sustained decline in energy intensity in advanced economies.Footnote 6 However, greater specialization of relatively energy-intensive industrial sectors and higher per capita income growth raising personal energy consumption kept hydrocarbon use per unit of output in emerging market economies at an elevated level. Consequently, this structural shift toward faster-growing and less price-responsive emerging market economies has dominated global aggregate oil demand, especially over the past decade.Footnote 7 Accordingly, despite the decline in crude oil demand in advanced economies—reflecting the more efficient use of energy, the price of crude oil increased almost sixfold in nominal terms from $20 per barrel in January 2002 to $134 in July 2008.
The credit market turbulence, following the Lehman Brothers failure in 2008, led to a contraction of global economic activity and consequently a collapse in world oil demand. Crude oil prices declined 70 percent from the peak in July 2008 to $41 per barrel by the end of that year. Member countries of the Organization of Petroleum Exporting Countries (OPEC) limited production in an attempt to bolster oil prices in the face of the sudden fall in consumption. As global demand for crude oil shrank by 3 percent from 86 mbpd in 2007 to 84 mbpd in 2009—the largest decline since 1982—mainly because of the contraction in advanced economies, global crude oil production declined 1.4 percent from 85 mbpd in 2008 to 84 mbpd in 2009. Coupled with tighter oil supply, the recovery in emerging market economies helped boost crude oil prices by about 75 percent from January 2009 to a range of $70 to $80 per barrel during the first half of 2010.
III. Developments in the Wine Market
Worldwide areas planted with vines receded by 1.6 percent, from an average of 7.971 million hectares in the 1990s to 7.823 million hectares in the 2000s. Nevertheless, grape output expanded by 14 percent, from 573 million quintals to 653 million quintals over the same period; and global wine production recorded an increase of 1.5 percent, from 269 million hectoliters to 273 million hectoliters. At the same time, global wine consumption—excluding industrial use—increased by 5 percent, from an average of 226 million hectoliters in the 1990s to 245 million hectoliters in 2008, and then dropped 4 percent, to 237 million hectoliters in 2009. Like the changing dynamics of global energy demand over the past decade, the wine market has experienced structural changes, especially on the demand side.
Global wine trade has increased rapidly over the past decade, as rising income levels, especially in emerging economies, have spurred consumption and greater interest in investment grade wine as an alternative asset for portfolio diversification. While per capita wine consumption has declined in mature markets such as France and Italy, from 73 liters and 62 liters a year per person, respectively, in 1990 to 51 liters and 44 liters in 2008, wine consumption in emerging countries has grown from a very low base and hence accounted for the bulk of growth in global demand for high-quality, investment-grade wine (Figure 3). At the same time, fine wine prices increased by 269 percent in dollar terms between January 2000 and July 2008. The global financial turmoil and the ensuing recession had an adverse impact on global wine demand, prompting a 42 percent drop in fine wine prices in the second half of 2008. From the beginning of 2009 until June 2010, the Liv-ex Fine Wine Investable Index rose by 62 percent, close to its pre-crisis level, outperforming global equity and commodity market indices.
Global Wine Supply and Demand
IV. Data
We use monthly variables to identify the common determinants of crude oil and fine wine prices. The period covered in the study is dictated mainly by data availability. Wine production data are available only from 1998 onward. As a result, we estimate the determinants of real crude oil and fine wine prices over the period 1998–2010. For crude oil prices, however, we also estimate the equations for the entire period 1990–2010 and the subperiod 1990–97. The dollar-denominated price of crude oil is based on the monthly average of Brent and West Texas Intermediate. Unlike crude oil, wine is a heterogeneous product derived from grapes of various varieties grown in different regions, and therefore there is no “global wine price” comparable to the price of crude oil. For that reason, we make use of the Liv-ex Fine Wine Investable Index—a composite monthly price index consisting of Bordeaux red wines from twenty-four leading châteaux and chosen on the basis of their Robert Parker rating scores.Footnote 8 This transaction price-weighted index is denominated in pounds and calculated according to the midpoint between the highest bid price and lowest offer price for each component wine on the Liv-ex trading platform. We convert the pound-denominated Liv-ex Fine Wine Investable Index into a dollar-based series and deflate both nominal crude oil and fine wine prices with the U.S. Consumer Price Index.
On the supply side, we use monthly global crude oil production data published by the U.S. Energy Information Administration (EIA), and wine production figures are taken from the Organisation Internationale de la Vigne et du Vin (OIV).Footnote 9 For the demand side, we constructed monthly industrial production series for advanced and emerging economies, which allow us to differentiate between the impact of advanced and emerging economies on crude oil and fine wine prices. High-frequency industrial production series are aggregated using GDP weights, covering 22 advanced economies and 35 emerging economies, representing 64 percent of world GDP and 29 percent, respectively. Using these aggregates has the advantage of distinguishing the sources of changes in global crude oil and fine wine demand. We also introduce global excess liquidity to capture the direct and indirect effects of global monetary developments. This indicator represents a broad measure of excess liquidity, defined as the difference between broad money growth and estimates for money demand in the G-4 economies (the eurozone, Japan, the United Kingdom, and the United States). While broad money growth is measured by the respective changes in M2, money demand is estimated from the potential growth rate and velocity over the long term. Trend velocity growth is calculated according to average velocity growth over the long run in the respective economies, except for the eurozone, where it is based on the midvalue of the range for velocity growth as derived by the European Central Bank. The measure is then converted to a composite G-4 excess liquidity indicator using GDP weights.
V. Modeling Crude Oil and Fine Wine Prices
Empirical literature on the behavior of commodity prices is abundant and diverse. While supply bottlenecks were responsible for first oil shock in the 1970s, the recent boom-bust cycle cannot be explained without accounting for the changes in aggregate demand and global financial conditions. Using monthly data on a range of heterogeneous commodity prices and macro variables for the U.S. economy, Pindyck and Rotemberg (Reference Pindyck and Rotemberg1990) found that the prices of unrelated commodities tend to move together, even after controlling for the effects of common macroeconomic shocks. Other studies, however, could not find strong evidence for “excess comovement” in commodity prices (Cashin et al., Reference Cashin, McDermott and Scott1999; Leybourne et al., Reference Leybourne, Lloyd and Reed1994; Palaskas and Varangis, Reference Palaskas and Varangis1991).
Borensztein and Reinhart (Reference Borensztein and Reinhart1994), however, introduced “a broader view” of global demand including some transition economies and found significant results. But their approach was based on a problematic proxy, covering a small number of emerging market economies, with annual GDP figures interpolated into a quarterly series. More recently, Kilian (Reference Kilian2009) constructed a monthly measure of global economic activity based on an index of dry cargo, single-voyage freight rates. Although this index has a positive correlation with global economic growth, it does not allow us to differentiate the sources of aggregate demand growth in the world economy. For that reason, we prefer a more comprehensive definition of global aggregate demand and to use monthly industrial production indices separately for advanced and emerging economies to analyze the impact of aggregate demand growth.
The empirical model is based on macroeconomic variables and delivers robust results for the behavior of both crude oil and fine wine prices. We investigate the determinants of crude oil and fine wine prices in real terms, using monthly data from January 1998 to June 2010.Footnote 10 Our econometric model can be summarized as follows:
 $$\Delta P_t = \beta _0 + \beta _1 \Delta IPI_{t,advanced} + \beta _2 \Delta IPI_{t,emerging} + \beta _3 \Delta Prod_t + \beta _4 Exliquid_t + \varepsilon _t $$
where ΔP t is the growth rate of real price of crude oil or fine wine at time t; ΔIPI advanced is the growth rate of industrial production index for advanced countries; ΔIPI emerging is the growth rate of industrial production index for emerging market economies; ΔProd t is the growth rate of production of oil or wine; Exliquid t is the global excess liquidity; β 0 to β 4 are parameters to be estimated; and ε t is the error term.
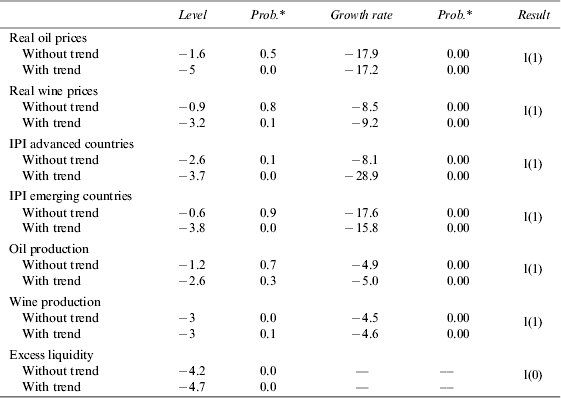
We deal with the seasonality patterns and the nonstationarity evident in some of the variables by using twelve–month differences, rather than first differences. As shown in Appendix Table 1, the unit-root hypothesis could not be rejected for some of the variables in logarithms, but all variables in the growth rate were found to be stationary.Footnote 11 Some right-hand-side variables could be endogenous to price movements. In other words, the fluctuations in crude oil and wine prices could influence their demand and production. Consequently, some of the right-hand-side variables could be correlated with the disturbance term. To deal with this potential endogeneity issue, we also estimate Equation (1) with instrumental variables using the generalized method of moments (GMM) approach, which also corrects for potential biases stemming from the fact that some of the explanatory variables are measured with error.Footnote 12
VI. Interpreting Empirical Results
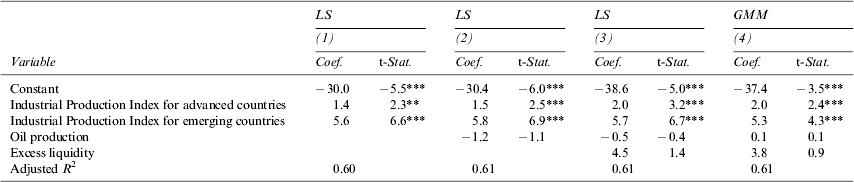
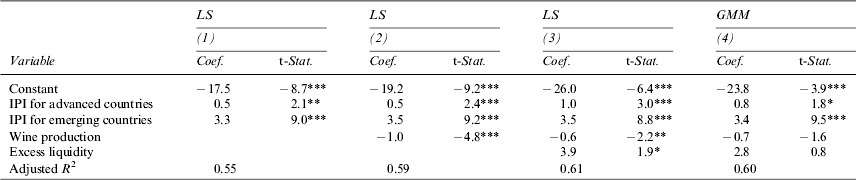
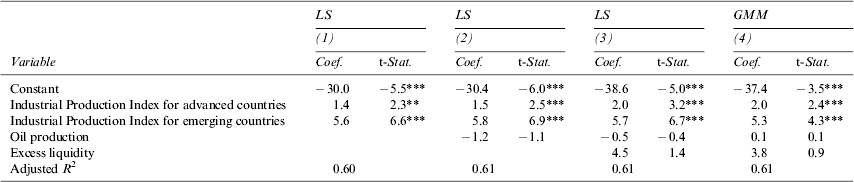
The findings of our empirical analysis, summarized in Tables 1A and 1B, are robust and statistically significant. The model fits the data very well and explains about two-thirds of the changes in crude oil and fine wine prices between January 1998 and June 2010, as measured by the adjusted R-square. This is a strong result, especially given that we use monthly data and no lagged dependent variables in the regression. The econometric results show that supply constraints have the expected effect, but demand-side factors have a dominant effect on crude oil and fine wine prices over the sample period. These findings are consistent with Kilian (Reference Kilian2008, Reference Kilian2009) who found that aggregate demand shocks explain most of the movements in the real price of crude oil.
Results for Real Oil Prices, 1998–2010
Results for Real Wine Prices, 1998–2010
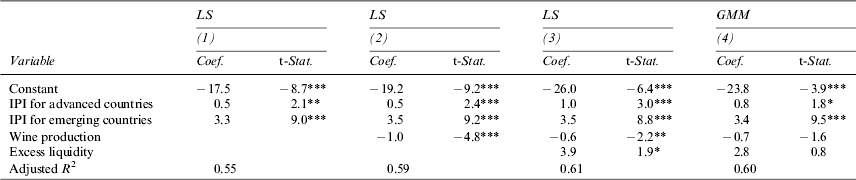
Source: Datastream, Energy Information Administration, International Financial Statistics, Liv-ex, Organization Internationale de la Vigne et du Vin, and authors' calculations.
Notes: The sample covers monthly data from January 1998 to June 2010; all variables are year-on-year percentage changes with the exception of excess liquidity; all variables are stationary; Newey-West estimator were used to address both heteroskedasticity and autocorrelation issues. *** p < 0.01, ** p < 0.05, * p < 0.1.
Crude oil production has the correct negative sign, but it is not statistically significant across all specifications of the model. Decomposing crude oil production into OPEC and non-OPEC production gives similar results, even though the coefficient on OPEC production is smaller than that for non-OPEC production. This may reflect the OPEC policy of changing production in an attempt to stabilize international oil prices. However, the coefficient on wine production is significant in all specifications with the correct sign.
The coefficients on industrial production growth in advanced and emerging market economies are highly significant in all specifications for both crude oil and fine wine equations.Footnote 13 The coefficient of emerging-market industrial output growth is about three times as high as that of advanced economies in oil price regressions and almost five times as powerful in fine wine price regressions. The differences between these two coefficients are also statistically relevant.Footnote 14 Even though advanced economies account for more than half of global oil and wine consumption, the rate of aggregate demand growth emanating from emerging economies is the key factor influencing commodity prices. Emerging economies grew at an average of 6.4 percent per year—more than three times the rate of growth in advanced economies, thereby making up the bulk of the incremental change in global commodity demand. Furthermore, in the aftermath of the global financial crisis, there has been a further decoupling of growth between advanced and emerging economies. While average industrial output contracted by 10 percent in advanced economies between mid-2008 and the end of 2009, emerging economies continued to grow at an average of 1.4 percent over the same period, contributing to the strength of commodity prices even against the backdrop of intense credit market problems and recession in the advanced economies.
The econometric results are consistent with crude oil and fine wine being superior goods, especially in emerging markets. First, although advanced economies still accounted for 53 percent of global oil demand in 2009, their share declined from 63 percent in 1999, and the share of emerging economies rose from 37 percent of world oil consumption to 47 percent over the same period. Second, with greater specialization in energy-intensive industrial sectors and increasing per capita energy consumption, oil demand from emerging economies grew by 37 percent, on a cumulative basis, between 1999 and 2009, while oil demand from advanced economies contracted by 5 percent over the same period. The available data suggest that global wine consumption followed similar trends, and hence the results show a comparable sensitivity pattern. A one-percentage-point increase in the income level of emerging economies has higher wine demand content than in advanced economies. At this stage of development, emerging market economies tend to be more commodity intensive per unit of income but also consume less on a per capita basis, compared with advanced economies. Therefore, higher income elasticity dominates the behavior of emerging-market commodity demand, along the lines of superior goods, making emerging economies the main source of marginal demand.
Global liquidity conditions influence the behavior of oil and wine prices through their effect on global demand. Global excess liquidity seems to have some role in crude oil and fine wine price fluctuations. Between 2000 and the first half of 2008, our measure of global excess liquidity increased by 71 percent, reinforcing the above-trend real GDP growth, especially in emerging market economies. With the rapid financialization of industrial and agricultural commodity markets in recent years, many commodity prices are more directly exposed to fast-moving capital flows and various macroeconomic shocks. In our view, the results do not necessarily imply financial speculation, and global excess liquidity associated with low real interest rates is likely to have magnified the price pressures stemming from imbalances between supply and demand.
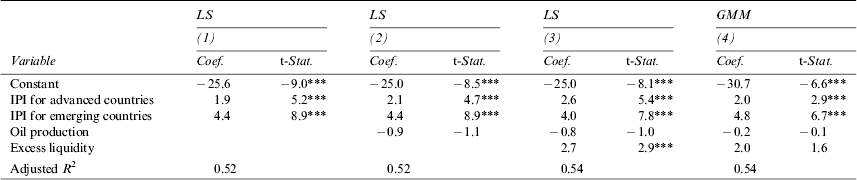
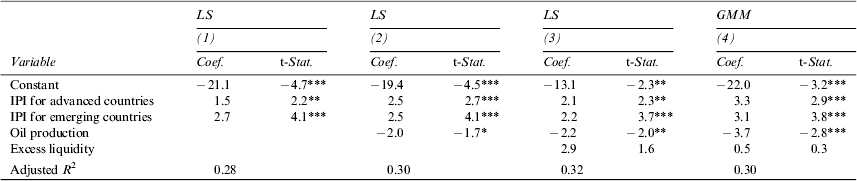
For oil prices, comparison of the period 1990–1997 with the entire sample, as presented in Tables 2 and 3, the entire sample suggests that the shift in aggregate commodity demand is a recent phenomenon. Differences between the coefficients of industrial production growth in advanced and emerging market economies are smaller for the whole period; and coefficients are almost the same for the period 1990–1997. The ratio of average coefficients of emerging economies to advanced economies is 3.2 over 1998–2010; it declines to 2 for the entire period 1990–2010 and to 1.1 for the period 1990–1997 (Table 4).
Results for Real Oil Prices, 1990–2010
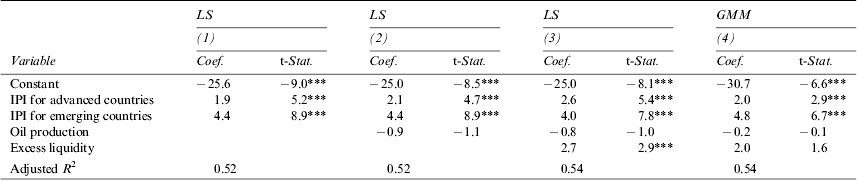
Source: Datastream, Energy Information Administration, International Financial Statistics, and authors' calculations.
Notes: The sample covers monthly data from January 1990 to June 2010; all variables are year-on-year percentage changes with the exception of excess liquidity; all variables are stationary; Newey-West estimator were used to address both heteroskedasticity and autocorrelation issues. *** p < 0.01, ** p < 0.05, * p < 0.1.
Results for Real Oil Prices, 1990–1997
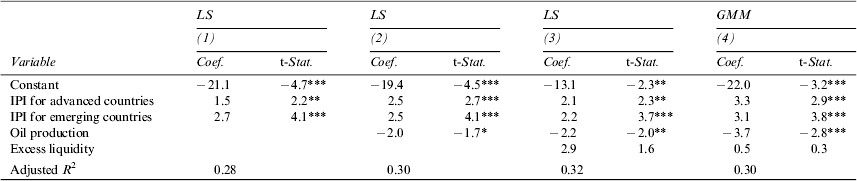
Source: Datastream, Energy Information Administration, International Financial Statistics, and authors' calculations.
Notes: The sample covers monthly data from January 1990 to June 2010; all variables are year-on-year percentage changes with the exception of excess liquidity; all variables are stationary; Newey-West estimator were used to address both heteroskedasticity and autocorrelation issues. *** p < 0.01, ** p < 0.05, * p < 0.1.
Average Coefficients for Real Oil Prices

Source: Datastream, Energy Information Administration, International Financial Statistics, and authors' calculations.
VII. Conclusion
In this paper, we empirically investigated the macroeconomic determinants of crude oil and fine wine prices, using the same set of macroeconomic indicators, and found that global fundamental factors dominate commodity price trends. The growth rate of global aggregate demand is the key determinant of fluctuations in both crude oil and fine wine prices over the sample period. Although supply constraints have the expected sign, they have a limited effect on the pricing process. This is consistent with the findings of Kilian (Reference Kilian2009), and Kilian and Murphy (Reference Kilian and Murphy2010) that the fluctuations in crude oil prices were caused by fluctuations in the flow demand for crude oil driven by the global business cycle. Our analysis also shows that while advanced economies account for more than half of global crude oil and wine consumption, emerging market economies make up the bulk of the incremental change in aggregate demand and therefore are of greater significance in determining price fluctuations. Furthermore, the results of our econometric analysis confirm that global liquidity conditions, as measured by the difference between broad money growth and estimates for money demand in the G-4 economies, also have some influence on the evolution of crude oil and fine wine prices. While the impact does not necessarily imply financial speculation, global excess liquidity associated with low real interest rates is likely to have magnified the price pressures stemming from imbalances between supply and demand.
The composition of crude oil consumption has shifted from advanced to emerging economies, as crude oil demand of non-OECD countries surged 52 percent between 1990 and 2008, compared with an increase of 14 percent in OECD countries. Put differently, emerging market economies accounted for 69 percent of the increase in world crude oil consumption between 1990 and 2008—and more than 100 percent of the change in global crude oil demand since 2000—because the crude oil consumption of OECD countries declined during that period.
In the foreseeable future, given these structural changes in energy intensity and oil demand per increment of GDP in emerging economies, the low price elasticities of crude oil supply and demand are likely to keep oil prices highly sensitive to the changes in supply and demand. We observe similar trends in a wide range of other industrial and agricultural commodities, including wine, and expect emerging market economies to remain a key determinant of global aggregate commodity demand in the future. Although commodity-intensive industrialization and strong per capita income growth with increasing population and urbanization are likely to reinforce the upward shift in aggregate commodity demand, emerging market economies have introduced policy measures, including the rationalization of fuel subsidies, to improve energy efficiency and expand the exploration of alternative energy sources. Looking forward, according to our estimations, a one-standard-deviation decline in industrial production growth in emerging market economies (or four percentage points) would induce a 22 percent decline in real crude oil prices and a 15 percent fall in real wine prices.
The recent cycle has shown that many commodity prices move in the same direction at the same time—rising in tandem between 2003 and mid-2008 and collapsing simultaneously in the second half of 2008. Even though microeconomic considerations are certainly important in determining the behavior of commodity prices, the results presented in this paper make it difficult to ignore the influence of common macroeconomic factors. Accordingly, a valuable extension of our analysis would cover a broader set of industrial and agricultural commodities. Another interesting question, particularly from a financial viewpoint, is whether including commodities like fine wine in asset allocation would improve portfolio diversification. Our results suggest that although fine wine can be considered an investable asset, its behavior is not significantly different from that of other commodities and therefore may fail to enhance portfolio diversification.
Stationarity Tests Phillips-Perron Test