


INTRODUCTION
Research on language use on the internet is by now an industry complete with themes, factions, and fields of study (e.g. Androutsopolous Reference Androutsopolous2014). Virtually all of this research, however, is based on what is publically available on the internet. What remains hidden is how people are interacting within each other inside the internet where one-on-one discourses are transpiring in a worldwide beehive of communication. What type of language do people use when they communicate with each other using device-based mediation, a phenomena referred to as CMC (computer-mediated communication) (Kiesler, Siegel, & McGuire Reference Kiesler, Siegel and McGuire1984)? This is a question that seems simple enough, but when it comes to finding out, it soon becomes apparent that neither scientists, nor journalists, nor teachers are actually privy to the day-to-day interactions between people, as they tap away at their computers and phones. What type of language do they use? Perhaps most compelling, what type of language do the digital natives use, contemporary youth? Consider the examples in (1) and (2), which come from one-to-one communications of instant messaging (IM) (via computer) and texting on phones (SMS) circa 2010.
(1) a. can u sav it if u can? cuz i havnt left home yet (SMS)
b. well at ur standards u said i would be content but still striving 4 better (IM)
(2) a. N hope to c u tmr haha if u make it.. Class is so boring (SMS)
b.yeee wuts ur gf sayin is she gonna mind u goin to clubs haha(IM)
It is not difficult to see why this type of communication has incurred the wrath of teachers, writers, and others. Punctuation, spelling, short forms, informal features, and other aberrant phenomena seem to abound; at least that is often the proclamation in reports in the media, which typically comprise headlines with several anomalous (supposedly typical) forms typical of internet ‘lingo’, for example, ‘Nvm about the lolls’ (Girard Reference Girard2006). The question is, whose language are they talking about, what community, and which individuals? Language use on the internet has increased exponentially in the last few decades; however, users born in the late 1980s are key to the study of CMC because they are essentially ‘native’ speakers of internet language, the first generation of individuals born and raised when internet communication is the norm. In these vastly complex social networks, let us zoom in on a sector of the population that has used internet as part of their lives for as long as they have known how to read—the digital natives of the early twenty-first century—teenagers and early twenty-year-olds. In this article, I undertake an analysis of a unique corpus of internet language collected between 2009–2010. The data come from communications among young Canadians aged seventeen to twenty-one from across a range of different CMC registers that they use on a daily basis, including instant messaging (IM) on computers, email (EM), and text messaging on phones (SMS). However, reporting what is happening on the internet and the methods for seeking out and documenting what is actually happening between people who communicate using CMC on a regular basis are two quite distinct enterprises and the results are surprising.
COMPUTER-MEDIATED COMMUNICATION
The term computer-mediated communication first appeared in Kiesler et al. (1984:1123), whose goal was to analyze the social psychological implications of the rise and spread of the internet and network-based communication. At the time, CMC users were a rarified sector of the general population, primarily the originators of ARPANET, a system created by the United States Department of Defense and GTE Telenet:
Because electronic communication was developed and has been used by a distinctive subculture of computing professionals, its norms are infused with that culture's specific language… they use language appropriate for boardrooms and ballfields interchangeably. (Kiesler et al. Reference Kiesler, Siegel and McGuire1984:1126)
Thirty years later, internet language is no longer relegated to computing professionals. It has spread to the point where virtually everyone in Western society uses the internet on a daily basis—businessmen, baseball players, and everyone in-between.
In the early 2000s David Crystal coined the term Netspeak to refer to the language that was developing on the internet, defining it as ‘a type of language displaying features that are unique to the internet…, arising out of its character as a medium which is electronic, global, and interactive’ (Crystal Reference Crystal2006:20). It soon became apparent, however, that these features of Netspeak were not unique to the internet. Variants of laughter, including the infamous lol effervesced as a feature of CMC; however, two of the most common variants, haha and hehe, have existed in written language since as early as 1000 AD (OED) and the supposed internet acronym lol was apparently used in a letter written by Admiral John Fisher to Winston Churchill in 1917.Footnote 1 Moreover, many researchers note that even ‘the abbreviations and non-standard spellings typical of … [CMC]… are not really new. They carry on earlier practices from chat; going back further still… much like [how] teens of earlier generations passed notes ‘encrypted’ in special alphabets or writing permutations’ (Herring Reference Herring2004:32–33). Therefore, not only have specific forms common to CMC existed for centuries, the use of acronyms, nonstandard spellings, initialisms, and other short forms have longitudinal precedence as well.
By the early twenty-first century, it became clear that CMC was a diverse range of different registers rather than any monolithic variety. The only common baseline is that the communication happens by way of an electronic device and is typed (i.e. written rather than spoken). While early definitions restricted CMC to computers, for example, ‘any natural language messaging that is transmitted and/or received via a computer connection’ (Baron Reference Baron and Farghali2003:10), more recent definitions extend the scope to mobile phones, for example, ‘predominantly text-based human-human interaction mediated by networked computers or mobile telephony’ (Herring Reference Herring2007:1). This circumscribes CMC to written communications through technology. Because technology is so varied, so too is CMC.
CROSS-REGISTER COMPARISON
Norms of language use in CMC have been in the process of conventionalization over the past twenty to thirty years. Thus, in the midst of technological and cultural developments, there is a tremendous opportunity to tap how language itself is changing in tandem.
As a framework for comparison, I make use of Baron's (Reference Baron and Farghali2003:56) continuum of CMC registers, which is based on situational parameters of register variation (Biber & Finnegan Reference Biber and Finnegan1994:40–41, Table 2.1). Four situational factors distinguish the CMC registers represented in our study: participants, platform, time, and editing. Participants refer to whether the communication is monologic (i.e. no immediate feedback) or dialogic (incorporating feedback). Formal writing is generally monologic, whereas speech is generally dialogic. Platform refers to the physical characteristics of the register. Formal writing is found in print. In this study the written component comprises a written document submitted for assessment in education, that is, an essay. EM and IM are used on a computer but on different platforms. SMS is used on a mobile phone. Time refers to whether the register is time-independent and durable or time-dependent and ephemeral. Writing is generally time-independent. Writers may take time to edit and structure their texts in order to create a permanent document. Speech is time-dependent and ephemeral. Speech requires an almost immediate response and is typically not permanent. CMC registers are positioned in between. Finally, there is the factor of editing. Writing typically allows for editing whereas speech does not. These criteria offer a means to categorize CMC registers, as shown in Table 1 based on Baron (Reference Baron and Farghali2003:56).
Comparison of CMC registers.

Sample constitution, TIC Internet Corpus.

The goal of this study is to compare and contrast language use across registers of CMC using evidence from the frequency and patterning of linguistic features. In essence, in what ways is CMC a ‘linguistic centaur’, that is, a register ‘incorporating features from both traditional writing and face-to-face discourse’ (Baron & Ling Reference Baron and Ling2003:23)?
Three analyses were conducted that maximally triangulate across linguistic variables from different levels of grammar and contrast different types of change. First, following in the footsteps of earlier research (e.g. Ling Reference Ling, Ling and Pedersen2005:294; Tagliamonte & Denis Reference Tagliamonte and Denis2008:12), we assess claims regarding the frequency of short forms, acronyms and initialisms that often serve as shibboleths of CMC communication (see Romaine Reference Romaine and Biber1994 on register makers in sports announcing). As a cover term, we use the term CMC forms. Beginning with a straightforward inventory of the twenty most common CMC forms in the data, we compare their frequency across registers. Previous research suggests that these forms are characteristic of all types of CMC (Ferrara, Brunner, & Whittemore Reference Ferrara, Brunner and Whittemore1991; Thurlow Reference Thurlow2003; Tagliamonte & Denis Reference Tagliamonte and Denis2008); however, SMS may have a greater frequency of shortened forms because texters try to convey as much information in as little text as possible (Davies Reference Davies2005:103–4). To date no consistent comparison across registers has been reported nor, in particular, in a dataset that compares how the same speakers might shift from one register to another.
Second, we delve deeper into linguistic patterns by targeting not simply the surface forms, but also their alternation with like forms. The variants of laughter, including lol and haha are an ideal choice due to their frequency and diffusion across the individuals in the corpus. Laughter can be considered a litmus test for the speech-like nature of a register since it is endemic to spoken discourse. Finally, we perform two variation analyses of two areas of English grammar that are presently undergoing change. Research has demonstrated that teenagers push forward innovating forms (e.g. Eckert Reference Eckert1988; Tagliamonte Reference Tagliamonte2008). If CMC is in the vanguard of innovation in language, CMC registers can be expected to offer insights into its diffusion. More speech-like CMC registers can be expected to pattern along with the spoken language in taking up innovative forms sooner than written language or perhaps even in advance of the spoken language. Further, by probing linguistic systems that have been recently studied in contemporary English it will be possible to determine how CMC compares with the extant language of the ambient speech community from which the CMC is situated, in this case a major urban centre in North America. The first analysis targets a rapid and recent development, the use of intensifier so in the English intensifier system, as in (3) and (4). This variant is so new that it has not yet penetrated written language and remains a colloquial feature.
(3) l: its so true!
ml13: x)Footnote 2
l: for girls, its so true… (l, IM, 2010)Footnote 3
(4) it was so stupid most of those people are plastic teeny bobbers! it made me so mad(m, EM, 2010)
The second targets a linguistic system that has been evolving for several hundred years in the history of English—the future temporal reference system. This is an ongoing linguistic development in which the verb go has gradually come to be used in places where will/'ll is the standard (prescribed) variant, as in (5).
(5) a. I'm going to be home…like…ten ten (q, SMS, 2009)
b. the stress of Grade 12 is going to shock her so much. (M, EM, 2010)
c. i like this pen, i think im gonna steal it (z, EM, 2009)
While going to is not stigmatized, it continues to be regarded as an informal feature and its status as a grammatical marker in contemporary dialects is variegated, from about 50% of the system in urban Toronto (Tagliamonte & D'Arcy Reference Tagliamonte and D'Arcy2009) to barely 10% of the system in some rural dialects (Tagliamonte, Durham, & Smith Reference Tagliamonte, Durham; and Smith2014). More speech-like registers can therefore be hypothesized to pattern along with the spoken language, while written-like registers can be expected to retain the conservative variants. Further nuances of register may also come to light due to the explicit comparison of linguistic variables from different levels of grammar, which change in different ways and contrast by prestige and nature. For example, intensifier so and future marker going to are both incoming forms but they have different social evaluation. So was reportedly vogue in the early 1900s but then subsided, returning to prominence among female teenagers in the early 2000s (Tagliamonte Reference Tagliamonte2008), seeming to correlate with fashion. Going to is only informal, a change from below that has been increasing to mark future marking in English since the 1400s (Danchev & Kytö Reference Danchev, Kytö and Kastovsky1994). Synthesizing across the results from these different features (CMC forms, orthographic variants, intensifiers, and tense markers) gives us maximal coverage across the grammar in order to provide insight into the linguistic nature of CMC.
THE LANGUAGE OF YOUTH
Youth language has long come under scrutiny; however, with the advent and expansion of the internet, a building uproar emerged. Thurlow (Reference Thurlow2006) presents list of 101 popular news articles about the language of CMC and young people, which together make foreboding predictions such as a threat to literacy, the destruction of language, widespread use of abbreviations, and truncated language, with teenagers implicated as the culprits. While much of the early hype has subsided, countless popular news sources continue to suggest that the language of CMC and SMS, and IM in particular, is not only leading to grammatical ruin, but also impeding children's ability to write properly, as this oft-cited quote from the American Teachers’ Association suggests:Footnote 4
Text and instant messaging are negatively affecting students’ writing quality on a daily basis, as they bring their abbreviated language into the classroom. As a result of their electronic chatting, kids are making countless syntax, subject-verb agreement and spelling mistakes in writing assignments.
CMC is typically claimed to be the root of this ruin. Kiesler et al. (1984:1126) suggest that CMC is littered with examples of profane language, later termed ‘flaming’, (Baron Reference Baron and Farghali2003:21), lack of standard salutations, structure, and reduced self-regulation. Davies (Reference Davies2005:103–4) describes the language of text messages as follows:
writers of text messages quickly become adept at reducing every word to its minimum comprehensible length, usually omitting vowels wherever possible, as in Wknd for Weekend, Msg for Message, or deliberately using shorter misspellings such as Wot for What.
Indeed, not only is language adversely affected, so is sleep (‘Text messaging is spoiling teenagers’ sleep’, Dobson Reference Dobson2003), intelligence (‘Infomania worse than marijuana’, Daily Mail 2005Footnote 5, and social skills (‘Teen texting soars: Will social skills suffer?’, NPR NewsFootnote 6. Teenage language has a bad reputation for many aspects of behavior, but most especially the breakdown and degradation of language.
Given these serious criticisms, one would think that the evidence brought to bear would be substantive. However, virtually all of the discussion about teenage language on the internet is based on anecdote, hearsay, and self-reports. There are very few empirical studies of authentic usage, which leads to the important question: what are teenagers actually doing? Further, as most linguists know, linguistic innovation among youth is not solely the result of the internet. Language is in fact always changing. A more informed question is whether or not the internet is making any difference to the otherwise normal processes of language change. Our study offers fresh insights to this question. It is based on literally thousands of words from a world of communication that has not been accessible before—extensive personal CMC interactions among contemporary youth and their friends.
DATA AND METHODS
This section describes the state of CMC at the time of the study and the nature of the different registers in the Toronto Internet Corpus (TIC), which is summarized in Table 2.
During a thirteen-week course, students completed a series of assignments that involved collecting CMC interactions between themselves and their friends in three internet registers: email, instant messaging, and texting on phones. For example, ‘Assignment 3, Instant messaging’ was described as follows: ‘Submit an electronic version of an instant messaging interaction with a friend your own age. Your contribution must be at least 1,000 words’. This instruction inevitably produced some data, as in (6).
(6) friend: yo should we do 2000words or 1000words
b: only 1000 words
b: short and easy
friend: last time it was 2000words wasnt it
b: yes it was
friend: ok it will end faster than last time
b: yeah omg im already so tired(b, IM, 2010)
An ancillary component of the course was to introduce and discuss issues of ethical conduct in human subjects research. Students were taught the basics of informed consent and were guided in following standard ethical procedures for data collection, including signing informed consent documents themselves and administering them to all their interlocutors. In addition, all students in the course signed ethics clearance forms in order to use the combined data from all students for their final papers.
A key attribute of the materials in the TIC is that they comprise interactions with only the students and their interlocutors, making these materials authentic in a way that many corpora of internet language are not (but see Tagliamonte & Denis Reference Tagliamonte and Denis2008). Table 3 shows the constitution of the TIC in terms of the number of words in each register for both years.
Sample design of the TIC.
TIC in comparison with CMC corpora from the same time period, is shown in Table 4 (Ferrara et al. Reference Ferrara, Brunner and Whittemore1991; Yates Reference Yates and Herring1996; Herring Reference Herring, Holmes and Meyerhoff2003; Thurlow Reference Thurlow2003; Baron Reference Baron2004; Ling Reference Ling, Ling and Pedersen2005; Segerstad Reference Segerstad, Harper, Palen and Taylor2005; Tagliamonte & Denis Reference Tagliamonte and Denis2008; Jones & Schieffelin Reference Jones and Schieffelin2009; Hinrichs Reference Hinrichs, Jaffe and Sebba2010). With a word count total of close to 200,000 words, the highly vernacular, interactive, unmonitored interaction in TIC is unique and substantial.
Comparison of TIC with other CMC corpora.
A critical caveat is that the TIC is dated. It comes from a particular time (2009–2010), when the three CMC registers represented had distinct characteristics. Importantly, participants were not using their phones for email or web browsing. CMC on a phone in the TIC is only one type of CMC—SMS. This means that the study is circumscribed to a particular phase in the evolution of the internet and cannot be replicated. It is no longer possible to tap the distinct registers documented in the TIC. Another unique characteristic of the TIC is that it contains a sample of formal writing from each individual who contributed EM, IM, and SMS. Each sample had been earlier submitted for educational assessment and stands as a representation of the students’ most formal written language. This component of the TIC serves as a baseline and a control for the CMC components. In sum, the TIC comprises the same set of writers in different registers (written language, EM, IM, and SMS), making it possible to compare how individuals behave from one register to the next. The CMC registers in the TIC can be described as follows: IM is simultaneous and quick; messages are thought to be quite short and sentences can carry across several transmissions (Baron Reference Baron and Farghali2003:13). A typical example is shown in (7) where a participant is discussing the Disney movie, Up.
(7) Instant messaging
a.f:sorry I was watching the movie up! …
b.f:everyone says it's so good
c.friend: its really
d.friend: good
e.friend:but its still sad!
f.f:this movie is so weird!!
g.f:as if the house floats away
h.friend::((f, IM, 2010)
(8) Instant messaging
a.s: Heyyy, still in bed? Or did u come for tut?
b.friend: I came haha! Where r u?
c.friend: My class dismissed
d.s: Ohh.. My class is almost finish too.. Do u mind meeting on the
e. second floor just beside the stairs?
f.friend: Sure (s, SMS, 2010)
The brief interactions in (7) and (8) illustrate several well-documented conventions of IM, most especially the nature of the turns, which are represented here by line breaks as they were in the original discourse. According to Baron (Reference Baron2004), turns are a single transmission, that is, when a person hits the ‘send’ key. This is distinct from an utterance, which can extend over several turns. IM turns tend to be short, approximately five words per transmission. Jones & Schieffelin (Reference Jones and Schieffelin2009:84) report an average of 5.7–5.8 words and Baron (Reference Baron2004:409) reports 5.4 words per transmission. A single clause can be spread across transmissions, as in (7c–d). This is called utterance chunking (Baron Reference Baron2004:408), as dramatically represented in (9).
(9) Utterance chunking in IM
a. friend: they went out partying?
b. l: and drinking
c. f: lmao
d. l:hahah
e. l:LOL
f. l:i know
g. l:i was like
h. l:damn
i. l:alchaholic
j. l:S
k. friend:lol(l, IM, 2010)
The participant, ‘l’, uses a total of six turns, (9e–j), to express a single conversational turn. Notice too that the segmentation of chunks can be as small as a morpheme. This is visible in (9j) where the plural suffix, S, appears on a separate line. Similarly, in (9g) participant ‘1’ inserts a paragraph return after the quotative I was like, effectively segmenting the structure of the sentence into matrix clause and direct quote. In addition, there are several features that are commonly thought of as CMC markers more generally such as the lack of apostrophe in its (Squires Reference Squires2007), the use of the emoticon :(in the last turn of (7) (Baron Reference Baron and Farghali2003:20), and the lack of capitalization in the first turn of (7a) and (9a) (Ferrara et al. Reference Ferrara, Brunner and Whittemore1991:26–29).
EM is said to be one of the most common forms of communicating across the internet (Baron Reference Baron1998:141). It is both asynchronous and computer-to-computer (Baron Reference Baron and Farghali2003:12). In this study, both the EM and IM registers were exclusively computer-based. However, EM was rapidly becoming a circumscribed register for the young people. They mostly used it for communicating with professors, parents, and other established members of society. For this reason a criterion was imposed so that only EM communication that was (i) one-to-one and (ii) with a friend their own age were viable for the course project, as in (10a–b).
(10) a. How were exams? Can't wait to hear about evertything else!! oh yeah–
please sign my yearbook! hahha….and pass it on (F, EM, 2009)
b. Can I call you one night this week on your cell? Is your number [xxx]?
Exams were soooo hard! Oyyyyy! Where's your yearbook? I would looooove to sign it! (e, EM, 2009)
There are a number of striking differences between the EM interaction in (10) and the IM interactions in (7)–(9). First of all, in EM each turn has several sentences that contrast markedly with the extensive utterance chunking found in IM. More conventional use of capital letters at the beginnings of sentences is evident. At the same time, the EM interaction is similar to IM in terms of the presence of stereotypical CMC features, including the use of two exclamation marks in (7f) and segment duplication as in (8a). Both features are argued to convey emotion or emphasis that may not otherwise be attainable from the text-based nature of CMC (Baron Reference Baron and Farghali2003:20).
Even by the early 2000s SMS was already being cited as the most commonly used form of CMC, especially by young people. Ling (Reference Ling, Ling and Pedersen2005:335) reports an estimated average of 280,000 text messages sent every hour in Norway. Thurlow (Reference Thurlow2003:2) cites the Mobile Data Association statistic, which says that 1.7 billion text messages were sent in Britain in May 2003. An early defining characteristic of SMS was the 160-character limit assigned per transmission due to the restricted bandwidth required for sending an SMS message. Popular news sources at this time often cite this character limitation as a reason for the reported overabundance of acronyms and short forms. In fact, research on SMS length discovered that overall, messages are often much shorter than the 160-character limit. A study of Norwegian youth reported an average of thirty-two characters and between 5.5–7.0 words per transmission (Ling Reference Ling, Ling and Pedersen2005:342). Thurlow (Reference Thurlow2003) reports slightly longer messages for his study of British university students. Both studies show that text length is well below the 160-character limit. Another critical dimension to these CMC data is that mobile phones in the 2000s typically had only had a twelve-digit number pad (numbers 0–9, #, and *). By the end of the first decade of the twenty-first century, smartphone technology with full keyboards and automated spellchecking had developed. At the time of the present study, some of the students had phones with full keyboards but none had smart phones. This changed almost immediately afterwards.
Demographic data on individuals using the different registers of CMC described above during the same time span as this study can be found from market research statistics such as the IWS and CIA. Internet World Statistics (IWS, 2010Footnote 7) reported approximately 1.8 billion internet users worldwide, with most of these subscriptions coming from Asia (764.4 million), Europe (425.7 million), and North America (259.6 million). Relative to the populations of these areas, North America shows the highest penetration of the internet at 76.2 percent of the population.
A marketing study conducted by the Pew Internet and American Life Project (Pew, 2010) canvassed 800 youth between the ages of twelve to eighteen in four US cities. Researchers asked: “What methods of communication do you use to contact your friends daily?”. They found that overwhelmingly, 72% preferred using SMS to talking on the phone, sending EM, or using IM. This is a sharp increase from the 51% of texters in 2006. Instant messaging and social networking sites (such as Facebook) had reported daily usages of 25% and 24% respectively, followed by email at only 11%. The Pew researchers reported that ‘email is the least used of the communication forms examined’.Footnote 8
While the population in this study is slightly older than the teens in the Pew (2010) research, they shared the same sentiments. In 2010, a survey of the student participants in this study showed they preferred Facebook chat over conventional EM. Moreover, the 2010 class explained that they generally relegate conventional EM to ‘older people’. These narrowing contexts of use for EM indicate a level of formality and (social) conventionalization (Ferguson Reference Ferguson1994).
In sum, one of the most important contributions of this research is the data itself. The composition of the TIC in terms of vernacularity, speaker sample and size make it unique (Tables 2 and 3). Further, and perhaps most critically, it comprises representation from the same speakers across distinct registers. To our knowledge no other corpus permits such a comparison. This makes the TIC a singular documentation of the day-to-day interactions of North American teenagers using CMC at the turn of the twenty-first century.
CMC FORMS
CMC forms, including abbreviations, initialisms, and short forms are the most often cited characteristics of CMC, undoubtedly because they are the most striking (e.g. Thurlow Reference Thurlow2006, appendix), as in (11)–(13).
(11) a: OMGGGGGGGGGGG! that's the kind we
have!!!!!!!!!!!!!!!!!!!!!!!!!!!!!!!!!!!!!!!!!!!!!!!!!!!!!
it's sooooo good!!!!! i had the hazelnut a few days ago, it was
delicious!!!!!!!!!
friend: OMG! are you serious!(a, IM, 2010)
(12) d: … no no no I don't do anything like that
friend: ROFLCOPTER
d: but anyway
friend: h/o brb
d: kk
friend: k back
d: word so what's your g saying btw? (d, IM, 2010)
(13) friend: they went out partying?
l: and drinking
friend: lmao
l: hahah
l: LOL
l: I know
l: i was like
l: damn
l: alchaholic
l: S
friend: lol
friend: hahaha (l, IM, 2010)
The reported frequency of these CMC forms varies dramatically from study to study. This is due to divergent methods of analysis and widely varying interpretations of what to include in the assemblage. British teenagers are reported to use 18.75% abbreviations in SMS and approximately three per message (Thurlow Reference Thurlow2003:7). This count includes all nonstandard orthographic forms, for example, uni for ‘university’, misspellings such as excelent for ‘excellent’, common acronyms (DI for ‘Detective inspector’), abbreviations (bud ‘buddy’), g-dropping as in huntin ‘hunting’, nonconventional spellings like rite ‘right’, and accent stylization such as wivout ‘without’. Other studies have taken a more circumscribed approach to what is considered a CMC variant, including only acronyms, short forms, and abbreviations. These studies report far lower frequencies. Baron (Reference Baron2004:412) reported 1.03% CMC-specific forms. Tagliamonte & Denis (Reference Tagliamonte and Denis2008:12) reported 2.44%. Taking this approach in our own study, Table 5 shows the frequency of the twenty most common acronyms, short forms, and abbreviations found in the TIC.
Frequency of the top CMC forms in the TIC.
*These categories are an amalgam of a variety of different combinations of the same characters.
These CMC forms total over 2,000 items, but as a proportion of the total number of words in the TIC, they represent a mere 1.7%. This proportion is remarkably parallel to earlier reports (Baron Reference Baron2004; Tagliamonte & Denis Reference Tagliamonte and Denis2008), offering a certain degree of confidence in the findings. There was not a single instance of any of these CMC forms in the 58,222 words of formal written language from the same individuals that contributed the CMC data.
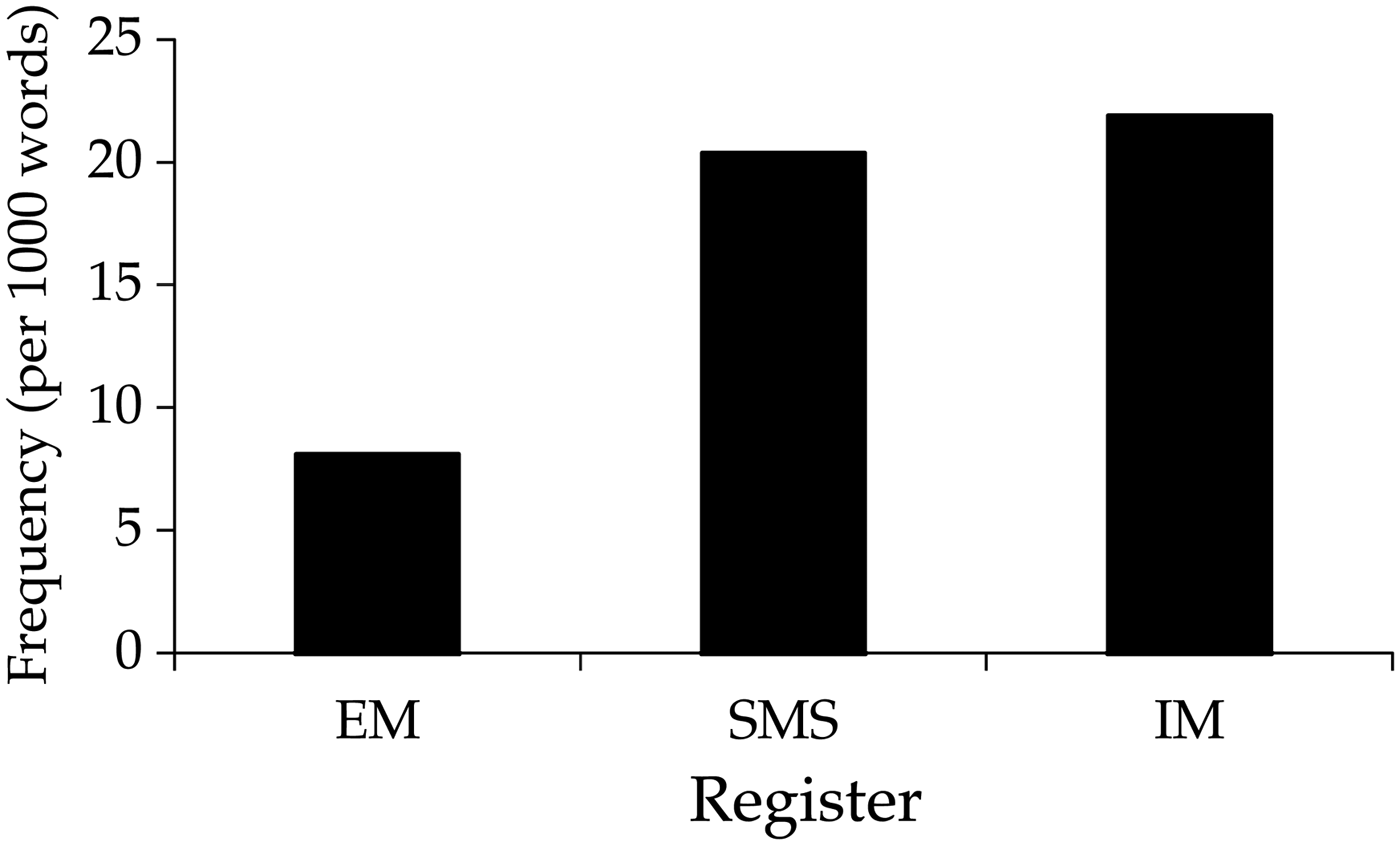
This provides a first indication that young people are sensitive to register. Let us now determine whether there is any difference in their usage of the same CMC forms across EM, IM, and SMS. Figure 1 shows the frequency per 1,000 words of the CMC forms as a group across the three registers.
Frequency of CMC forms by register.
EM has the lowest frequency of CMC forms at 8.1 tokens per thousand words. IM and SMS have much high rates of CMC forms at 21.99 and 20.38 per thousand words, respectively. The difference between SMS and IM is not statistically significant. The fact that EM has a significantly lower frequency of CMC forms supports the hypothesis that it is the most formal register among them, while the comparable frequencies in SMS and IM point to similarities between them. This is an interesting result because researchers have argued that in SMS, texters are inclined to use short forms by ‘reducing every word to its minimum comprehensible length’ (Davies Reference Davies2005:103–4). These results suggest that despite space limitations, IM (on computers) and SMS (on phones) are not distinguished, at least not with regard to the frequency of these CMC forms. In IM and SMS the students use these CMC forms at the same frequency.
The next analysis focuses on linguistic systems in order to further probe the nature of CMC language in the TIC.
VARIANTS OF LAUGHTER
One of the notable results in Table 5 is the sheer number of forms comprising variants of laughter, including haha, hehe, lol (given in boldface). These variants can often be found sprinkled throughout a CMC conversation, as in (14).
(14) friend: watd u do last night?
t:oh i had to work, it was so boring but not terrible lol. then i went
out with friends… u?
friend:oh sweet, i went out, very interesting things happened lol
t:no wayyyy!!! like what???
friend:umm we never actually made it newhere til we ditched and went to a bar
friend:this girl jst passed out like 7 timed
t:lmao.
friend: fell out of elevators, cars, so on
t: omg! no way! ahahaha
t: was he ok?
t: *she
friend:nope.took him home with a puke bag
t: lol.. her
friend:ya…her…
t: wow thats intense tho. hhaha aw poor grl
friend: it was her bday too! shes not gonna member a thing
t: hahah your not suppose to! lol
friend: you wanna member ur bday! its the day after to forget(t, IM, 2010)
As a reasonably coherent set, the variants of laughter can be systematically studied using the notion of the linguistic variable (Labov Reference Labov1972:127). Indeed, a previous quantitative study of laughter variants (Tagliamonte & Denis Reference Tagliamonte and Denis2008:13) offers the possibility for consistent comparison. At the time of this earlier study (data collection in the early 2000s), the variant haha was the most prevalent of the short forms, comprising 1.47% of the entire data set and it was also the most frequent laughter variant. While lol was also frequent, the study documented a systematic decline of lol in apparent time such that fifteen to sixteen year olds had the highest rates of lol and nineteen to twenty year olds the lowest rate, with a corresponding increase in use of the variant haha. The results for the TIC in Table 5 show that by 2009–2010 the most frequent of the CMC forms is lol at 0.69%, much higher than haha, at 0.40%. This suggests an increasing use of lol from 2008 to 2009–2010. Indeed, examination of the two time points, 2009 and 2010, separately reveals that lol represents a larger proportion of all laughter variants in 2010 than in 2009 (55.4% > 47.8%). The question is: Are the differences significant and do they indicate a change in progress?
By the early 2000s researchers had noticed that lol did not always mean ‘laugh out loud’ or actual laughter. For example, Baron (Reference Baron2004:416) described lol as ‘a phatic filler, roughly comparable to OK, really, or yeah in spoken discourse’, and Tagliamonte & Denis (Reference Tagliamonte and Denis2008:11) suggested that lol was used ‘in the flow of conversation as a signal of interlocutor involvement. This function of lol is corroborated by online commentary, for example comedian Billy Reid says: “I'm typing LOL! I'm typing, but I'm not laughing”.Footnote 9
How are the major laughter variants used across the TIC registers? The answer to this question not only sheds light on variation among the laughter variants, but also helps to place the three registers on the written-to-spoken spectrum. Figure 2 shows the distribution of major laughter variants, which comes from an exhaustive count of all the forms used by each of the students for a total of 766 tokens.
Distribution of major laughter variants across registers.
Distributional differences across the three registers are apparent. As expected from the overall distribution in Table 5 above, lol and haha are the most common laughter variants across the board. While lol vies with haha in EM, however, it is the dominating form in IM and SMS. The variant lmao is infrequent generally, but is most used in SMS. These distributions support the hypothesis that EM is more conservative than either SMS or IM and that IM is the locus of iconic CMC forms, for example, lmao. If lol indicates interlocutor involvement (Tagliamonte & Denis Reference Tagliamonte and Denis2008:11), it is not surprising that EM, which generally has longer turns and fewer turns per conversation than IM and SMS would have fewer instances of either haha or lol. In IM and SMS where turns are shorter and more rapid, individuals need to show engagement and more lol. We can probe the patterning of laughter variants further by testing for where variants occur at different points in the discourse: at the beginning of a turn as in (15b), (15g), and (15i), the end of a turn as in (17a–b) and in some cases all by itself in a turn, as in (16b). Although we also originally tabulated middle positions as well, as in (18), these were rare in every register (5.8% overall) and so were excluded from the statistical model. While true laughter might be expected to occur virtually anywhere, a phatic filler can be expected at juncture points in the conversation where one turn transitions into another.
(15) a. d: a cinema course
b. friend: lol seriously?
c. friend: wat do u in dat course?
d. d: 1 lecture 1 movie screening and 1 tutorial a week
e. friend: wat do u do in lecture and tutorial
f. d: assess and learn the history and changes of horror movies
g. d: hahaha
h. d: watch movies
i. friend: lol d u need to take dat course?
j. d: nah electives (d, IM, 2009)
(16) a.w: coz i came down to libarary.
b.w: lol.
c.friend: Studying for finals already?(w, IM, 2009)
(17) a. friend: It's basically an excuse to drink beer haha (f, SMS, 2010)
b. fj2:okay im gonna be gone for now haha
c. fj2:ttyl!
d. j:k bb(M, IM, 2009)
(18) N hope to c u tmr haha if u make it.. Class is so boring(s, SMS, 2010)
Logistic regression enables us to test competing hypotheses regarding the occurrence of one variant over the other and determine which ones are statistically significant (e.g. Tagliamonte Reference Tagliamonte2006). The effect of the sex of the writer, the date of data collection, and importantly the register can be modeled and assessed for significance, strength, and patterning. The analyses that follow are presented in tables that record the overall tendency of the form (input), the total number of data points in the model, the propensity of the form to occur in each context (the factor weights (FW)) and the proportion of each form by cell. Significance is measured at the .05 level and range values provide a measure of strength of the factor (Tagliamonte Reference Tagliamonte2006).
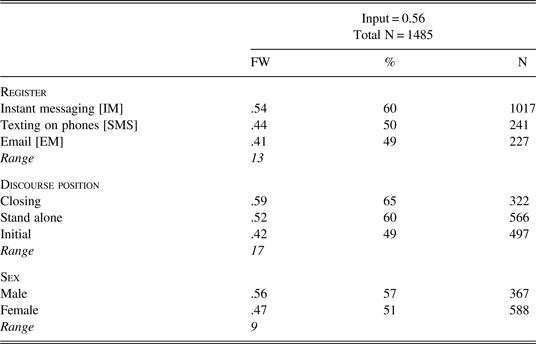
Table 6 shows the results of a fixed-effects logistic regression where lol is modeled as the dependent variable and the competing effects of social, register, and discourse factors are assessed simultaneously.
Fixed effects logistic regression of social and linguistic factors on the selection of lol.
Factors not selected: Year of data collection
Register, discourse position, and sex exert significant effects on the selection of lol. The significant effect of sex with males favoring lol adds the nuance that the variants of laughter have social meaning. The statistical effect of discourse position with closing and stand-alone contexts favoring lol suggests that it is not simply laughter, but may be developing another function. This becomes evident in Figure 3, which shows a cross-tabulation of discourse position and year of data collection.
Distribution of laughter variants by discourse position.
In 2009 lol was used equally across all positions, as would be expected for an random insertion of laughter. By 2010, however, lol has shifted to a higher level of frequency in closing position and when it represents the only item in a turn. This result offers evidence of the development of lol to phatic filler.
INTENSIFIERS
The English intensifier system has been subject to considerable scrutiny at the turn of the twenty-first century (Stenström Reference Stenström and Kirk2000; Tagliamonte & Roberts Reference Tagliamonte and Roberts2005; Tagliamonte Reference Tagliamonte2008; van Herk Reference van Herk2009). Intensifiers undergo rapid change and recycling and a number of forms are known to be jockeying for position in contemporary varieties of English. The form very, as in (19), competes with really as in (19b) and pretty also makes up a sizable proportion of forms use to boost the meaning of an adjective, as in (19c). At the time of this study, the variant so in (19d) was rising in frequency in Toronto particularly among teenagers and especially girls (e.g. Tagliamonte Reference Tagliamonte2008).
(19) a. yehh we do have quiz tmr…very easy one…dun worry(l, SMS, 2010)
b. That sucks im actually really bloated(M, IM, 2009)
c. like i think im pretty lucky to be going to bg for uni stjll(v, EM, 2010)
d. hazelnut is soo good! (q, IM, 2010)
Different intensifiers are variably associated with nonstandard and colloquial varieties of the language, which makes this an ideal linguistic site for the investigation of variation in CMC. Which intensifiers are used in each CMC register?
Following the protocols in earlier research (Ito & Tagliamonte Reference Ito and Tagliamonte2003; Tagliamonte & Roberts Reference Tagliamonte and Roberts2005; Tagliamonte Reference Tagliamonte2008), all adjectives in the TIC capable of being intensified were extracted for analysis, whether they were modified by an intensifier or not. As previously, contexts that did not permit intensification, such as comparatives and superlatives, were excluded, as were negatives. Adjectives modified by downtoners (e.g. kind of, sort of) were grouped with nonintensified contexts. Each context was coded for year of data collection, individual, register, adjective type, and semantic classification.
It was immediately apparent that the written data stood apart from all of the CMC registers with respect to the type of adjectives in the data. While the written data had over 60% attributive adjectives, these represented less than 25% in the CMC registers. Figure 4 shows the distribution of adjective types by register.
Distribution of adjective types by register.
Predicative adjectives, as in (20) represent the vast majority of intensifiable adjectives in the data. In addition, they can also stand alone, as in (21).
(20) a. But yea i sent u that txt cuz i was sooo bored.. i took a nice nap that day
(j, EM, 2010)
b. hey im so cheesed i did bad on my article summary for astro!:(
(M, SMS, 2010)
(21) a. Visited one of the first catholic churches ever… very cool. (o, EM, 2010)
b. and i thought.. ooo o soo sweet (m, IM, 2009)
Table 7 shows the overall rate of intensification in the TIC overall and within all four registers.
Overall rate of intensification by register.
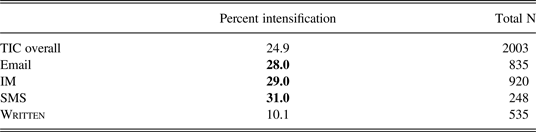
The TIC corpus shows a rate of intensification of 24.9% when the written data are included. Notice, however, that this masks the extreme difference between the written data and the CMC registers, all of which hover around 30% intensification. Here again is strong evidence for the divide between standard written language and CMC. How does the frequency of rates compare to other studies of intensifiers across speech and CMC?
Figure 5 compares the overall rate of intensification in the TIC with five other studies: American English in the television series Friends (Tagliamonte & Roberts Reference Tagliamonte and Roberts2005), spoken British English (Ito & Tagliamonte Reference Ito and Tagliamonte2003), a study of intensifiers in teenage blogs (Uscher Reference Uscher2010), the ambient community, Toronto (Tagliamonte Reference Tagliamonte2008), and a study of gay, lesbian, bisexual, and queer (GLBQ) individuals from Toronto (Tagliamonte & Uscher Reference Tagliamonte and Uscher2009). These corpora are shown along the x-axis.
Comparison of overall rate of intensification across studies.
The TIC has the third highest rate of intensification across studies. Note that CMC data has comparable rates to the studies conducted on face-to-face speech. This supports the idea that CMC patterns with spoken language.
The four most common intensifiers in contemporary English in North America are really, very, pretty, and so. Table 8 shows the distributions of these forms along with all other intensifiers occurring five or more times in the TIC.
Overall distribution of intensifiers.
By far the most common intensifier is so (13.7%). The more standard variants, really, pretty, and especially very occur at much lower frequencies.
The key question, however, is how these intensifiers are distributed in the different registers. Figure 6 displays the distribution of so, really, and very by register in the TIC, based on 1,569 tokens of intensifiable adjectives.
Distribution of major intensifiers by register.
The contrast between the written data and the CMC registers is dramatic. The intensifier very is the only intensifier used in the written documents. In contrast, all the intensifiers are used in the CMC registers. Comparing their patterns across registers reveals a building trend. EM is the most conservative, following by IM and SMS. The use of the incoming intensifier so varies incrementally by register. EM has the least so, IM has more, and SMS the most. Two interpretations may be put forward. First, the shortness of so may favor its use in SMS where there is pressure on the writer for brevity. Second, it may be the case that SMS is the leading register for deploying new forms. These forces may be acting in tandem to produce the heightened rate of so in SMS.
The analyses that follow probe the variable grammar underlying intensifier choice by testing the effects of two well-attested internal factors, semantic classification, and adjective type. Different types of adjectives may be more or less propitious to innovating forms (Partington Reference Partington, Baker, Francis and Tognini-Bonelli1993:183), which can be discovered by systematically classifying the different adjectival heads by their semantic class (Dixon Reference Dixon1977). The data offered sufficient numbers for two main types of predicative adjectives, those describing human propensities (e.g. glad, sorry, crazy) and those that express a value (e.g. good, bad, cheap). Figure 7 shows the distribution of so by register according to this semantic classification of the adjective.
Distribution of so by semantic classification by register.
While so occurs with both types of adjectives, there is a variable pattern such that so tends to occur more often with adjectives of human propensity, as in (22), rather than adjectives of value, as in (23).
(22) a. I'm so sorry(f, IM, 2010)
b.all the really hot people were left out(m, EM, 2010)
(23) a. its reallllyyy hard for me :((m, IM, 2010)
b. loool but ya, pretty pointless(j, EM, 2010)
The critical evidence is that this pattern is parallel across registers. A grammatical constraint governs the use of so and this is stable regardless of shifting frequencies of the intensifiers or their forms.
The next step is to determine if these patterns are statistically significant when all of them are considered simultaneously. Table 9 displays the results from a fixed effects logistic regression.
Fixed effects logistic regression of social and linguistic factors on the selection of so.
Factors not selected: Year of data collection, sex
Register and semantic class exert statistically significant effects on the choice of so. Type of CMC register is the strongest predictor with the continuum EM > IM > SMS and semantic class significantly constrains the patterning of intensifiers, with so favored for human propensity adjectives. These effects are regular, systematic, and significant.
FUTURE TEMPORAL REFERENCE
The English future temporal reference system is a variable system that has been subject to considerable recent scrutiny (e.g. Poplack & Tagliamonte Reference Poplack and Tagliamonte1999; Nesselhauf Reference Nesselhauf2007b; Torres-Cacoullos & Walker Reference Torres-Cacoullos and Walker2009b; Tagliamonte et al. Reference Tagliamonte, Durham; and Smith2014). Unlike the intensifier system, this system has been involved in a long and gradual change. The use of going to arose in the late 1400s and is reported to be gradually encroaching on shall and will. At the time of this study, going to represented 53% of the spoken vernacular in Toronto English (Tagliamonte & D'Arcy Reference Tagliamonte and D'Arcy2009). The TIC has all the variants reported in contemporary studies, including shall, will, ‘ll, going to, and many orthographic variants of these, as in (24).
(24) mb1: yo shall we go to see that on friday?(friend)
ma1: wat will u be doing in the summer?(friend)
y: okay ill get you a dog(y, IM, 2009)
h: im gona go brush my teeth(h, IM, 2009)
w: so is she gonna go bac tmr ?(w, IM, 2009)
d: i swear man ima go off(d, IM, 2010)
The form going to does not carry overt stigma in the spoken language; however, orthographic forms such as gonna, gon are considered colloquial and the form ima is decidedly vernacular. The form will is considered standard while shall, other than in questions with first plural subjects, as in (24a), is reported to be formal and in decline across major varieties of English (e.g. Williams Reference Williams, Aarts, Close, Leech and Wallis2013). Linguistic research documents that will and its variants are preferred in ‘speech-based’ registers (Nesselhauf Reference Nesselhauf, Hundt, Nesselhauf and Biewer2007a:291). The association of different forms with varying degrees of formality and states of change is useful for discerning the nature of the CMC registers in the TIC.
Following the protocols in earlier research (Poplack & Tagliamonte Reference Poplack and Tagliamonte1999; Tagliamonte Reference Tagliamonte, Chambers, Trudgill and Schilling-Estes2002; Torres-Cacoullos & Walker Reference Torres-Cacoullos and Walker2009a), all tokens of future temporal reference were extracted, excluding formulae, future present, and progressive and future in the past, in order to focus in on the robust variability between variants of shall, will, and especially the many orthographic variants of going to. Each context was coded for year of data collection, individual, register, grammatical person, animacy, type of clause, and type of sentence.
Figure 8 shows the distribution of future temporal reference variants by register in the TIC.
Distribution of future temporal reference variants by register.
The full form will dominates in each register. There is also additional evidence for a linguistic divide between written data and CMC. Notably, writers employ will to the virtual exclusion of all other variants in the written essays. In addition, there is a split among the CMC registers. SMS stands apart due to the high rate of ‘ll whereas in EM and IM this form is a minor variant in the system. Why would this be the case? Nesselhauf (Reference Nesselhauf, Hundt, Nesselhauf and Biewer2007a) suggests that the use of ‘ll is emblematic of speech-based registers. These results show, however, that it cannot simply be the speech-like nature of the register because SMS and IM are both speech-like. As with the heightened use of so in SMS, the use of ‘ll is likely due to the fact that it is short. In SMS writers are under pressure to be brief and perhaps also quick. It is notable that the overall frequency of ‘going to’ variants in all the CMC registers is low and no register has more than a smattering of forms such as gonna and ima. In sum, although ‘going to’ represents 53% of the future temporal reference system in the spoken vernacular in Toronto, these registers evidence striking conservatism. Variants of the ‘go’ future are never more than 30%. This finding suggests that the CMC registers may actually be lagging behind in the ongoing grammatical change towards the ‘go’ future in English.
In order to assess the state of the future temporal reference system in these CMC registers further, we now model the variable grammar that underlies the choice of going to over will. A composite of factors are known to constrain the use of going to including the nature of the subject, the type of clause, and type of sentence (e.g. Poplack & Tagliamonte Reference Poplack and Tagliamonte1999; Szmrecsanyi Reference Szmrecsanyi2003; Nesselhauf Reference Nesselhauf, Houswitschka, Knappe and Müller2006; Torres-Cacoullos & Walker Reference Torres-Cacoullos and Walker2009b; Tagliamonte et al. Reference Tagliamonte, Durham; and Smith2014). The configuration of these constraints is thought to differ in weight and constraint ranking (order) depending on the stage of development of going to, as in Table 10.
Predictions for stages of grammaticalization of going to (adapted from Tagliamonte et al. Reference Tagliamonte, Durham; and Smith2014:Table 4).
Table 11 shows the results of a fixed effects logistic regression modeling each of these factors including the influence of register itself. The ‘going to’ variants are combined in opposition to variants of will and the rare tokens of shall.
Fixed effects logistic regression of social and linguistic factors on the selection of going to.
Factors not selected: Year of data collection, sex
The results confirm that the choice of going to is influenced by register with IM highly favoring its use. This result is by now familiar and affirms that IM is the most progressive of the CMC registers. When going to occurs it is most likely for second and third person human subjects, followed by first person subjects, but it appears only rarely with inanimates. The strong statistically significant effect of this pattern demonstrates that the use of future variants in these data is linguistically structured. The type of sentence effect is weak and shows that going to is barely used in negative contexts. Finally, clause type is not significant. Together with the comparatively low frequency of going to overall, these results corroborate the idea that CMC registers are well behind spoken English in the use of going to for future temporal reference. It is worth questioning whether the important grammatical person constraint operates across each of the CMC registers since it may be the case that going to has not diffused equally into each one. Figure 9 shows the distribution of going to variants by type of subject in order to assess whether the CMC registers operate with a consistent grammatical system.
Distribution of going to variants by type of subject.
Human non-first person subjects lead in the use of going to variants as in (25), while first person subjects (26) and inanimates, as in (27), lag behind. Crucially, this pattern is regular across all the CMC registers.
(25) a. well if ur gonna walk lemme no(M, IM, 2010)
b. Mom's gonna flip~ lol(M, EM, 2009)
(26) a. They better be down or I am going to kick some ass(F, IM, 2009)
b. yah, ill go with you if you want ill talk to you tomorrow (F, IM, 2010)
(27) me too yo its gonna be so much fun(M, IM, 2009)
Taken together these results demonstrate that the forms used for future temporal reference in the TIC mirror the patterns found in contemporary studies of the future temporal reference system—will, ‘ll, and going. Despite the varying forms in CMC, especially for ‘going to’ (gunna, gonna, gunna, etc.), the alternation between the major instantiations of the future adheres to a systematic pattern throughout.
DISCUSSION
The linguistic nature of different CMC registers has been elucidated on three dimensions: acronyms, initialisms and short forms, and intensifiers and future temporal reference. The results from accountable quantitative analyses of each feature enable us to describe tangible contrasts across writing, EM, IM, and SMS. First, it must be said that the standard language is intact in the written essays used by all of these first year university students. There is no breakdown of grammar; there is little to no infiltration of CMC forms, and there are none of the highly vernacular features reported of CMC. This becomes highly relevant when compared to the language the same students use in EM, IM, and SMS. While many CMC forms occur in these registers, their frequency is modest at best. Moreover, the character of their use is systematically patterned according to register. EM is the most formal and the most like the written essays. It has the longest turns and the lowest frequency of CMC forms. EM also has the lowest frequency of intensifier so and future going to. These young people associate EM with parents, professors, and bosses, and so it appears that they simply eschew innovative and stigmatized language, even when communicating with a peer audience as in the TIC.
It is difficult to finely delineate linguistic differences between IM and SMS. The contrasts are a matter of degree. IM and SMS are both used with equal vigor by youth to communicate with each other. At the time of the study, the difference between IM and SMS was delimited by device—SMS/phone and restricted by character limits and type of keyboard, and EM/computer. The technological restrictions imposed on SMS are corroborated by heightened use of the shortest forms in each variable set, so and ‘ll in SMS in comparison to EM and IM. SMS also has more spelling variants and more innovative forms at the extreme vernacular end of the spectrum (e.g. ima).
Despite the sharply defined distinction between EM on the one hand and SMS and IM on the other, the most important discovery is that the constraints on two variable linguistic systems—intensifiers and future temporal reference—are parallel in each register. Thus, although forms and their frequency vary dramatically from one register to another (e.g. so, SO, SOOO or going to, gon, gunna), the grammar underlying the deployment of those forms remains stable. In other words, there is no breakdown of grammar from one register to the next.
Another discovery is that the nature of the linguistic feature under investigation, whether orthographic, lexical, or grammatical, is critical to delimitating register differences. While orthographic novelties, laughter, and incoming intensifiers appear to be responsive to register, grammatical features such as future temporal reference are apparently resistant. In fact, the results for future temporal reference suggest that in essence these CMC registers exhibit fundamental qualities of written language. Further research on this issue is needed to map the interaction between type of linguistic change and register. Indeed, this study highlights the marvelous new frontier that lies ahead for exploring linguistic variables in CMC. Finally, synthesizing across all of the analyses and their results, one thing is certain: these young people are fluidly navigating a complex range of new written registers and are using conventions that are particular to each one—from traditional written language to relatively formal EM to interactive, casual IM, to funky, flirty SMS.
SOCIOLINGUIST OVER THE SHOULDER
When this research began, the biggest hurdle was finding a way for a middle-aged academic (Tagliamonte) to step into the world of youth language on the internet. The hiddenness of this community was, at the time, enshrined in its own acronym, pos ‘parents over shoulder’ based on the image of parents attempting to look over their teenagers’ shoulders to see what they were typing on their computers or phones. With the collaboration of forty-five first year students at the University of Toronto, the research assistance of a post-graduate student (Uscher), and the administrative help of one of the participating students (Kwok), we have been able to successfully explore this alien terrain and uncover its authentic nature. In essence, we became ‘sociolinguists over the shoulder’. This unique perspective gives us the opportunity to share the following demonstration. Imagine a day in the CMC world of individual ‘r’ as he hands in an essay, emails one friend, chats with another in IM, and texts another on his phone. First, here is an excerpt from r's essay, in (28).
(28) Therefore, the idea, that youth who play video games are responsible for violent crimes does not hold, since most of the games played by youth are not violent. Other factors, however, have contributed to the false notion that violence stems from video games.
Notice that the syntax is complex and there are a number of formal features, including the connectors ‘therefore’ and ‘since’ and the relative pronoun ‘who’. In (29), observe ‘r’ in EM in 2010.
(29) I hope all of your exams went well! We're FINALLY all done!! Since we're done our coaster, please bring 30$ on marks review day, as my mother is asking me for the money.
Notice the use of upper case and exclamation marks. At the same time, there are formal features, including ‘since’ and ‘as’. The characterization of CMC as a hybrid is due to this type of mixture. Next, here is ‘r’ in IM, in (30).
(30) aww muffin….ill keeps you companies till you sleep…and me im just beefing up my music library seeing my commute has gotten boring of late…if you want ill share some …
Notice the palpable psychological shift. The quality of the discourse is immediate, direct, interactional beginning with aww muffin. The linguistic footprint of this register is patent: no capital letters or apostrophes, lexical colloquialisms are apparent (beefing up), the use of the -s suffix in nonstandard environments (keeps, companies) and the use of ellipsis to separate ideas. Still, the syntax remains relatively complex with clause markers ‘till and if. Finally, here is ‘r’ using SMS, in (31).
(31) ahahah your crazy..real talk..and ill be on later and ill walk you through it…the lab shit aint hard but the questions I feel for you soda
Note the same quality to this discourse as with the IM—interactional and personal. Here too there are no apostrophes and the ellipsis is used to demarcate sections of the discourse. What stands out here is the use of the nonstandard negative form aint and a mild swear word shit. This heralds the quintessential nature of SMS—edgy.
In conclusion, interactive CMC by youth writing to each other on a daily basis is a flagrant mix of formal and fashionable features. The differences across registers reflect fluid command of a continuum of different styles and practices and the students command them all.