Nomenclature
- Yp
year for which the traffic is projected
- Dp
date for which the traffic is projected
- Hp
hour of day for which the traffic is projected
- Wp
week number of the year for which the traffic is projected
- Ds
day selected as the surrogate from the year previous to projected year (Yp) that is the same day of the week as Dp and in the week number Wp
1.0 INTRODUCTION
Demand for airspace access has been on the rise due to an increasing number of new entrants such as space operators, unmanned aircraft systems (UAS), and balloon operators. To manage operations that are potentially hazardous to aircraft, such as space launches in the National Airspace System (NAS), the Federal Aviation Administration (FAA) may route air traffic around strategically located blocked airspace to ensure operational safety. As the frequency of these activities increases, there is a growing need to increase collaboration and transparency among stakeholders regarding airspace usage. A primary need to support this collaboration is the ability of all stakeholders to quickly assess the impact of planned operations far in advance of the event, up to 12 months into the future. Different stakeholders will have different uses for such a capability. A space operator may be able to adjust the plan of launch and re-entry operations to have minimal impact to the NAS, and a FAA analyst may be able to quickly assess the impact of last-minute changes in the launch time. In fact, a prediction model coupled with a ‘what-if’ analysis capability, in which changes in blocked airspace dimensions, location, and activation time are reflected instantaneously as a measure of projected impact, could be a key enabler of collaborative and transparent airspace use among all stakeholders.
This work has three key components: developing a model to predict air traffic impacted by blocking airspace volumes, modelling air traffic impact on the affected traffic, and reducing this information to a data structure that can support on-demand analysis. The focus of this paper is on new techniques to predict demand from a large set of historical track data and further encode these projections into a data structure that can support the quick assessment using a ‘what-if’ analysis paradigm.
The organisation of this paper is as follows: Section 2 explores background on existing approaches to predicting the air traffic impact of blocked airspace, Section 3 provides an overview of the approach, and Section 4 discusses the data sources underpinning the implemented algorithms and the scope of the study. Section 5 discusses the data reduction and encoding scheme, Section 6 describes the traffic projection model, and Section 7 summarises notes on the implementation of the model as a prototype. In conclusion, Section 8 points out the strengths and weakness of this approach and future work.
In this paper, the terms aircraft hazard areas (AHAs) and Special Use Areas (SUAs) are collectively referred to as ‘blocked airspace’; additionally, use of the word ‘airspace’ implies airspace volumes having lateral as well as vertical dimensions.
2.0 BACKGROUND
The primary focus of the research presented in this paper is enabling a ‘what-if’ analysis capability that can provide immediate assessment of the impact of blocking airspace to a broad class of users with little expertise in the air traffic domain. To the best knowledge of the authors, no published research addresses this requirement. Tools such as Dynamic Airspace Routing Tool (DART)Footnote 1 can be used to assess the NAS impact of closing airspaces; however, to do that requires access to the tool, operator knowledge of the air traffic domain, availability of data (such as traffic and weather), and setup time.
The other component of the research is projecting the air traffic impact of blocking an arbitrary airspace, which is a complex task, as it varies significantly depending on factors such as location, season, the day of the week, time of day, and weather. In addition, the air traffic management strategies to avoid hazard areas vary depending on area control centres and are not known in advance of the operation that requires blocking airspace.
There are several publicly available demand forecasts. FAA publishes the Terminal Area Forecast (TAF) for active airports in the National Plan of Integrated Airport Systems (NPIAS), which is considered the de facto official aviation forecast. It is developed from a series of airport models that use trends in demographics to forecast changes in enplanement. Boeing publishes its latest assessment of the 20-year demand for world travel in its Current Market Outlook( 1 ), and Airbus provides its projection of 20-year demand in its Global Market Forecast( 2 ). Finally, the Transportation Systems Analysis Model (TSAM)( Reference Jeff Viken 3 ) developed by Virginia Tech’s Air Transportation Systems Lab and NASA Langley can be used to project the passenger demand for trips more than 100 miles selecting among three modes of transport: automobile, airline, and on-demand services using very light jet aircraft. All these forecasts focus on demand growth at the airports, not in the airspace in between; that is, they do not provide a prediction of trajectories of fights between the origin and destination airports. This makes them insufficient for modelling the impact of blocked airspace.
One approach to assessing the impact of a launch or re-entry operation is to model the traffic on the launch day based on available traffic and weather forecasts, and calculate the expected delay by simulating the rerouting of the affected flights around the AHAs using tools such as Future ATM Concepts Evaluation Tool (FACET)Footnote 2 and systemwideModelerFootnote 3 . This approach requires significant effort from a well-informed operator in setting up the simulation to realistically model the planned operation conditions, making it unsuitable for use in a ‘what-if’ analysis capability that can be used by a broad range of users with no knowledge of the air traffic domain.
Another approach used by Jessica Lee and Marie Kee( Reference Kee 4 ) involves statistical analysis on a specific SpaceX Falcon9 launch vehicle/Dragon capsule re-entry vehicle operation to determine if the operation caused flights to experience significantly longer flight distances, more fuel burned, and longer flight durations as compared to similar flights on other days. The paths of the flights on the launch day were compared to the similar flights on a set of five historical days to arrive at a range of distance and time impacts of the launch. This approach may be used to develop prediction models of the launches with similar characteristics, such as the location and geometry of the hazard areas, block time window, and the day of the week of the operation. However, its use as a general-purpose method to assess the impact of any blocked airspace is limited. Since this approach is derived from a comparison to actual impacts, a large number of historical impacted days would be required before such an approach can be used to estimate behaviour for future events. Also, the study required significant human effort and is not amenable to automation and producing results in a short time.
In related research, Srivastava( Reference Amal Srivastava 5 ) projected the NAS impact of blocking airspace by measuring the effect of delaying or routing flights around blocked airspace on a sample historical set of days similar to the proposed launch day traffic. This approach requires minimal air traffic domain knowledge’ however, analysis takes some time (on the order of 20min), making it unsuitable for use in a ‘what-if’ analysis. Moreover, the model relies on selecting historical days close to the launch day and is, therefore, useful only for assessing relatively near-term impacts.
The approach presented in this paper combines insights gained from the earlier work to develop a model that predicts the impact of blocking airspace on the NAS and encoding the results in a data structure that can support interactive queries on blocking arbitrary airspace.
3.0 OVERVIEW OF THE APPROACH
The research objective presented in this paper is to enable a user to ‘draw’ an airspace, anywhere on a map, indicate time window for which it is blocked, and instantaneously receive metrics indicating the effect on airlines of blocking it. A user may move, reshape, or change the closure times of the airspace, and the changes in impact are instantaneously reflected. In effect, it is envisioned that the geographical map is ‘geo-coded’ with NAS impact information, which is then used to provide a real-time assessment of the impact.
One of the key requirements for achieving this vision is to develop a geo-coded data structure to store aggregated projected or historical traffic data. The data structure referred to as ‘route segment’ is used for this purpose; a route segment is a line segment between two known fixes or waypoints. Since traffic within the NAS changes from moment to moment, it needs to be aggregated for a unit of time; for this model, the unit selected is 1h. The route segments carry bi-directional traffic density, aggregated hourly; thus, creating a ‘route segment density map’ over the geographical area of interest. The route segment density map enables a ‘what-if’ analysis paradigm since the traffic density information in the route segments intersecting any arbitrary airspace can be used to assess the impact instantaneously. To generate the route segments, the flown flight path is reverse-engineered into the known fixes and slotted to the hourly bins, depending on the time when the flight was in the route segment.
Once the data structure used to store projected (or historical) traffic density is designed, the next step is developing the model for traffic projections. If reliable traffic forecasts were available 12 months in advance, then they could have been the basis of projected NAS impact of blocked airspace. Unfortunately, that is not the case. Flight schedules databases, such as the one from InnovataFootnote 4 , exist, but they do not contain information on general aviation and many business jet flights, which together form a significant portion (approximately 20%) of U.S. traffic. Moreover, the database only provides flight schedules between city pairs, and not the expected path (trajectory) of the flights, which are required to model the effect of closed airspace on the NAS. Trajectories may be generated using flight schedules as an input to fast-time traffic simulation system such as DART; however, such an approach requires operator knowledge of the air traffic domain, availability of other data (such as weather), and setup time, which makes it unsuitable for our purpose.
In the absence of a traffic forecast, an approach that applies heuristic methods to project traffic is used. The forecasting model is based on the analysis of historical traffic trends combined with known flight schedule patterns. Traffic flows at different locations for multiple years are studied to uncover trends by aggregating the data at different levels (daily, weekly, and monthly).
An important part of this research is to develop a prototype implementing the model and testing the extent to which the goals of enabling a ‘what-if’ analysis have been accomplished. Notes on implementation and the user interface are also part of this paper.
To summarise, the key steps in the research to enable an on-demand assessment of air traffic impact of blocking airspace are:
• Devise a data reduction and encoding scheme to enable a geo-spatial ‘what-if’ analysis.
• Develop an air traffic projection model.
• Model the NAS impact of blocked airspace.
4.0 DATA SOURCES AND SCOPE
This research is relevant to locations worldwide; however, due to data and resource limitations, it has been confined to airspace in the continental U.S. airspace only, specifically to a region bounded by latitude 10N–50N and longitude 40W–160W. Note that since the key approach discussed in this paper relies on heuristic methods and historical traffic patterns, it would need to be adapted for use elsewhere, as these will vary from one region to another.
The data source used to generate historical track data is Aircraft Situation Display to Industry (ASDI) feed provided by the Traffic Flow Management System (TFMS) as a System Wide Information Management (SWIM) service. The feed allows real-time air traffic data to be disseminated to members of the aviation industry and includes aircraft scheduling, routing, and positional information covering flights traversing the scope of this study. It does not contain the flights using Visual Flight Rules or military flights.
The actual flown track data are generated using the track position report (TZ) messages and is augmented by the oceanic messages (TO) for portions of track that are over the ocean in the non-radar airspace. In the event a gap of more than 20 min is present between two nodes, an interpolated node is inserted, along with the great circle path, in the middle at the same altitude as the prior one to ensure continuity in the track.
The historical track data comprising all tracks from 2011 to 2016 is used in this study.
5.0 DATA REDUCTION AND ENCODING SCHEME
A key objective of this research is to achieve the ability to get instantaneous metrics on the NAS impact of blocking an arbitrary airspace, for any length of time. This requires that the historical and projected traffic information be stored in a geocode data structure, which when combined with blocked airspace co-ordinates and activation time is able to produce the NAS impact metrics.
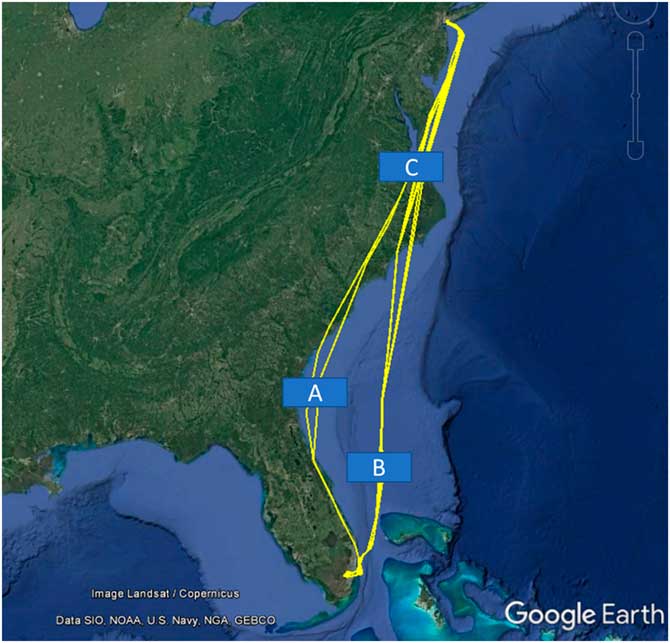
There are readily available aggregated historical track data sets including the number of daily flights between city pairs. This data set will not suffice as the flights between a city pair may follow different paths. For example, Fig. 1 shows flight paths from New York’s John F. Kennedy Airports to Miami International Airport on 3 March 2017. A blocked airspace located at positions A, B, or C will impact a different number of flights, as is evident from the figure. The variation in the number of impacted flights will rise for longer distance flights, as there may be more routes connecting the origin and destination and a larger range of flight durations.
(Colour online) Flight paths from JFK to MIA on 3 March 2017.

It is apparent that the track data needs to be collected between points that are nearer and do not have multiple paths between them. We use fixes and waypoints along tracks to aggregate tracks. These are more closely spaced, with well-known points common to many flight paths. A flight track is split into several ‘route segments’, each bounded by a pair of nodes that are typically fixes and/or waypoints.
An aircraft’s flight plan can be a starting point to splitting a track, as it has the intended route of a flight in terms of fixes and waypoints. In practice, however, the path deviates significantly from the flight plan. Analysis of track data from 1 August 2015, revealed that 33% of flights deviated from the last filed flight plan by 25 nautical miles (NM) or more. To address this, the actual flight track is snapped to the closest fixes and waypoints it passes over, in effect reverse engineering the flown flight plan. Since fixes and waypoints are generally not available over oceans, a grid of intersection points one degree apart (going north-south and east-west) is created to cover such locations. In addition, since the set of fixes and waypoints in use changes over a long period (6 years used in this study), only currently used fixes and waypoints are used to create route segments.
After the tracks are split into route segments, the number of times each route segment is traversed every hour is recorded as its ‘traffic density’; a collection of traffic density for all the route segments make up a route segment density map. Finally, an algorithm to assess traffic blocked by any arbitrary airspace projected over the route segment density map is developed and tested.
To summarise, the following are the steps to reduce and encode track data to support ‘what-if’ analysis capability:
▪ Create a database of nodes of frequently used fixes, waypoints, and one-degree latitude and longitude grid points.
▪ Align flight tracks to the nodes to infer the flown flight route and generate route segments.
▪ Aggregate traversal of route segments by all the flights on an hourly basis to generate route segment density map.
▪ Develop an algorithm to assess traffic blocked by any arbitrary airspace projected over the route segment density map.
These steps are described in detail in the subsequent sections.
5.1 Generate database of nodes
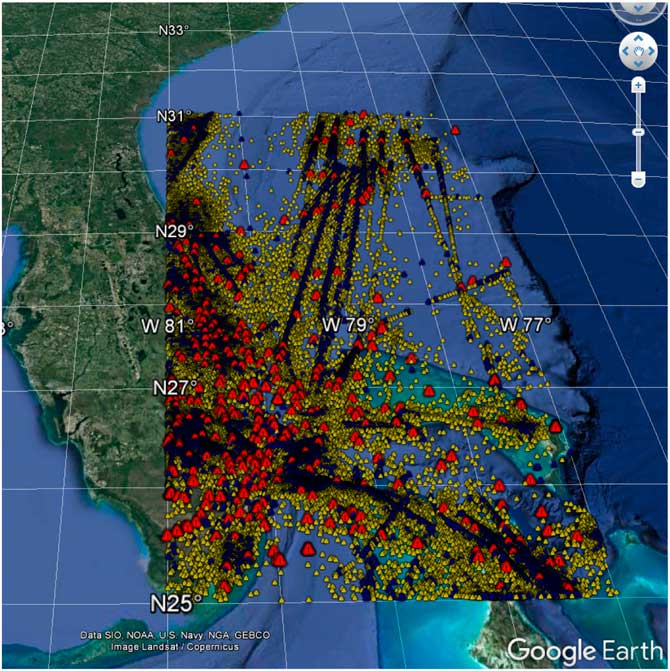
The objective of this process is to generate a database of nodes that is granular enough to capture prevailing air traffic patterns and contains usage frequency information. The aeronautical navigation database (from sources such as National Flight Data Center) does not contain usage frequency, which makes it inadequate for our purpose. To generate this database, flight plans of flights from 2011 to 2015 were parsed to get the nodes (mostly fixes and waypoints) specified in the plans and their usage frequency. Airways and jetways were expanded to the individual waypoints and fixes in the process. The nodes were further classified on the frequency of use as high usage (97.5 percentile or higher), medium usage (90.0–97.4 percentile), low usage (75.0–89.9 percentile), and rarely used (below 75.0 percentile). This resulted in a large node’s data set (see Fig. 2 for a sample, which shows high (red), medium (blue), and low (yellow) usage count nodes).
(Colour online) Nodes bound by 25N–31N and 77W–81W.

To account for low coverage in the oceanic areas due to the absence of fixes and waypoints, a 1×1 degree grid was generated, and each intersecting point was stored as a synthetic node. All the nodes, their locations, usage class, and type are stored in the database of nodes, which is later used to align flown tracks to the route segments.
5.2 Infer flown flight route
The goal of this step is to infer the route that a flight flew, within a specified tolerance limit on the allowed deviation from the actual path. To ensure that the inferred path is close to the actual, we limited the maximum deviation between them to be less than 10NM, and the distance between two nodes on the flown plan to less than 150NM.
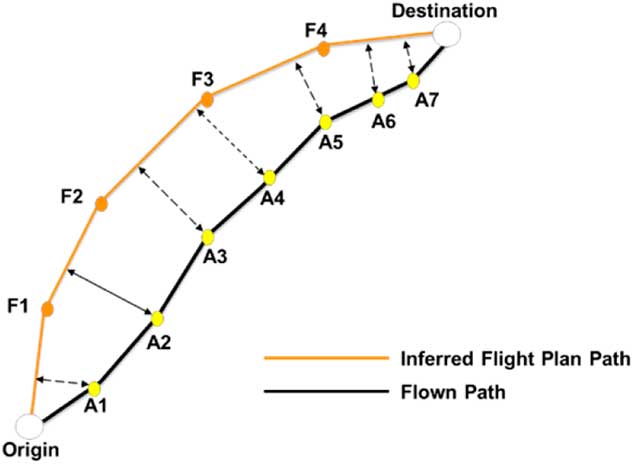
The first step of this process is to check if the flight path generated using the filed flight plan (or amendments) is within the tolerance limit of maximum deviation of 10NM from the actual path. The maximum deviation is computed as the maximum perpendicular distance from the nodes on the actual flown path to the closest point on the inferred flown flight plan path (see Fig. 3, in which the maximum deviation is the perpendicular distance of the inferred flight plan path from its flown path node A2). Results from this test indicated that the majority of flights deviated from the flight plan by more than 10 NM (for example, analysis of flights on 1 August 2015, showed 59% deviated more than 10 NM and 33% deviated more than 25 NM). To address this, an algorithm that aligns the deviated section of the flight plan-based path to the flown path is developed.
(Colour online) Deviations of flown path nodes from inferred flight plan path.

Steps in this algorithm are the following:
1. Start with the flight path generated using the filed flight plan.
2. Traverse nodes in the flight plan path to identify the starting and ending nodes that deviate more than 10 NM from the actual path.
3. Locate the points on the flown path that are closest to the identified deviated starting and ending node. Construct a corridor 10 NM across between starting and ending points.
4. Search for nodes from the generated database of nodes within this corridor, starting with high usage ones. Repeat the search for medium, low, and synthetic nodes in that order. Stop the search when connecting nodes less than 150 NM apart are located.
5. Replace the deviated nodes with the ones found in the corridor to get an aligned flight path.
6. Repeat steps 3–5 for other disconnected deviated sections.
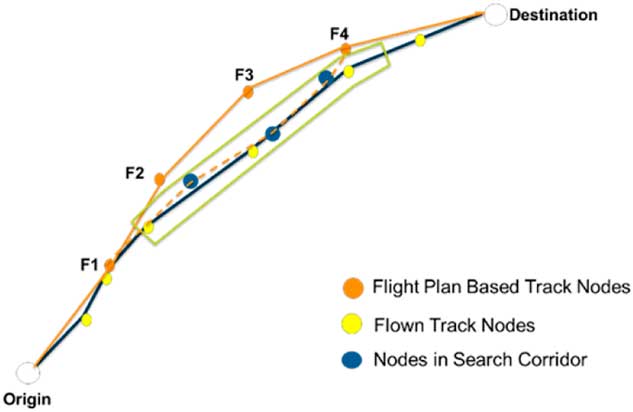
Figure 4 illustrates steps 3–5. Section F2–F4 of the flight plan path has deviated from the flown path. A corridor is created over the flown track between points corresponding to nodes F2–F5 (corridor is shown in green). The fixes and waypoints (nodes) within the corridor are used to construct a path that is closely aligned with the flow track (path shown in dash yellow lines).
(Colour online) Aligning flight plan based path to flown path.

5.3 Generate route segment density map
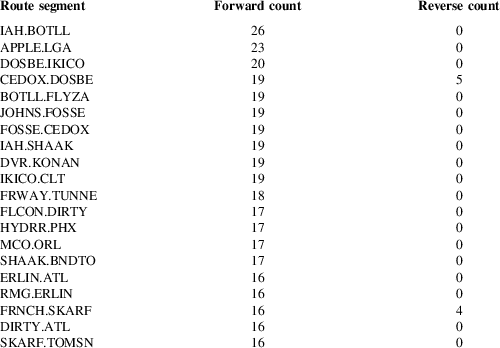
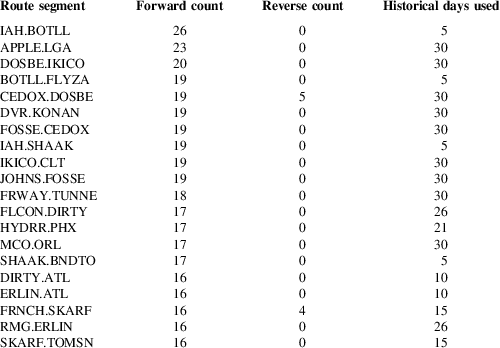
The flown flight plan track generated from the previous step connects origin to destination using segments (also referred to as ‘route segments’) defined by the nodes in the database. In this step, the number of traversals over every route segment is aggregated on an hourly basis. Note that since flights can traverse a segment in both directions, a bidirectional usage count is kept. If the hour of the day changes while a flight is moving across the segment, the hour span with most of the traversal time is chosen. Table 1 shows the top 20 busiest route segments in the continental United States on a sample day of 4 January 2015, between hours 15 and 16 UTC. Route segment ‘IAH.BOTLL’ had 26 aircraft traverse in the direction of node IAH to node BOTLL, reflecting high usage of this segment connecting the Houston International Airport (IAH) to the departure fix (BOTLL). Similarly, there was a high number of arrivals using the fix APPLE into the LaGuardia Airport (LGA) in New York (route segment ‘APPLE.LGA’).
Sample route segments with bidirectional usage count

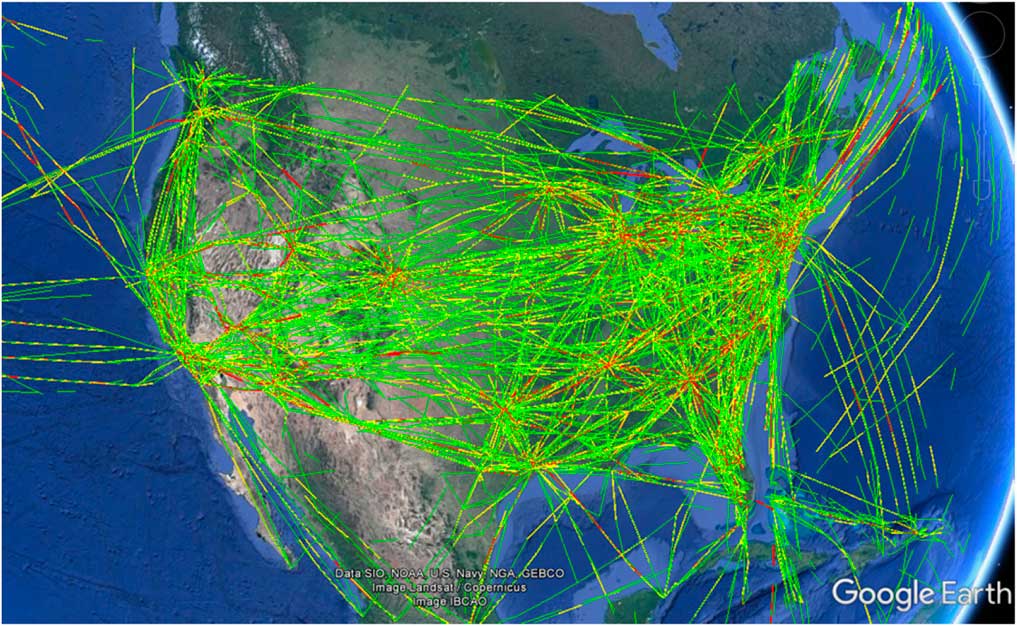
Additional metadata including a mix of different airlines, the proportion of international flights, and general aviation flights may also be stored along with the route segment traffic density to provide supplementary information. Figure 5 visualises the route segment density map for route segments with hourly usage of five or higher across the continental United States.
(Colour online) U.S.-wide route segments with hourly usage count of five or higher.

5.4 Assess NAS impact of blocking arbitrary airspace
The route segment density map enables instantaneous assessment of the impact of blocking an arbitrary airspace. This is accomplished by considering the bidirectional traffic density of the route segments impacted by the blocked airspace. For cases where the airspace is not blocked for the entire hour, the impact is assumed to be distributed linearly across the hour and is apportioned accordingly.
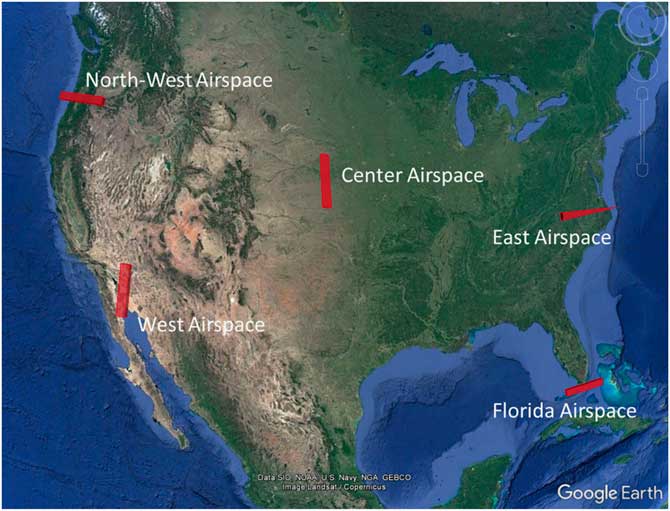
To test the efficacy of the Route Segment Density map in assessing the impact of blocked airspace, five areas of airspace, distributed throughout the continental United States as shown in Fig. 6, were used. The areas of airspace were placed in areas of relatively high traffic and oriented across the direction of flow.
(Colour online) Test areas of airspace placed across the continental United States.

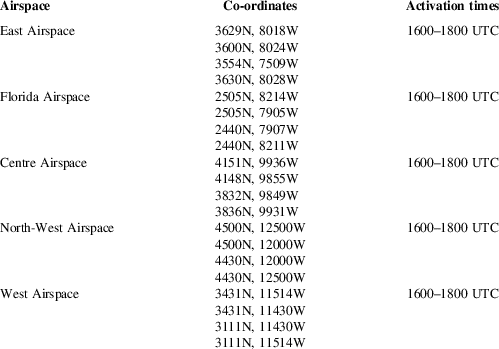
Table 2 provides the co-ordinates and activation time (time during which the airspaces were blocked).
Test airspaces co-ordinates and activation times

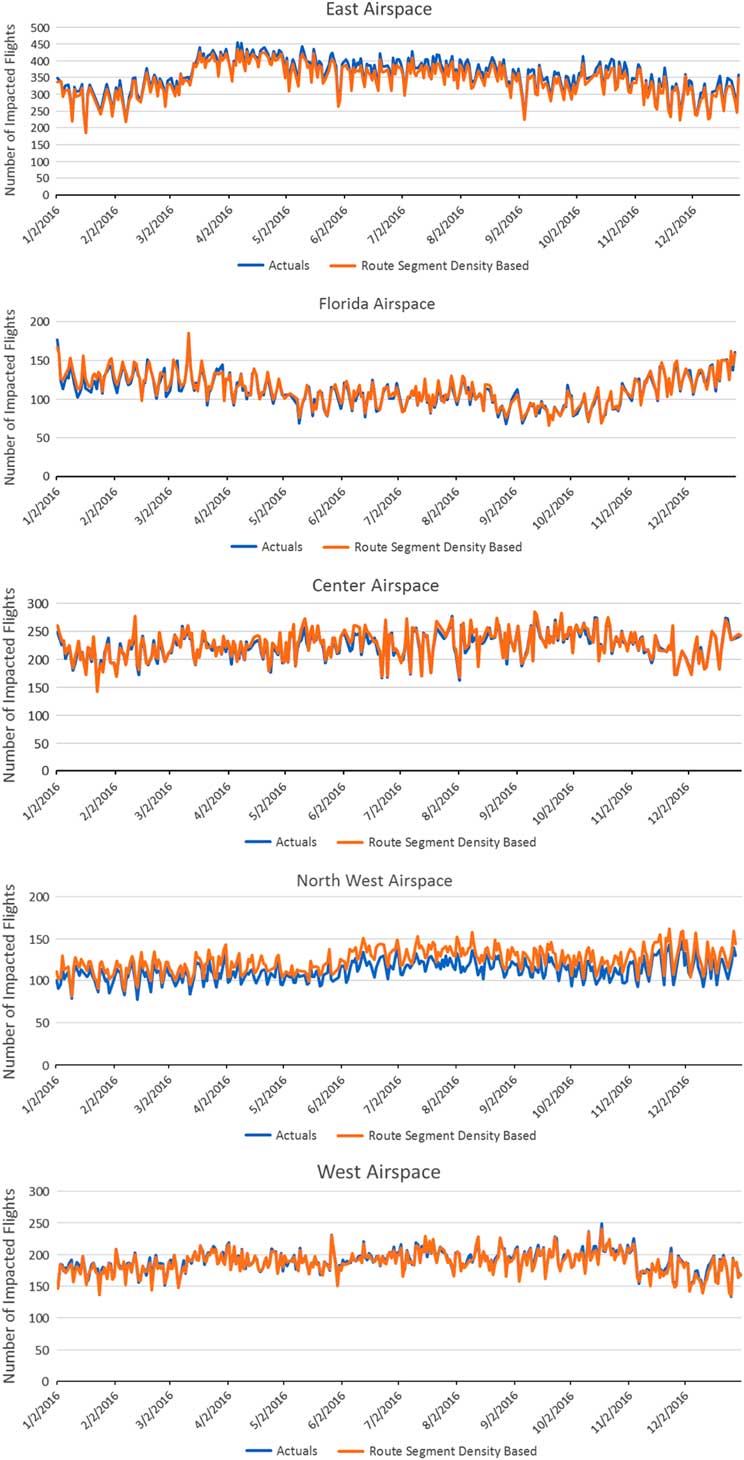
Using actually flown tracks, the number of flights intersecting the five test airspace during the time they were active was compared to the ones using the Route Segment Density map for the entire year of 2016, resulting in a total of 366 comparisons. The results, depicted in Fig. 7, show a close alignment between the actual number of impacted flights and the assessment made using the Route Segment Density map.
(Colour online) Actual intersection vs based on route segment density map for the test airspace areas.

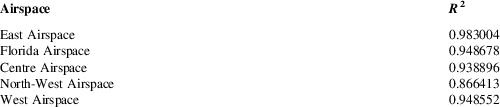
In another analysis, the assessed impact number was correlated to the actual impact numbers for all the areas of airspace. The results depicted in Table 3 show a strong correlation between the two.
Correlation between actual impacts and those based on route segment density map

These results indicate that the Route Segment Density map is an efficient way to reduce track data to perform instantaneous impact assessment. While there is some loss in accuracy due to multiple steps involved in generating the Route Segment Density map, it is not significant. An interesting observation from the results in Table 3 is that the data reduction for the North-West Airspace introduced higher error (indicated by lower correlation). There may be multiple reasons for this, such as lower conformance of flown path (compared to the filed flight plans) or less availability of available fixes to align the track to the actual path.
6.0 AIR TRAFFIC PROJECTION MODEL
Air traffic expected to flow through an airspace is influenced by several factors. These include the flight schedules; time of the day and seasonal pattern; effect of weather events such as thunderstorms, fog, low visibility conditions, wind speed, and direction; temporary capacity constraints such as construction on a runway or problems with radars; special events and military operations requiring closure of SUA; changes due to mechanical issues with aircraft; avionics capabilities of the aircraft; and air traffic control techniques used by the controllers. Most of these factors and their impact on the traffic flow are not known ahead of time. Flight schedules are published in advance; however, they do not include general aviation which makes up approximately 20% of U.S. traffic. Moreover, the schedule data do not contain the expected path (trajectories) of the flights, which is needed for modelling the impact of blocked airspace. For the near-term future (4–8h), it is possible to predict flight trajectories based on the filed flight plans and the available weather and wind forecast. However, in this research, we are targeting predicting traffic for a relatively long-term time horizon (up to 12 months in future) at a high level of time granularity (hourly), and for this, there are no clear predictors of the future traffic pattern.
The approach to predicting traffic used in this research applies heuristic methods to historical traffic patterns. Since traffic in the NAS is influenced by several factors that cannot be known in advance, projection estimates are produced as a range of likely low to likely high values along with the mean, instead of a single value, which is unlikely to be accurate. The model essentially produces an estimate of the range of likely impact of blocking an airspace for the given length of time, based on historical traffic pattern at that location.
The traffic predictions from this model are encoded in the Route Segment Density map data structure described earlier, to enable ‘what-if’ analysis for predicted impact.
To summarise, the steps involved in developing this model are the following:
• Analyse the historical traffic of the continental U.S. airspace to uncover traffic patterns.
• Develop a traffic projection model based on the results of this analysis.
• Encode the projection model into the Route Segment Density map to enable its use in a ‘what-if’ analysis paradigm.
These steps are described in detail in the sections that follow.
To assess the accuracy of the model, its results are compared to an alternate method of projection. The track data from the years 2011 to 2015 is used to develop the model to project for the year 2016.
6.1 Analyse historical traffic pattern in the continental U.S. Airspace
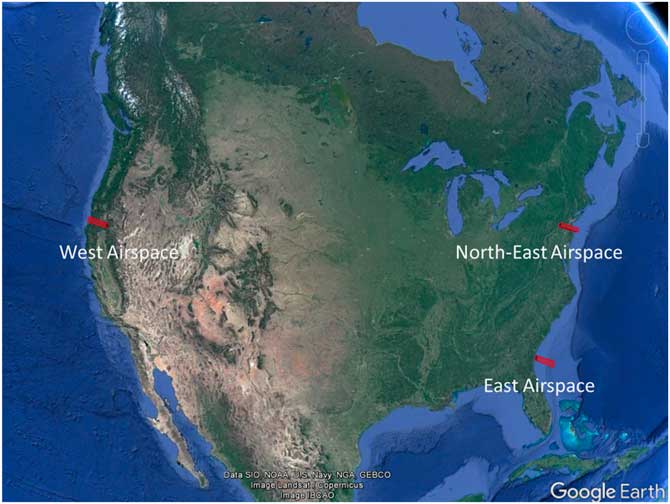
To analyse the historical traffic pattern in the continental United States, three areas of airspace are chosen at different locations, as shown in Fig. 8. These areas of airspace span approximately 100 NM and are oriented across the direction of traffic flow at that location, and together are considered to reflect the traffic pattern observed in the continental United States.
(Colour online) Airspaces chosen to proxy the U.S. air traffic pattern.

Air traffic within a specific airspace within the NAS changes from one moment to the next, and needs to be aggregated by a time unit for analysis. This unit of aggregation is a key factor to consider when uncovering historical air traffic patterns. For example, aggregation could be daily (consider the historical behaviour of all flights crossing an airspace during a day such as 1 March 2016), monthly (consider the historical behaviour of all flights crossing the airspace during a month, such as March 2016), and so on. The unit of aggregation should be sufficiently granular to capture the traffic pattern without being noisy.
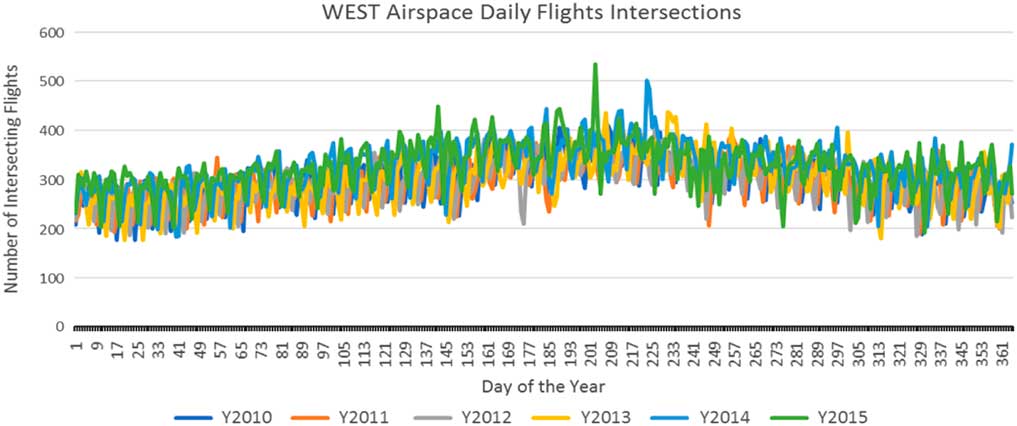
Flights for the West Airspace (see Fig. 8) aggregated daily over years 2010–2015 are shown in Fig. 9. The chart below appears very noisy and not suitable to uncover traffic patterns.
(Colour online) Flights aggregated daily for West Airspace during the years 2010–2015.

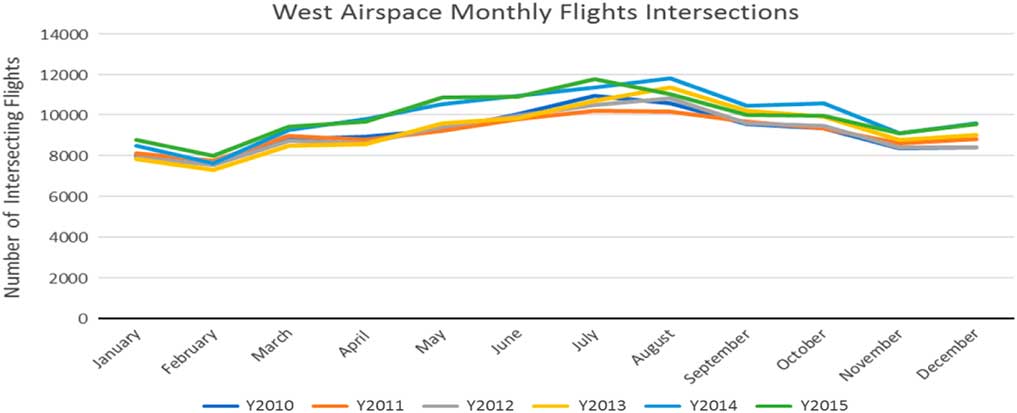
When aggregated monthly (see Fig. 10), the traffic plot appears flat with no pattern.
(Colour online) Flights aggregated monthly for West Airspace during the years 2010–2015.

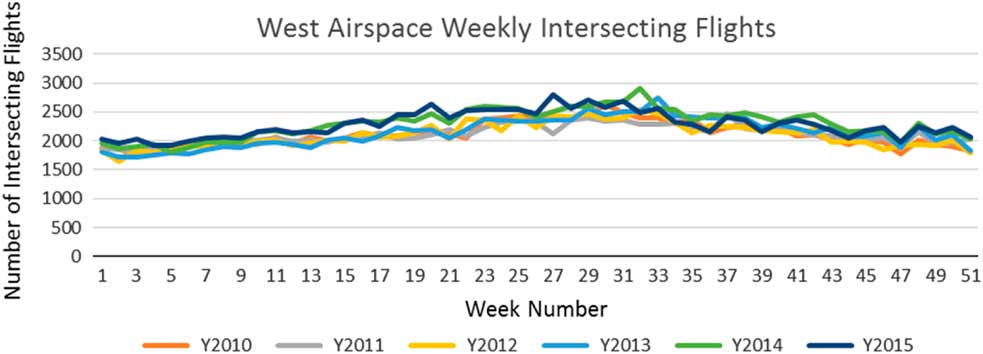
These results point to a need to consider a unit of aggregation between daily and monthly, that is at a weekly level. The weekly numbers begin at the start of the year; for example, week number 1 is the set of the first 7d of the year. Since a set of seven consecutive days represents all the days of the week, weekly aggregation cancels the effect of ‘day of week’ variation and appears to be a good candidate.
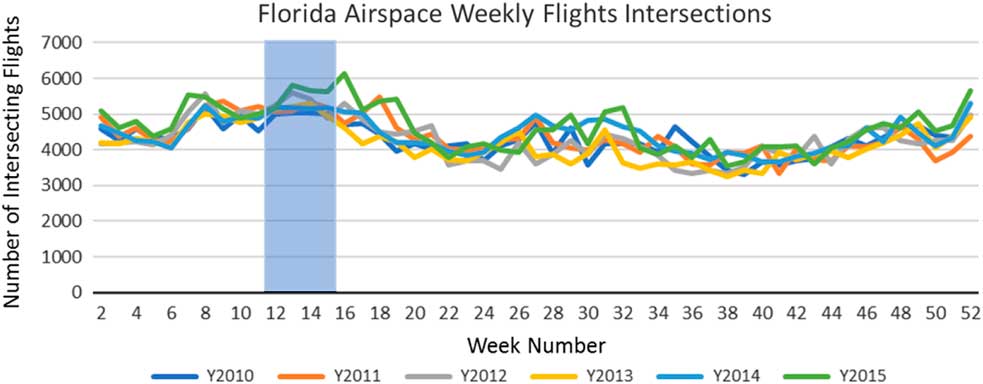
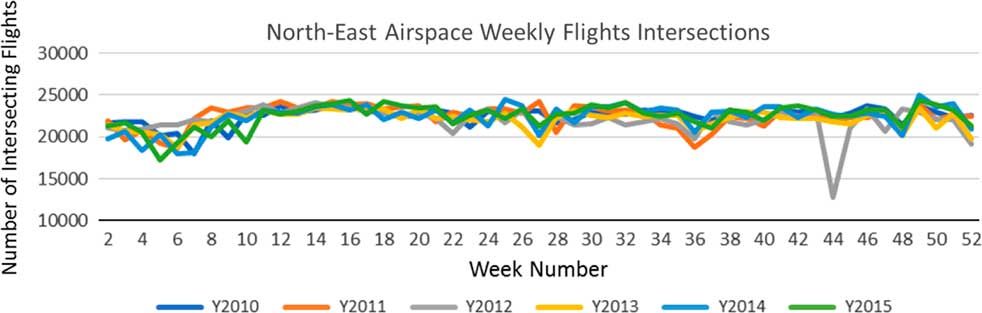
Figures 11–13 show the weekly traffic pattern for the three areas of airspace. The charts reflect the seasonal traffic trends, especially pronounced in Florida (see Fig. 12) and are not noisy. Based on these observations, weekly aggregation is chosen, as it is granular enough for a pattern discovery without being too noisy.
(Colour online) Flights aggregated weekly for West Airspace during the years 2010–2011.

(Colour online) Flights aggregated weekly for Florida Airspace during the years 2010–2011.

(Colour online) Flights aggregated weekly for north-east airspace during the years 2010–2011.

The charts above also indicate that the traffic flowing through the selected areas of airspace did not significantly change between years 2010 and 2015. A separate analysis revealed an average yearly growth of 2.75% during this time.
Based on the analysis above, and because air traffic tends to follow a weekly pattern, the projection model uses week number and day of the week to correlate historical days to the day to be projected. To capture the past seasonal traffic trend, the model additionally selects same weekday from 2 weeks before and 2 weeks after the week of the day being predicted from the previous 6 years (see the shaded section in Fig. 12), thus selecting 30 (5 days in each of past 6 years) historical days in total. The distribution of traffic in the selected historical days is used to arrive at the mean and likely low and high values of projected impact.
To summarise, steps to project for day Dp, at hour Hp occurring in week number Wp in the year Yp are:
a. From the previous year (Yp−1), select five historical days from the week numbers Wp−2 to Wp+2, which are the same day of the week as Dp.
b. Repeat the above steps for the previous 5 years (Yp−6) to (Yp−2), to get a total of 30 historical days.
c. Use distribution of impact for these historical days to project the impact for Dp; 25 percentiles and 75 percentiles are used as the low and high bounds and mean as the impact.
d. Hourly impact numbers are based on average impact during the hour Hp for the 30 selected historical days.
e. A multiplication factor of 1.0275 is applied to all metrics to reflect the historical grown rate of 2.75%.
For example, the traffic prediction for 1 March 2016, at Cape Canaveral (Tuesday occurring in week number 9) is based on the distribution of the traffic on Tuesdays during week numbers 7, 8, 9, 10, and 11 for the years 2011–2015.
6.2 Predict future traffic during holidays
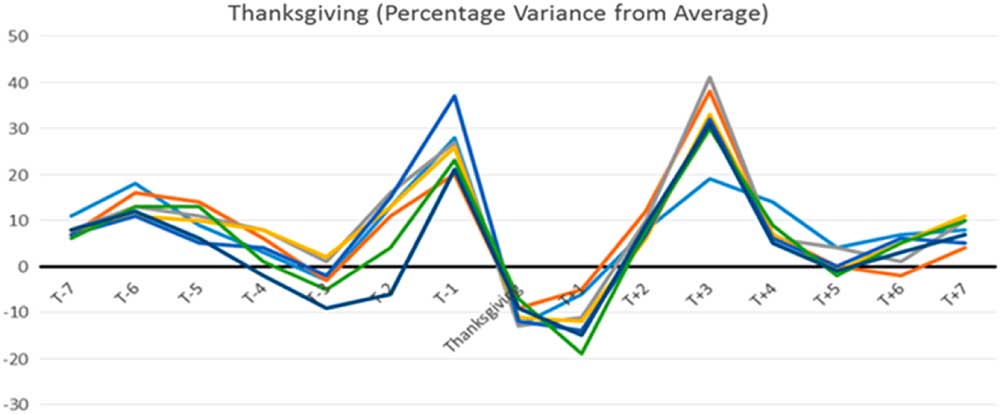
Holidays such as Christmas Day or Memorial Day change the air traffic pattern. Certain holidays, such as Memorial Day and Thanksgiving Day, fall on the same day of the week every year, and historical traffic patterns can be readily applied to these. Others, such as 4 July, may fall on a different day of the week every year, and the traffic pattern in that year will depend on a specific day, particularly in relation to the weekend. To uncover the holiday traffic pattern, the days relative to the holidays are compared for the years 2010–2014. Figure 14 shows the percentage variance in traffic from a 60-day mean around Thanksgiving Day for the Florida Airspace. Days relative to Thanksgiving Day are labelled as ‘T±<relative day>’, for example T – 1 means the day before Thanksgiving.
(Colour online) Historical traffic patterns during Thanksgiving.

The figure shows that the Wednesday before and Sunday after Thanksgiving Day tend to be busy, while day after Thanksgiving is light in traffic across all the years.
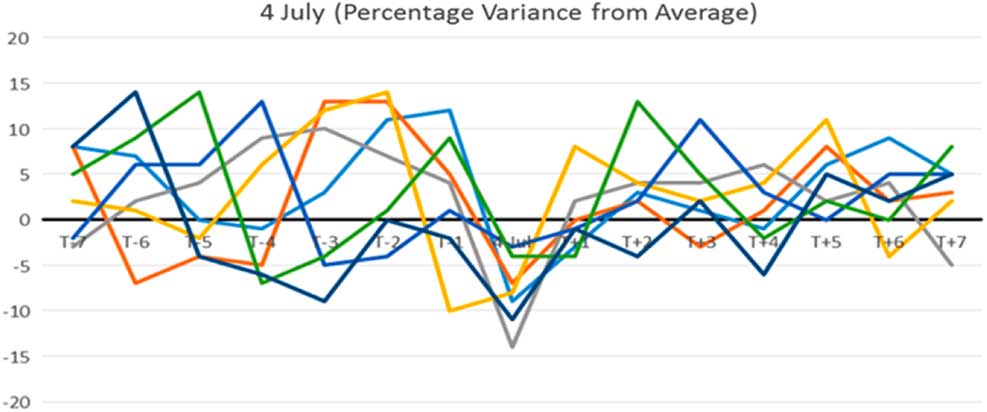
Figure 15 shows the percentage variance in traffic from a 60-day mean around 4 July for the Cape Canaveral site. The chart shows no specific trend, since 4 July may fall on a different day of the week each year, which in turn influences overall traffic trends (i.e. a Wednesday holiday may not produce increased demand whereas a Monday or Friday holiday may).
(Colour online) Historical traffic pattern during 4 July.

For holidays, that fall on the same day of the week (such as the Thanksgiving Day), the model selects historical days that are same relative days compared to the holiday. For other holidays, no special processing is used.
In this model, the holidays during which unusual traffic is anticipated are the following:
▪ Memorial Day
▪ Labour Day
▪ Thanksgiving Day
▪ Christmas Day
6.3 Adapt projection model for use in the route segment density map
The projection model described above needs to be encoded in the Route Segment Density map to support an on-demand projected impact assessment capability. The impact assessment model used to assess historical impacts described earlier can then be used to assess future impacts as well.
In Section 4 (Data Reduction and Encoding), bidirectional traffic traversing route segments is aggregated to generate a Route Segments Density map of the historical traffic. Route segments can also be used to store the projected bidirectional traffic density to generate a Projected Route Segment Density map. The projected traffic density of a route segment can be derived based on the projection model described above (i.e. by using the distribution of its usage across 30 historical days selected by the projection model).
One potential issue with this approach is that fixes and waypoints used by traffic in an area may change (or fixes can be renamed) over a period (6 years is used for this research). This would result in a route segment not appearing in all the past years, thus resulting in less than 30 days’ sample data to project for that route segment. Table 4 shows historical days that had the flight counts for the busiest 20 route segments (shown earlier in Table 1). Analysis of route segments in the top 2.5 percentile (450 route segments) in terms of usage showed an average number of historical days to be 23.8, which is considered acceptable for this model. Section 8 discusses other approaches that can improve the model sample size.
Frequency of route segment appearing in 30 historical days selected by the projection model

Since usage patterns of fixes and waypoints change over time, route segments used in the year prior to the projected year are used to make the projections.
To summarise, steps to project for day Dp, at hour Hp occurring in week number Wp in the year Yp are the following:
a. Select the surrogate day Ds from the previous year (Yp−1) as one that is the same day of the week as Dp and in the week number Wp.
b. For each route segment in the Route Segment Density map for day Ds, get the distribution of the traffic density for historical days using the traffic projection model. Fewer than 30 days may be selected, as discussed before.
c. Compute the mean value, 25 percentile, and 75 percentile values as the range of projected traffic density for that route segment.
d. Repeat steps b and c for each hour of the day, to store it in the Projected Route Segment Density map.
e. The Projected Route Segment Density map can be used to project traffic for any blocked airspace based on segments that intersect the airspace.
The projection model encoded in the Route Segment Density map uses the distribution of route segments in the previous years to generate mean, low, and high estimates of predicted impact. Using a value based on a large sample size reduces the effect of outliers in the historical usage counts.
6.4 Preliminary results of using the projection model and discussion
There is innate randomness in the traffic pattern in the NAS, which will limit the accuracy of any projection model to predict it. This model targets relatively long-term horizon of 12 months and at 1-hour granularity, and is not expected to yield high-fidelity results. Pre-processing and reducing data to make the model suitable for use in a ‘what-if’ analysis capability will further degrade its results. The approach used to assess the efficacy of this model is to compare its results with an alternate traffic projection model, as well as with observed impacts based on actual flight paths. The model is developed using historical traffic from the year 2011 to 2015, the tracks from 2016 are used to assess the results.
The following comparisons are performed:
• Comparison to a projection model that uses TAFFootnote 5 average (2.0%) growth applied to the previous year’s traffic as a proxy for the next year.
• Comparison of trends of the moving average of actual impacts to the moving averages of projected low and high values for the year.
• Percentage of times the actual impact values fall within the predicted low to high range.
All the comparisons are performed on a set of test airspace areas listed in Table 2.
6.5 Comparison with projection based on the previous year traffic model
The ‘truth’ data are first generated as the daily number of flight tracks intersecting the test areas of airspace (see Table 1) to arrive at a total of 365 data points (29 February is ignored) for the year 2016. These are termed ‘Actual’ intersections.
Next, the projection using the previous year traffic model is generated. This model projects by applying a growth factor to the prior year traffic. The daily traffic in the year 2015 is used to find the number of flights that will intersect the test areas of airspace. A growth factor of 2.0% is applied to the result to arrive at 365 projections for the year 2016. These projections are termed ‘Prior-year based’. The difference between actual and projected value (actual minus projected) is a measure of error.
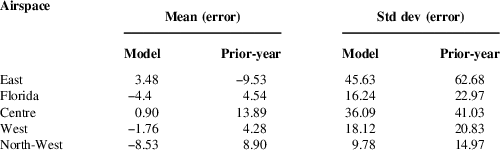
Finally, the model is used to project demand for each day in 2016, where these projections are termed ‘Model-based’. The difference between actual and model projected values is a measure of error for the model; this is compared to observed error for the Prior-year-based model, and results are shown in Table 5.
Comparison between prior-year based and model-based projection accuracy

The results show that the Model-based projections are consistently more accurate than the Prior-Year-based projections, indicated by lower mean and standard deviation of error for all of the areas of airspace.
6.6 Comparison of trends of actual vs estimated range
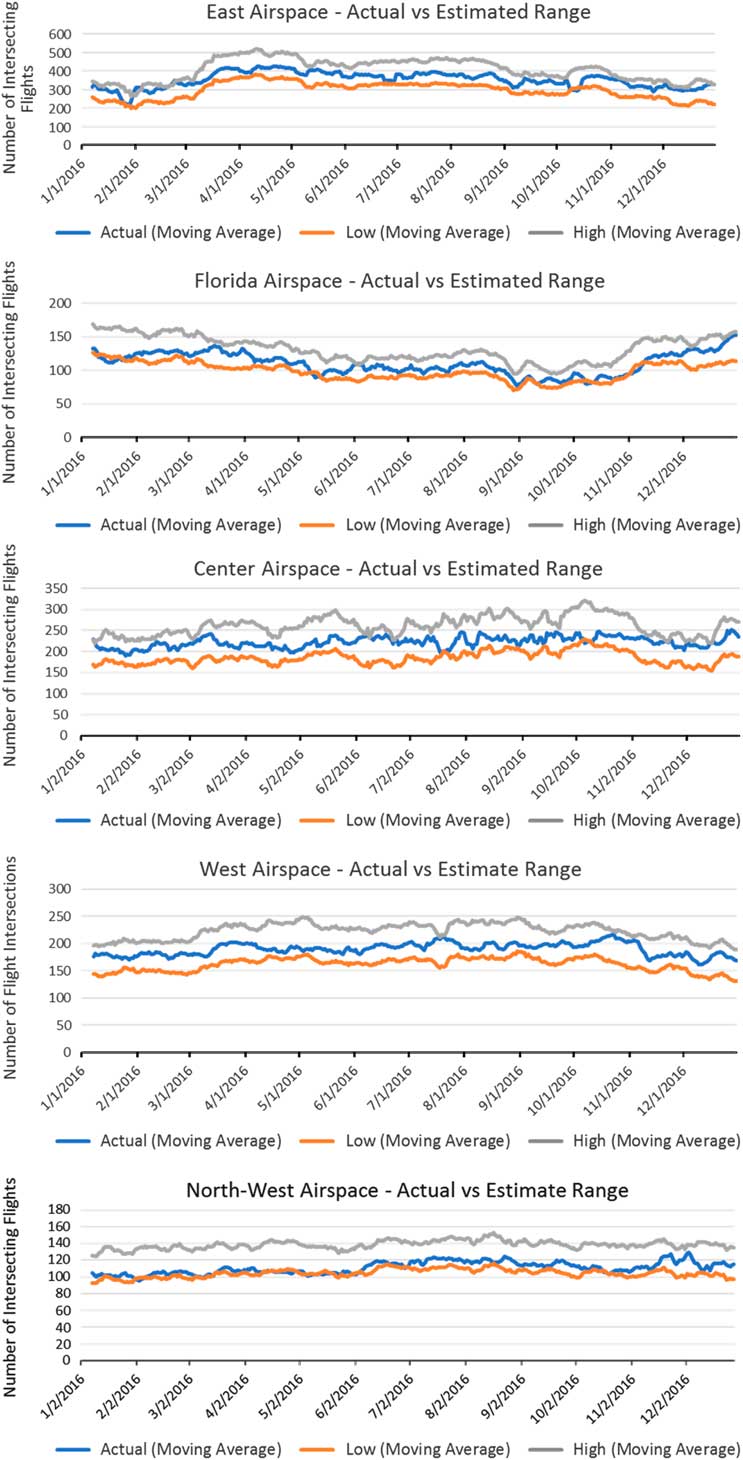
Seven-day moving averages of actual intersections are plotted along with moving averages of low and high estimates of the model for all test areas of airspace in Fig. 16.
(Colour online) Actual intersection vs. projected range for all test airspaces.

The charts show that estimated range values follow trends similar to actual impacts, and in most cases, the moving average of actual values falls within the estimated range.
6.7 Accuracy of estimated range
Table 6 shows the percentage of actual flight intersection falling in the projected range in the 365 projections made for the year 2016.
Percentage of actual values falling within the estimated range

The results in Table 6 show that the estimated range in most cases covers the actual flight intersections.
Note that this is effectively a sensitivity study – future study is to evaluate the sensitivity of model performance to variations in constraint parameters. The test areas of airspace are approximately 200 NM in span and oriented perpendicular to the direction of traffic. Projection of blocking airspaces of different size, shapes, and locations may produce different results. Another variable is the activation time; changing it from the current value of 2h may result in the different performance of the model.
7.0 Implementation
An important goal of this research is to explore the feasibility of the model in providing an instantaneous impact assessment of arbitrarily defined airspace using a ‘what-if’ analysis paradigm. To accomplish that, the projections were generated and encoded in advance in a pre-processing step, and a graphical user interface was developed to test the ability of the model to support ‘what-if’ analysis.
7.1 Pre-processing to generate and encode projections
The model required multiphase processing of daily flight tracks spanning 5 years and generating the resulting Route Segment Density maps. Steps such as inferring flown flight plans (see Section 5) are very compute-intensive, as they require geo-spatial queries over a large database of nodes to align flight plan path to flown path. The team used a massively parallel high-performance computing cluster with 896 nodes and 1 TB of disk to process the data and fine-tune the model.
The Route Segment Density maps were stored in a geohash database to allow quick responses to spatial queries and partitioning of the data to match user geographical view. The size of Route Segment Density maps got reduced to approximately 45% of the original track data, reflecting a significant data reduction.
7.2 Graphical user interface
A graphical user interface was developed to illustrate the proposed concept and capabilities. This interactive, web-based interface is a prototype environment that allows the user to conduct ‘what-if’ analysis, composed of a web application that provides a front-end user interface using an AngularJS interface and a back-end Java web service interface using Spring.
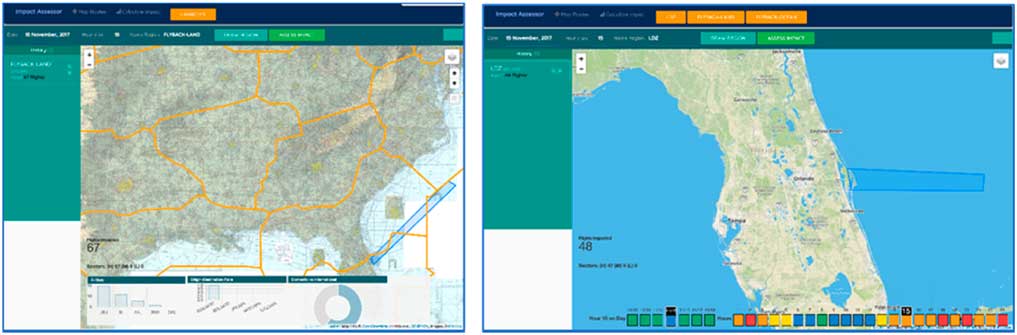
The front-end user interface provides key functionality for the user to configure impact assessment parameters including date, hour, and the name of the blocked airspace region. A user can view traffic density for the selected time on the Route Segment Density map and can ‘draw’ airspace on the map. Two views shown are the ‘FAA View’ and the ‘Space Operator View’ to provide different perspectives of the same capability to two different stakeholders (see Fig. 17). The ‘FAA View’ provides flight-based metrics and airspace analysis, whereas the ‘ Space Operator View’ is limited to display of colour-coded ‘impact-levels’ of a specific space launch or re-entry operation.
(Colour online) Impact assessor FAA view (left) and space operator view (right).

The back-end service handles requests from the interface using a REpresentational State Transfer (REST) web service, which provides a uniform interface to the prediction model capable of rapid assessment of air traffic impact to blocked airspaces. This design decouples the server and client and enables underlying components, including the prediction model, to be evolved independently of the service interface.
The impact assessment data are provided from the web service as a comma-separated value (CSV) file, which is reformatted and parsed for display. D3 is used in conjunction with Leaflet to provide both a geospatial mapping display and bar and pie charts displayed after executing an analysis. That enables a user to ‘draw’ an airspace or load in predetermined hazard areas onto a map to instantaneously get metrics and visualise a Route Segment Density map over the intersecting airspace at a user-designated time. Mapping overlays are exposed using Web Map Service (WMS)Footnote 6 services, which include contextual charts including sectional, and en route low and high charts.
The graphical user interface performed well and supported interactive impact analysis; most queries were serviced within 3s.
8.0 CONCLUSIONS AND FUTURE WORK
The rising tempo of activities by new entrants such as space vehicle operators is putting increasing demands on the national aviation airspace. As air navigation service providers (ANSPs) such as FAA seek to balance competing demands on the NAS safely and efficiently, there is a need to research ways to increase transparency and collaboration in the use of airspace among all stakeholders. This research is aimed at developing models and techniques to project, up to 12 months in advance, the impact of blocking any airspace. An explicit goal of this research is to enable the projection model for use in a ‘what-if’ analysis that is accessible to a broad range of users with no prior knowledge of air traffic. Such a capability will promote collaboration among all stakeholders and ANSPs. There are multiple challenges in achieving these research goals. First and foremost are the innate uncertainties in factors affecting daily air traffic patterns and its lack of clear predictors. Another challenge is enabling instantaneous response to the impact queries.
In this paper, we present an approach that uses historical traffic patterns to project future NAS impact. We describe a data structure with encoded projection information to support ‘what-if’ analysis capability and assess the accuracy of the projection model as well as the responsiveness of the web-based prototype based on the model. The results on the efficacy of the data structure show that it is accurately able to represent the projected or historical traffic flow crossing an arbitrary airspace. The initial results of the projection model show good performance given the uncertainties of the traffic pattern, the robustness of this performance is an area of continued work. Finally, the performance of the web-based prototype has demonstrated the model’s ability to support ‘what-if’ analysis of the impact of blocking airspaces.
The main limitation of the projection model is that it is based on the yearly traffic pattern within the U.S. airspace. It needs to be adapted to other geographical locations as the traffic growth trend and the impact of holidays on it will be different at those locations. In addition, any planned future changes in route structures will impact the also accuracy of the model. Finally, the model cannot be used to answer queries such as the benefit of opening a special use airspace which has historically been always closed.
This research is ongoing, and other approaches to predicting impact are being explored. For example, instead of using route segments, a 10 NM grid might be used to capture historical traffic patterns and to make projections. Doing so addresses the issue of changes in use of fixes and waypoints. Another avenue being considered is to use the flight schedules for predictions in the near-term range of 3–4months. Enhancements to the functionality and features are also being researched. These include assessment of extra distance and delay as an additional impact metrics, the ability to assess the impact of multiple airspaces of the same time or of differing time windows, including altitude attributes for an airspace (floor and ceiling), and extending the model to locations worldwide.
DISCLAIMER
The contents of this document reflect the views of the author and The MITRE Corporation and do not necessarily reflect the views of the Federal Aviation Administration (FAA) or the Department of Transportation (DOT). Neither the FAA nor the DOT makes any warranty or guarantee, expressed or implied, concerning the content or accuracy of these views.