Introduction
The detection and quantification of the prevalence of genetically modified organism (GM) contamination in seed exports is a critical element of regulatory compliance. The sampling, molecular analytical and statistical protocols for the detection and quantification of GM contamination are well established (Remund et al., Reference Remund, Dixon, Wright and Holden2001; Whitaker et al., Reference Whitaker, Freese, Giesbrecht and Slate2001; Laffont et al., Reference Laffont, Remund, Wright, Simpson and Gregoire2005; Emslie et al., Reference Emslie, Whaites, Griffiths and Murby2007; Hernandez-Suarez et al., Reference Hernandez-Suarez, Montesinos-Lopez, McLaren and Crossa2008). The absence of GMs is demonstrated by testing seed samples to the level of the practical limit of detection using polymerase chain reaction (PCR)-based methods. The largest sources of error in these protocols arise from the difficulties inherent in taking representative and random samples of seeds from large lots. Practically, this may result in false negative assays resulting when only a subsample of the ground sample is analysed (Laffont et al., Reference Laffont, Remund, Wright, Simpson and Gregoire2005; Begg et al., Reference Begg, Cullen, Iannetta and Squire2007). There are, however, lower limits to the degree of contamination that can be reliably detected using these protocols. These limitations arise principally from the mass of sample that can be reasonably processed and analysed using PCR. In the case of flax, for example, the practical level of detection in the PCR assay is 0.01%, or approximately 1 GM seed in 10,000 non-GM seeds. This amount corresponds to approximately 14 molecules of DNA in a test sample, assuming a single-copy target in a haploid genome with 1 C = 0.7 pg (Bennett and Leich, Reference Bennett and Leich2005).
While the procedures to reliably detect high levels of GM contamination are well understood, the quantification of levels of contamination below the established detection limits of tests is much more challenging. When GM prevalence is high enough that most seed samples taken from a population will contain GM seeds, methods such as quantitative PCR can reliably be used to estimate GM prevalence (Begg et al., Reference Begg, Cullen, Iannetta and Squire2007; Emslie et al., Reference Emslie, Whaites, Griffiths and Murby2007). When contamination levels are so low that most subsamples are likely to be uncontaminated, then a different approach is required. The number of repeated tests performed on a seed lot and the proportion of those tests that returned a positive result provides enough information to estimate the level of GM contamination in that seed lot. A simple statistical method is presented for the quantification of low levels of GM contamination, which is based on the results from standard GM testing procedures. Accurately quantifying low levels of contamination is critical in a regulatory environment where there are published acceptable thresholds of contamination, but an occasional sample tests positive. We illustrate the application of this method using the case of the GM flax variety ‘Triffid’ (McHughen et al., Reference McHughen, Rowland, Holm, Bhatty and Kenaschuk1997).
Flax (Linum usiatissimum) is grown for seed (linseed) or fibre (isolated from the stem of the plant). Canada is the world's largest producer of flax seed, generating 50% of world production, with exports accounting for 80% of the global flax trade. Most of Canada's flax is grown in the Prairie Provinces and used primarily for seed oil. In April of 2009, transgenic seeds were presumably found in two 5000-tonne shipments of flax grain during preprocessing in Europe. Additional shipments of Canadian flax have subsequently tested positive for transgenes in Japan and Brazil. The presence of transgenes in flax shipments from Canada relates back to the mid-1990s introduction of the genetically modified flax ‘Triffid’ (McHughen et al., Reference McHughen, Rowland, Holm, Bhatty and Kenaschuk1997). This variety was deregistered in 2001 due to concerns about the effect of production of GM flax on export markets. Approximately 4000–5000 ha of CDC Triffid was grown by Canadian seed growers across western Canada and about 5500 tonnes of ‘Triffid’ seed was collected during the recall. Off-shore markets for Canadian flax have not approved GM flax and have zero tolerance for its detection in shipments. The Flax Council of Canada (www.flaxcouncil.ca) has observed detection of widespread, low-level presence of GM flax in commercial flax stocks. Positive results for the GM construct have also been found in some Canadian pedigreed seed lots. Accurate quantification of the level of GM contamination in Canadian flax seed lots is critical for maintaining the export trade in this crop.
Materials and methods
A simulation model was written to generate the number of positive tests expected to arise from a series of tests on a seed lot with a given proportion of positive seeds, and incorporates estimates of the rates of false positives and false negatives expected to occur during the testing process. We used simulation modelling rather than the derivation of an analytic solution in this study. Simulation modelling is widely used to examine complex systems and provides several advantages in this type of study (Law, Reference Law2007). These advantages include: (1) the approximation of real-world sampling regimes and data; (2) direct quantification of the variation expected in test results from a given underlying sample; and (3) ease in the incorporation of sampling errors. Further, such simulations can be easily modified and applied to sampling designs differing in detail from the flax example presented here. The simulation was written using the R statistical package (R Development Core Team, 2009). R is an open-source program and the code required to reproduce the simulations described here is provided in the supplemental material which can be found online at http://journals.cambridge.org/ssr. While all of the results presented here are based on the standard flax sampling regime of 10,000 seeds per sample (Canadian Grain Commission, 2010) this program may be used for any number of seeds per test and any number of tests per population. Throughout this paper we assume that random representative samples were taken from seed lots. Failure to collect representative samples can introduce serious biases into seed test data (Begg et al., Reference Begg, Cullen, Iannetta and Squire2007).
Given m repeated tests on samples taken from a single seed lot, a sample size of n seeds per test, and the proportion, p, of positive seeds in the population, generate a vector of n random numbers from a binomial distribution (either 0 or 1) where the probability of a given number being 1 (positive for the GM trait) is p, the proportion of positive seeds in the population. When the sum of the vector of n random numbers is ≥ 1, indicating one or more GM-positive seeds in the sample of 10,000, a test with a false negative rate of zero is deemed to have returned a positive result. If the false negative rate is greater than zero then a single number is drawn from a binomial distribution where the probability of the number being 1 (positive) is 1 − (false negative rate/vector sum). The false negative rate is the probability of a PCR assay returning a negative result from a sample with 1/n positive seeds. This probability is divided by the number of positive seeds in the simulated sample (vector sum) since the false negative rate should decline as the number of copies of the GM construct in the sample increases. If the sum of the vector is zero then the test result is deemed negative if the false positive rate is zero. If the false positive rate is greater than zero then a single number will be drawn from a binomial distribution where the probability of the number being 1 (positive) is the false positive rate. The false positive rate indicates the proportion of known negative samples where amplification of a non-GM construct occurs. Repeat the above simulation m times and record the number of positive tests. The number of positive tests out of m repeated tests is equivalent to the number of positive/trace results returned for a series of PCR assays on samples taken from a large seed lot. A positive or trace result is returned when the ‘Triffid’ construct-specific PCR exhibits amplification equal to or below a positive standard of 0.01% or approximately 1 GM seed in 9999 non-GM seeds.
Repeating the above simulation many times for a wide range of values of p will produce a distribution of the values of p expected to arise from each number of positive tests from 0 to m. These distributions can be used to estimate the mean or median proportion of positive seeds expected to arise from a given number of positive tests, and enable the calculation of confidence intervals around those estimates. These distributions are unique to each number of m and thus the simulation must be re-run for each value of m of interest. The distribution of prevalence rates for each number of positive tests is suitable for the generation of confidence intervals, though the skewness of distributions for smaller numbers of positive tests suggest that the confidence intervals around the median may be preferred over intervals around the mean.
Example simulations were run with x = 10,000 seeds per test, m = 4 and 20 tests per seed lot, p ranging from 1 × 10− 8 through 1 × 10− 3 (1 in 100 million positive seeds through 1 in 1000 positive seeds). For each value of m, 100,000 unique values of p equally spaced between the upper and lower limits were used. The above simulations were run using a false positive rate of 0.125 and a false negative rate of 0.006. Repeated tests on a standard positive sample (1 GM seed in 10,000 seeds) from a commercial testing laboratory indicated that the false negative rate of this assay is 0.125 (155 negative out of 1241 total tests). The same laboratory showed a false positive rate of 0.006 as laboratory observed amplification occurred in 4 negative controls out of 684 tests. To evaluate the impact of false negative test results, we ran simulations at four false negative rates (0, 0.01, 0.1 and 0.5) with m = 20, x and p as above, and a false positive rate = 0. Similarly, to evaluate the impact of false positive test results, we ran simulations at four false positive rates (0, 0.01, 0.1 and 0.5) with m = 20, x and p as above, and a false negative rate = 0.
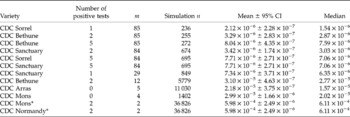
We applied this procedure to test results conducted in 2010 on Crop Development Centre (CDC) flax breeder seed lots (Table 1). The seed lots were derived from breeder seed long rows grown at the University of Saskatchewan breeder seed production site at the Kernen Research Farm, Saskatoon, SK, Canada. Seed samples were tested by Canadian Grain Commission recognized GM flax testing laboratories. Repeated tests (m) ranging from 2 through 85 were conducted on individual seed lots. Comparison of the observed numbers of positive tests to the example simulations suggested GM prevalence was frequently much less than 1 in 10,000 seeds, therefore simulations were run for 10,000 values of p equally spaced between 1 × 10− 8 and 1 × 10− 5. If the simulation n (number of simulations returning a value equal to the observed number of positive tests) was less than 100, the number of simulations was increased. The false negative rate was set to 0.125 and the false positive rate to 0.006 for these simulations.
Number of positive tests for Triffid and the total number of tests performed (m) on flax breeder seed lots. The mean and median contamination levels and the confidence intervals reported here were calculated using the simulation procedures outlined in this paper. Simulation n is the number of simulated populations with the noted number of tests. We recommend that a simulation n of at least 100 be achieved before reporting results

* The values for these seed lots are a minimum, as 2/2 positive results cannot be distinguished from much higher levels of prevalence.
Results and discussion
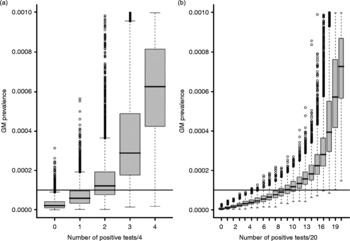
Simulations using 10,000 seeds per sample and both 4 and 20 tests per seed lot confirm that at low prevalence rates the number of positive tests from a series of m tests is a good predictor of GM prevalence in a sample (Fig. 1). As expected, at prevalence rates above 1 in 10,000 seeds (1 × 10− 4) the majority of tests come back positive (Fig. 1). These results also demonstrate the limitations of the current standard of 4 tests per lot. A ‘negative’ sample may have an actual prevalence rate as high as 3 seeds per 10,000 while more than 75% of samples with a single positive test out of four will have a GM prevalence of less than 1 in 10,000 seeds. Increasing the number of tests (m) done on a sample narrows the range of prevalence predicted for a particular number of positive tests.
Boxplots showing the proportion of GM-positive seeds in a population versus the number of positive tests out of a possible total of (a) 4 and (b) 20 expected from 100,000 simulation runs with a false negative rate of 0.125 and a false positive rate of 0.006. The horizontal lines indicate GM prevalence of 0.01% or approximately 1 in 10,000 seeds.

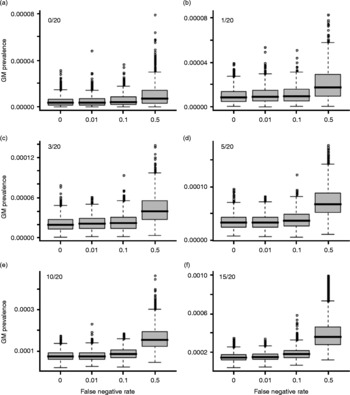
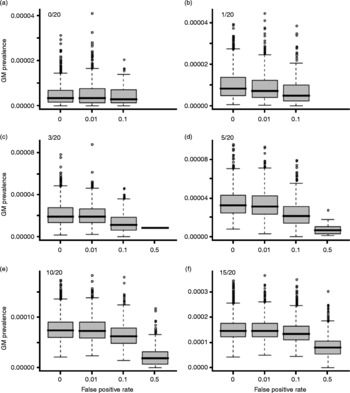
High levels of false negative error led to increased estimates for GM prevalence for a given number of positive tests, though a false negative rate of 0.1 (similar to the observed rate of 0.125) had a relatively small effect on the estimated prevalence rate for a given sample (Fig. 2). The impact of false negatives is at higher when GM prevalence is higher, since false negatives are only a problem when a GM-positive sample is being tested. The effect of false negatives is to reduce the number of positive tests returned out of m tests, leading to a higher prevalence estimate for a given number of positive tests. High levels of false positive error led to reduced estimates of GM prevalence for a given number of positive tests (Fig. 3), though a false positive rate of 0.01 (similar to the observed rate of 0.006) had little impact on the estimated prevalence rate. While the effects of false positives and negatives appear to be low, we recommend that estimates of these errors be incorporated into any analysis to guard against underestimates of the true GM prevalence.
Effects of changes in the false negative rate on estimated GM abundance for six levels of returned postive tests.

Effects of changes in the false positive rate on estimated GM abundance for six levels of returned postive tests. The simulation produced no instances with fewer than 3 positives out of 20 at a false positive rate of 0.5.

‘Triffid’ contamination in breeder seed lots ranged between two GM seeds per million and six seeds per hundred thousand (Table 1). Although the level of detection of the ‘Triffid’ construct PCR assay is 0.01%, or approximately 1 GM seed in 10,000 seeds, the estimated level of ‘Triffid’ seed in these breeder seed lots is clearly much lower. The EU test standard is 0.01%; however, the EU tolerance level is zero for unapproved events such as GM flax. At the extremely low level of GM presence we demonstrate here, the detection of GM contamination in any given seed lot is largely a function of sampling effort. Given that zero contamination can only be confirmed by destructive testing of every seed in a lot, a zero tolerance approach is technically unfeasible.
This method shows that false positive and negative tests are of relatively small importance when estimating prevalence in GM-contaminated lots. These errors can be critical, however, when uncontaminated lots are tested. Given the repeated testing done through the product-handling chain (i.e. producer before seeding, upon delivery to the elevator, when loaded onto a ship, etc.), these errors will likely produce substantial numbers of contradictory results, and will increase the producer's risk of having clean lots rejected. Given the industry standard of four tests per lot, a false positive rate of 0.006 means that we should expect that on average 2.4% of clean lots will have at least one false positive test out of 4 (0.0238 = 1 − 0.9944). This probability expands considerably as the number of tests per lot increases. For example we can expect 9.2% of clean lots to test positive at least once in a series of 16 tests (a realistic number for a product-handling chain), and in over 85 tests 40% of clean lots will have at least one positive test. Thus, given the current false positive rates, we cannot distinguish the contamination levels reported in Table 1 from false positives occurring in a clean sample.
Accurate quantification of rare occurrences is critical to the effective monitoring and regulation of GM seeds. The method introduced in this paper is applicable to any situation where a trait is rare relative to the number of individuals that can be assessed in a single test. While rates of false positive and negative tests are built into the simulation, it is not possible to separate the small number of positive tests expected in a sample contaminated at very low levels from the expected number of false positives. We recommend that the reasons for these false positive tests be carefully explored and all possible sources of error (e.g. cross contamination, non-specific amplification, etc.) be quantified and minimized. Finally, we recommend that this approach to estimating prevalence is only used when GM prevalence rates are below 1 in the number of seeds examined per test. At higher prevalence rates most seed samples will contain GM positive seeds. In this case direct estimates of GM abundance based on copy numbers detected using real-time PCR will likely be much more accurate and cost effective (e.g. Begg et al., Reference Begg, Cullen, Iannetta and Squire2007).
Acknowledgements
Quantum Biosciences (Saskatoon, SK, Canada) kindly provided data on assay error rates. D. Murrell, G. Rowland, F. Bekkaoui, L. Marquis and P. Kononoff provided comments on drafts of this manuscript.