Introduction
Though mass gatherings (MG) occur daily throughout the world, they intrinsically have the potential for significant health risks for all involved. They pose a challenge for those responsible for providing in-event- health services (IEHS). Reference Friedman, O’Connor, Munro and Goroff1 The World Health Organization (WHO) defines a MG as “a gathering of persons at a specific location for a specific purpose for a defined period of time” with “the number of people attending to be sufficient to strain the planning and response resources of the community, state or nation hosting the event.” 2 The straining of planning and response resources is further emphasized by Arbon who adds that a mass gathering is “a situation during which crowds gather and where there is the potential for a delayed response to emergencies because of the limited access to patients.” Reference Arbon3 Starting in 2006, municipal governments in Belgium have been obliged to perform a risk assessment involving each MG on its territory. 4 All too often, the variables used for this risk assessment stem from a police or firefighter service risk assessment and do not meet the medical needs for a MG. Although most variables known to impact patient presentation rates (PPRs; the rate of patient presentations per 1000 attendees Reference Lund, Turris and Bowles5 ) during MG are well established, Reference Arbon3,Reference Milsten, Maguire, Bissell and Seaman6–Reference Moore, Williamson, Sochor and Brady9 planners tend to rely on irrelevant, insufficient, anecdotal, or historical evidence. Reference Allgaier, Shaafi-Kabiri and Romney10,Reference Westrol, Koneru, McIntyre, Caruso, Arshad and Merlin11 However, when the MG is approved, the government guarantees that IEHS meets the Belgian national standard of emergency medical services (EMS) response time and quality of care. During 10 days in July, the city center of Ghent (Belgium) transforms into 1 of Europe’s largest cultural festivals with 100s of indoor and outdoor activities, street animation for young and old, cost-free music on 18 city squares, and 6 international festivals within the Ghent Festivities being organized. As a result of its multifaceted profile, Reference Gentse12 excessive alcohol use, and attracting daily over 100000 people, emergency medical coordinators face the daunting task of predicting the number of patient presentations and forecasting the staffing of medical personnel needed.
The provision of IEHS decreases the transport to hospital rate (TTHR; the number of patients transported to hospital per 1000 attendees). Reference Lund, Turris and Bowles5,Reference Alquthami and Pines13,Reference Locoh-Donou, Guofen, Welcher, Berry, O’Connor and Brady14 As Ranse, et al. reported, the number of patients presented to an emergency department (ED) during a MG can range between 1 and 190. Reference Ranse, Hutton and Keene15 With the overcrowding of the EDs already being a daily struggle, the potential of a sudden surge of patients during a MG, due to the insufficiency, or absence of in-event health services (IEHS), could jeopardize the EDs response capacity. A valid prediction model is needed to mitigate the burden MG can place on regular health services (with IEHS preventing additional ambulance interventions and hospital admissions). This model can advise event organizers and government officials on the level and specificity of IEHS. However, with the models most cited in literature being those of Arbon, Reference Arbon, Bridgewater and Smith16 and Hartman, Reference Hartman, Williamson and Sojka17 the literature on predictive models is scarce. The need for a comprehensive risk assessment tool to predict patient presentations is clear.
A Belgian model, Plan for Risk and Events (PRIMA), a predictive medical resource model, was recently developed and described to be used for predicting PPRs at various types of MG. Reference Spaepen, Haenen and Hubloue18 While the first steps of validating this model have been taken, Reference Spaepen, Haenen, Kaufman, Beens, Vandekerckhove and Hubloue19 more data on PPR enabling further validation of the PRIMA model across other types of MG is lacking. This study compares the actual number of patient presentations at this annual public cultural festival with the aforementioned models’ predictions and the PRIMA model to validate the PRIMA model.
Method
Study design
Collected data from patient presentations of 7 years (2013 – 2019) formed the basis for the conducted retrospective observational study. The Ghent Festivities are held annually for 10 days in July in the city center of Ghent, Belgium. Data was collected on crowd size, maximum daily temperature, humidity, days of the week, patients presenting at IEHS, EMS calls via “1-1-2,” patients self-referring to local EDs, and interventions by mobile medical teams at the MG event zone.
All patients who sought medical help from 1 of the 3 first-aid stations on-site of the event, patients who referred themselves to a local ED or called “1-1-2" from within the festivities-zone and were brought by EMS to a local emergency department were included. Belgian Red Cross Flanders provided in-event health professionals (ranging from first responders to nurses and emergency physicians) and were present during the whole of the MG. All first aid posts had sufficient basic first aid supplies or advanced life support supplies. Patient presentations were defined as all assessments by IEHS (e.g., from minimal interventions by basic life support (BLS) providers to full patient assessments by physicians).
Data from the actual patient presentations were collected from the IEHS using their specific patient registration software (MedTRIS®) (Belgian Red Cross, Flanders, Belgium), documenting patient demographics, triage codes, treatment administered, and patient disposition. Reference Gogaert, Vande Veegaete, Scholliers and Vandekerckhove20 In-event health services handed these numbers over to the local office of the federal health government daily along with the numbers of EMS calls for EMS ambulances and mobile medical teams called specifically to the MG location. These were being provided daily by the emergency medical dispatch center. Patients who self-admitted to 1 of the 4 Ghent EDs were asked if they came from the festival upon arrival. The hospitals handed these numbers daily to the local office of the federal health government. Belgian Federal Public Service Health, Food Chain Safety and Environment (FPS HFCSE) provided us with the data used for this study. It consisted of patient presentations to IEHS, EMS calls for EMS ambulances and mobile medical teams, and ED admissions of the 4 hospitals in Ghent.
Post-event, the actual numbers of patient presentations were used as control data compared to the predicted numbers by the Arbon, Hartman, and PRIMA prediction models. These 3 models were used because they were created to predict patient presentations and because of the fact they are generally applicable to various types of MG. Variables and parameters used to predict the number of patient presentations are presented in Table 1 and can be found in extensive detail in the specific publications. Reference Arbon, Bridgewater and Smith16–Reference Spaepen, Haenen and Hubloue18
Sample – Event Model
The Ghent Festivities are annually organized for 10 days in the city center of Ghent, Belgium. What began in 1843 as a folk festival and fair grew into Europe’s largest public cultural festival. The Ghent Festivities start on the third Friday of July and always include the Belgian national holiday (July 21). The Festivities have always been free of charge, attracting a broad and diverse audience, from young families, older people, and target-oriented visitors, to atmosphere seekers. Reference Gentse12 Daily events start at noon, with events sometimes lasting for up to 17 hours (from 12 PM till 5 AM). Due to Belgium’s temperate sea climate, the Ghent Festivities usually have mild summer days. Combined with its multifaceted profile, it attracts over 100000 attendees daily.
As shown in Figure 1, the Festivities area is spread across 765000m 2 . Reference Gentse12 This area, in the historical city center, comprises approximately 18751 inhabitants, while Ghent has around 264483 inhabitants. 21 There are no hospitals inside the Festivities perimeter, although 1 is within walking distance of the MG event zone. Within the festival site, there are 3 first-aid stations operated by the Belgian Red Cross Flanders. Of these first-aid stations, 2 are located approximately 500 meters from each other. The third first-aid station is situated 1 kilometer south, at the most remote festival site. In all 3 first-aid posts, BLS-crew ambulances are stationed providing BLS within the MG event zone.
Map of the Ghent Festivities area.

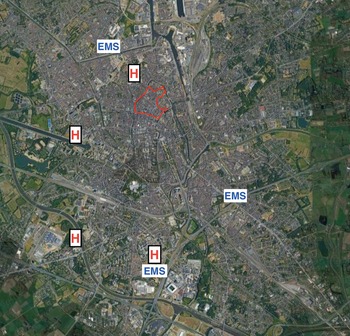
Ghent has 4 hospitals, 3 level-2 hospitals, and 1 university hospital (Figure 2). Regular EMS, providing BLS, is organized by the firefighting service, the university hospital, and a privately-owned company, all under the supervision of the Belgian FPS HFCSE. Among Ghent’s hospitals, 3 provide Advanced Life Support (ALS) crews in regular EMS (mobile medical teams staffed by an emergency physician and nurse).
Map of Ghent region containing hospitals and EMS stations.

During the festivities, all data were gathered for the previous 24 hours and were discussed within a daily municipal inter-agency safety council. This municipal inter-agency safety council includes the municipal government, municipal firefighting services, local office of the federal health government, municipal police department, municipal services (e.g., waste management, logistics, and technical support), the chief executive of the Ghent Festivities organizing committee, and municipal communication officers.
The Royal Meteorological Institute of Belgium provided weather information. Data on the number of attendees at this unbounded and non-ticketed festival were estimations obtained through the Ghent police department and the Ghent municipal firefighting service. Population variables such as PPR, Event Population (NEV: the number of people attending the event – including attendees, spectators, workforce, volunteers, etc.), Reference Lund, Turris and Bowles5 and Host Community (NHC: the total population of the host community or communities on a non-event day), Reference Lund, Turris and Bowles5 were calculated as described by Lund and Turris. Reference Lund, Turris and Bowles5,Reference Turris, Lund and Hutton22
Statistical analysis
Data were entered into a Microsoft Excel 2016 spreadsheet (Microsoft Corporation, Richmond, Virginia, USA). Statistical analysis included means and medians (as the most resistant statistic) and interquartile ranges. As the data is not normally distributed, non-parametric methods were chosen to analyze our results. Spearman correlations and non-parametric and related samples test (Wilcoxon Matched-Pairs Signed Rank Test) for comparison of the median from deviations in predictions of patient presentations were performed using GraphPad Prism version 8.4.1 for Windows (GraphPad Software, La Jolla, California, USA). Intraclass correlations and multivariate regression analysis were performed using SPSS version 23 (IBM Corp., Armonk, New York, USA). Confidence interval levels were set at 95%, and results were deemed statistically significant if P < 0.05.
Results
The total number of event days included in this study was 70 (10 days during July between 2013 and 2019). The total number of attendees was 8673000. The total average attendance per day of the Festivities was 123900 (median 116500; range 80000, 200000). The total number of patient presentations during these events was 9146. The highest number of patient presentations on an event day was 213, with a daily mean of 130.72 presentations (range 56.0, 213), 95% CI [123.3, 138]. The mean PPR was 1.05 patients/1000 attendees, 95% CI [1.007, 1.17]. The highest PPR for a single event day was 2.56 patients /1000 attendees and was recorded during Belgium’s warmest day ever recorded (39.9°C).
Crowd size
The daily attendance averaged 123900, 95% CI [117.1, 130.7]. A poor positive correlation between daily attendance and patient presentation was noted (r s = 0.271, 95% BCa CI [−0.002, 0.471], P = 0.023) (Figure 3), but a low negative inverse relationship was noted between daily attendance and PPR (r s = −0.381, 95% BCa CI [−0.570, −0.154], P = 0.0011).
Comparison of daily attendance with PPR.

The event-to-host-population (EHP) ratio was calculated to quantify the event’s impact on the host population. As described by Turris, Reference Arnold23 the number of people attending the event (NEV) was divided by the number of people in the host community (NHC). There was an average EHP ratio of 6.61 (range: 4.27 – 10.67), meaning the event’s size exceeds the host community’s standard medical response capacity.
Weather
The average temperature for the event days was 24.96°Celsius (range 17.0°C – 39.9°C), 95% CI [24.06, 25.86]. The average humidity was 67.54%, 95% CI [64.32, 70.77]. There was a low positive correlation between the daily temperature and the number of patients presented at IEHS (r s = 0.302, 95% BCa CI [0.0653, 0.5069], P = 0.0110 (Figure 4). A similar low positive relationship was found between daily temperature and PPR (r s = 0.4191, 95% BCa CI [0.1974, 0.6000], P = 0.0003). A low negative correlation was found between humidity and PPR (r s = −0.3289, 95% BCa CI [−0.5285, −0.0947], P = 0.0054. There was no significant relationship between humidity and attendance.
Comparison of the daily temperature and patient presentations.

Day of the week
The highest levels of attendance and patient presentations at IEHS were noted on Saturdays with a mean attendance of 148000 and a mean number of patient presentations of 138.2, 95% CIs [131.6, 164.6], [128.8, 153.6], respectively. However, the highest number of patient presentations was on average on Sundays (123.9, 95% CI [1.06, 1.42]). Mondays had, on average, the lowest level of attendance (98.130, 95% CI [88.66, 107.6], but this did not yield the lowest mean patients presentations as this was noted on Fridays (123.1, 95% CI [95.40, 150.8]) with the lowest mean PPR reported on Saturdays (0.932, 95% CI [0.83, 1.03]). No significant variation was observed between weekdays and weekend days.
Over- or underprediction of the models
The Arbon model underpredicted the number of patient presentations for 54 event days (77.14%) with a mean number of underprediction of 41.36, 95% CI [36.34, 46.37]. On 16 occasions (22.86%), the Arbon model overpredicted the number of patient presentations with a mean number of overprediction of 25.39, 95% CI [21.59, 29.19]. It has a median in deviations in predictions of patient presentations of 19.26 (IQR: 4.23, 47.06).
The Hartman model underpredicted the number of patient presentations for 67 event days (95.71%) with a mean number of underprediction of 62.72, 95% CI [58.34, 67.10]. On 3 occasions (4.29%), the Hartman model overpredicted the number of patient presentations with a mean number of overprediction of 8.67, 95% CI [7.71, 9.62]. It has a median in deviations in predictions of patient presentations of 63.5 (IQR: 39.75, 79.5).
The PRIMA model underpredicted the number of patient presentations for none of the event days. For all of the 70 occasions (100 %), the PRIMA model overpredicted the number of patient presentations with a mean number of overprediction of 238.93, 95% CI [227.53, 250.33]. It has a median in deviations in predictions of patient presentations of −238.5 (IQR: −282.75, −191.75).
When comparing deviations in predictions between the PRIMA model to the Arbon model, there is a significant difference in the mean deviation of the Arbon model (Mdn = 19.26; IQR: 4.23, 47.06) than the PRIMA model (Mdn = −238.5; IQR: −282.75, −191.75), T = 0.000, P < 0.0001, r = −0.8701. Similarly, the difference in mean deviation in predictions between the Hartman model (Mdn = 63.5; IQR: 39.75, 79.5) and the PRIMA model (Mdn = 238.5; IQR: −282.75, −191.75) is significant, T = 0.000, P < 0.0001, r = −0.869.
Discussion
This study aimed to compare the actual number of patient presentations from this annual MG with the predicted number of patient presentations provided by the 3 models to validate the PRIMA model. When comparing the Arbon, Hartman, and PRIMA model predictions, there were significant differences between the predicted number of patient presentations and actual patient presentations. The PRIMA model overestimated the number of patient presentations for each occasion, whereas the other models had a high underprediction rate. The Arbon model underestimated the number of patient presentations for 77.14% of the events, and the Hartman model underestimated the number of patient presentations for 95.71% of the events.
These high rates of underprediction bring an essential issue to the discussion. When models continuously underestimate the number of potential patient presentations, this underestimation of risk (type II risk) could lead to severe events when these events are falsely predicted not to happen. Reference Arnold23 Continuous overprediction, like the PRIMA model, is not good either as it brings additional costs for the event organizers because of the higher numbers of IEHS. However, it allows for another service at the event site and allows for an immediate medical response should a mass casualty incident occur.
An explanation for the differences in accuracy of prediction between the 3 prediction models could be a general lack of data resulting in a lack of validation of the models above. There is too much inconsistent data collection within MG literature, hampering meta-analysis and preventing further prediction modeling and validation.
When comparing the PPR of the events in our study, a mean PPR of 1.05 patients/1000 attendees were found. This number is entirely in line with previous studies. Reference Anikeeva, Arbon and Zeitz24,Reference Crabtree, Mo and Ong25 When comparing the predicted number of patient presentations, both the Arbon and the Hartman model had reasonable differences in mean deviation in predicting the patient presentations. However, the PRIMA model had a significant difference in the mean deviation of the predicted patient presentations because of the continuous overprediction. This result is contrary to a previous study where the PRIMA model had the highest rate of underprediction but successfully predicted the actual number of patient presentations on 2 occasions. Reference Spaepen, Haenen and Hubloue18 A possible explanation for the PRIMA model’s overprediction could be found in the lack of sufficient data to support the PRIMA model when it comes to public cultural festivals. Future studies could enrich the PRIMA calculation model, improving the accuracy of the predictions.
Emphasized in the definition of a MG, events could lead to “a situation during which crowds gather and where there is the potential for a delayed response to emergencies because of the limited access to patients.” Reference Arbon3 With an average EHP ratio of 6.61, the Ghent Festivities exceed the standard medical response capacity of the host community. Having multiple first-aid posts spread across the event site is necessary not to jeopardize or disrupt regular EMS to the host community.
The fact that meteorological variables greatly influence the medical needs at MG is long-established. Reference Milsten, Maguire, Bissell and Seaman6,Reference Milsten, Seaman, Liu, Bissell and Maguire7,Reference Moore, Williamson, Sochor and Brady9,Reference Baird, O’Connor, Williamson, Sojka, Alibertis and Brady26 Specifically, the correlation between daily temperature and humidity on PPR has long been described. Reference Milsten, Maguire, Bissell and Seaman6,Reference Flabouris and Bridgewater27 The findings in this study support this. Relatively high temperatures combined with relatively high humidity resulted in higher PPR. These environmental variables could be worsened by some other conditions such as substance use (e.g., alcohol, illicit drugs) or sunburn. The event organizers can mitigate these effects by raising public awareness, providing places with shadow, and offering adequate free drinking water. During the Ghent Festivities, health officials make sure the event organization takes sufficient preparation and facilitates mitigating the risk factors.
Flabouris and Bridgewater (1996) first described the relationship between the day of the week and patient presentations. Reference Flabouris and Bridgewater27 A positive correlation has again been established. In the present study, a higher number of attendances and higher patient presentations were seen on Saturdays. The explanation for this higher number of patient presentations on weekend days is that during our study period, the organizers amended the Ghent Festivities period. The festivities period now spans 2 weekends leading to an over-representation of weekend days in our dataset. Another explanation could be that more people attend the Festivities during a weekend day combining it with visiting the city center. Furthermore, a more attractive program during the weekend days draws more attendees to free concerts and parties, causing higher alcohol consumption and subsequently higher patient presentation. This influence of the event program on patient presentation was earlier described by Hutton (2017), Reference Hutton and Brown28 and supported this study’s findings.
This study comes with limitations. A first limitation is missing out on the Ghent Festivities attendees who self-refer to a local emergency department, not in Ghent. Missing out on these numbers inevitably leads to a possible underestimation of the number of patient presentations. A second limitation is the lack of data concerning cultural mass gatherings making it challenging to compare results. A third limitation is the general applicability of the PRIMA model. None of the 2 other models used in this study have been validated in other countries. Reference Arbon3,Reference Ranse, Hutton, Turris and Lund29,Reference FitzGibbon, Nable and Ayd30 With nearly all literature and both Arbon and Hartman’s model being non-European, the PRIMA model was developed. Reference Spaepen, Haenen and Hubloue18 However, because of the specific Belgian setup, this model’s general applicability to other countries could be limited.
Despite these limitations, this study’s results are sufficiently strong because of the different methodology used by the other models for their predictions. Between the models used, there is a low degree of dependency. Arbon used regression models to develop his model. Reference Arbon, Bridgewater and Smith16 The Hartman model stratifies events using a scoring system based on characteristics known to influence medical needs. Reference Hartman, Williamson and Sojka17 The PRIMA model is based on a calculation model with data provided by the Belgian FPS HFCSE, event organizers, IEHS, and municipalities. Reference Spaepen, Haenen and Hubloue18
Conclusion
Despite recent developments in mass gathering medicine predicting the number of potential patient presentations remains complex as each unique event has its characteristics that influence medical resource usage. With the PRIMA model developed for a broad range of MG, Reference Spaepen, Haenen and Hubloue18 this study focused on validating the PRIMA model for public cultural MG.
When comparing the Arbon, Hartman, and PRIMA model predictions, there were significant differences between the predicted number of patient presentations and actual patient presentations. Despite the differences between all 3 models’ predictions, our results provide a strong argument that the PRIMA model is a valid tool to predict patient presentations to IEHS during public cultural MG. However, to substantiate the PRIMA model even further, more research is needed further to validate the model for a broad range of MG.
Regardless of the limitations aforementioned, the results of this study are consistent with previous publications in mass gathering medicine. They suggest that the PRIMA model could be another step closer to making predictions for the level and amount of staffing needed at a MG, less enigmatic and more based on science. Future studies focusing on predicting the number of patients presenting to IEHS during MG should help ease MG’s potential burden on the host community and mitigate the potential for a delayed response to emergencies because of the limited access to patients.
Acknowledgements
The authors would like to thank C De Mey for his contribution to data gathering and Mrs. I Haeyen for her English language editing.
Ethics statement
The medical ethics committee of Vrije Universiteit Brussel approved the study (B1432020000137).