Introduction
Patulous Eustachian tube cases present with breathing or voice autophony and aural fullness caused by incomplete closure of the Eustachian tube.Reference Schilder, Bhutta, Butler, Holy, Levine and Kvaerner1,Reference Kobayashi, Morita, Yoshioka, Mizuta, Ohta and Kikuchi2 Symptoms may be improved by change in supine or lordotic posture, sniffing or upper respiratory tract infection.Reference Kobayashi, Morita, Yoshioka, Mizuta, Ohta and Kikuchi2,Reference Adil and Poe3 Patulous Eustachian tube is a relatively rare disorder, and most patients find relief after conservative treatment.Reference Kobayashi, Morita, Yoshioka, Mizuta, Ohta and Kikuchi2,Reference Choi, Kim, Lee, Oh, Lee and Goh4 However, failure of conservative treatments can be frustrating for patients and doctors because of unclear aetiology and treatment protocol.Reference Hussein, Adams and Turner5
The most well-known cause of patulous Eustachian tube is weight loss, which results in loss of Ostmann's fatty tissue surrounding the Eustachian tube.Reference Kobayashi, Morita, Yoshioka, Mizuta, Ohta and Kikuchi2,Reference Yoshida, Takahashi and Morikawa6–Reference Ward, Ashry and Poe9 Estrogenic increases because of pregnancy, hormonal therapy or oral contraception,Reference Yoshida, Takahashi and Morikawa6 mucosal atrophic condition of the nasopharynxReference Poe7, and allergiesReference Ward, Ashry and Poe9,Reference Bluestone10 are reported as associated factors contributing to patulous Eustachian tube cases.
The number of studies on clinical features, pathogenesis, diagnosis and treatment of patulous Eustachian tube is significantly increasing, reflecting the recent interest in this disorder.Reference Kobayashi, Morita, Yoshioka, Mizuta, Ohta and Kikuchi2 However, despite the increasing numbers of studies, there have been no reports of association with climatic factors and seasonality. Analysing the correlation between climatic factors and seasonality of patulous Eustachian tube and considering the causes could provide additional ideas for patulous Eustachian tube research.
Therefore, we investigated the association between climatic factors and seasonality with patulous Eustachian tube cases in Seoul, Korea, using the monthly weather reports of the climatic administration database and the national health insurance database, respectively.
Materials and methods
Data source and study population
Data on the study population were obtained from the national health insurance database operated by the Korean National Health Insurance Service, a government-affiliated agency under the Korean Ministry of Health and Welfare that supervises all medical activities in Korea. National health insurance database data includes personal information, demographic information, medical utilisation or transaction information, and information on patient deduction for Korean citizens who are categorised as insured employees, insured self-employed individuals or medical aid beneficiaries.Reference Lee, Lee, Park, Shin and Kim11
The Korean National Health Insurance Service provides data without individual identifiers according to the privacy laws of public organisations. Therefore, the database contains an unidentifiable code representing each individual. Since the Korean National Health Insurance Service is mandatory for all residents in Korea, the national health insurance database represents the entire Korean population.Reference Song, Jung, Song, Park, Kwon and Cha12
Because the Republic of Korea has four distinct seasons and a narrow territory, it is very advantageous to study the relationship with the climate, and it is also advantageous to analyse the seasonality associated with the number of patulous Eustachian tube cases through the well-established national health insurance database. Although the territory of the Republic of Korea is small, the baseline population and climatic data were confined to Seoul city to minimise bias because of the variation of the climate between cities. Seoul is the capital and largest city of the Republic of Korea and has about 10 million people, which is one fifth of the national population. In addition, because Seoul has great medical accessibility, it was most suitable for this study in terms of both qualitative and quantitative aspects.Reference Kim, Byon and Yeo13
The baseline study population included all insured Koreans residing in Seoul city territories determined by administrative district classification codes. Within the national health insurance database, we retrospectively extracted the monthly number of patients diagnosed with patulous Eustachian tube from January 2010 to December 2016.
Patients who received any medical service at a clinic or hospital with an International Classification of Diseases code-10 of H69.0 were identified as patients with patulous Eustachian tube. Patulous Eustachian tube was confirmed by visualisation of medial and lateral movement of the tympanic membrane coincident with forced breathing in patients with aural symptoms (autophony, ear fullness or hearing of self-generated breathing), which is used as a standard diagnostic method in Korea.
To rule out patulous Eustachian tube caused by weight loss because of cancer, radiotherapy and chemotherapy, patients with any cancer diagnosis with the International Classification of Diseases-10 code ‘C’ were excluded. Personal information was protected and kept anonymous. Climatic data for the same period was obtained online from the monthly weather reports of the climatic administration database of Seoul. Information was obtained from the database for the three parameters used in the analysis: mean monthly temperature, mean monthly atmospheric pressure and mean monthly relative humidity. The seasons were defined as spring (March, April, May), summer (June, July, August), autumn (September, October, November) and winter (December, January, February). This study was approved by the institutional review board of our hospital (approval number: H-1612-012-050).
Statistical analysis
We analysed the data from patients with patulous Eustachian tube and climatic factors in Seoul from January 2010 to December 2016. The monthly average number of patients and value of three climatic factors (temperature, atmospheric pressure and relative humidity) were evaluated for correlations. We used a Poisson regression model to analyse relative risk associated with cases of patulous Eustachian tube with a 95 per cent confidence interval (CI). A p-value of less than 0.05 was considered significant. The relationship between climatic factors and patulous Eustachian tube was analysed by cross-correlation analysis between time lag using a cross-correlation coefficient. The values that determined significance level were as follows:
 $$\vert {r( k ) } \vert > \displaystyle{{1.96} \over {\sqrt {n-\vert k \vert } }}\;\;$$
where ‘r’ was the cross-correlation coefficient, ‘n’ was observations (12 months × 7 years = 84) and ‘k’ was the time lag (months). The closer the r value was to 1 or –1, the stronger the positive or negative correlation, and 0 indicated no correlation. All statistical analyses were performed using R programming language (version 3.5.0; R Foundation for Statistical Computing, Vienna, Austria).
Results
The monthly number of patients with patulous Eustachian tube in Seoul during the seven years included in the study is visualised as a line graph (Figure 1). The number of patulous Eustachian tube patients increased each year, and changes in the number of patulous Eustachian tube cases according to the changing seasons repeated every year. Figure 1b shows the average yearly number of patulous Eustachian tube cases per month. In Poisson regression analysis, the number of patulous Eustachian tube patients increased significantly according to monthly and seasonal changes. The relative risk for patulous Eustachian tube in each month between July and October was more than 40 per cent higher compared with the risk during January (relative risk (95 per cent CI): 1.134 (1.028–1.251), 1.161 (1.053–1.280), 1.176 (1.067–1.2197), 1.578 (1.440–1.729), 1.723 (1.575–1.886), 1.503 (1.370–1.648), 1.446 (1.318–1.586) and 1.151 (1.045–1.269) for March, May, June, July, August, September, October and November, respectively (Table 1)). The relative risk for the season was significantly higher in summer and autumn and lower in winter than in spring (relative risk (95 per cent CI): 1.334 (1.267–1.404), 1.219 (1.157–1.285) and 0.889 (0.840–0.941) for summer, autumn and winter, respectively (Table 1)).
Line graph showing monthly number of patulous Eustachian tube patients in Seoul, Korea. (a) The monthly number of patulous Eustachian tube patients for 7 years shows seasonality. (b) The average yearly number of patulous Eustachian tube patients per month was highest in August and lowest in February. The black line represents the number of patients counted annually for 7 years in the corresponding month and the blue line represents the average of them.

Poisson regression analysis of the monthly and seasonal number of patulous Eustachian tube patients

CI = confidence interval. *P-value ≤ 0.05; †p-value ≤ 0.01; ‡p-value ≤ 0.001
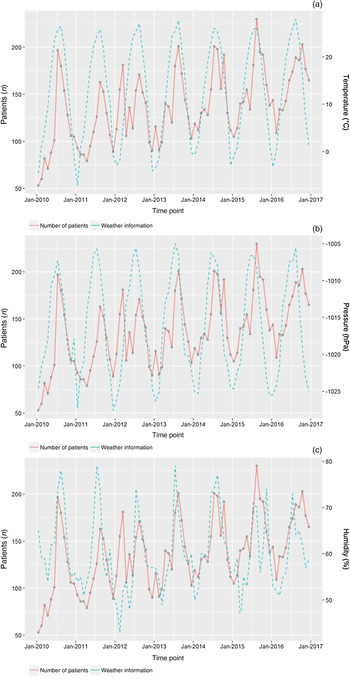
Statistical analyses were performed to assess correlations between changes in monthly patulous Eustachian tube cases and climatic factors (Figures 2 and 3). Temperature and atmospheric pressure were most closely correlated with the number of patients at one-month time lags, and there was moderate positive (r = 0.648) and negative correlation (r = –0.601), respectively. There was strong negative correlation (r = –0.923) between the atmospheric pressure and the temperature. The relative humidity was most closely correlated with the number of patients when there was no time lag, and there was a moderate positive correlation (r = 0.492).
Relationship between the climatic factors of (a) temperature, (b) pressure and (c) humidity and the number of patulous Eustachian tube patients. These time series plots with number of patients and climatic factors show similar patterns. Since the atmospheric pressure has a negative value, the graph of the atmospheric pressure was inverted for visual match. Jan = January

Cross-correlation plots between the climatic factors and the number of patulous Eustachian tube patients. The temperature (a) and atmospheric pressure (b) most correlated with the number of patulous Eustachian tube patients at the one-month time lag, and there was a moderate positive (r = 0.648) and negative correlation (r = −0.601), respectively. The relative humidity (c) was most closely correlated with the number of patients when there was no time lag, and there was a moderate positive correlation (r = 0.492).

Discussion
In this study, we aimed to determine if any correlations existed between patulous Eustachian tube cases and changes in the climatic factors of temperature, atmospheric pressure and relative humidity on a monthly and seasonal basis. Our results show that the number of patulous Eustachian tube diagnoses was highest in summer, and temperature had the most significant positive correlation on the number of patulous Eustachian tube cases. The relative humidity showed a moderate positive correlation and the atmospheric pressure showed a moderate negative correlation with the number of patulous Eustachian tube cases. However, since atmospheric pressure has a very strong negative correlation with temperature, the effect of atmospheric pressure on the number of patulous Eustachian tube diagnoses seems to depend on the temperature variable.
As mentioned in the introduction, there are many factors associated with patulous Eustachian tube, but it is not clear why the number of patulous Eustachian tube cases increases in summer.Reference Kobayashi, Morita, Yoshioka, Mizuta, Ohta and Kikuchi2,Reference Yoshida, Takahashi and Morikawa6–Reference Bluestone10 Temperature, relative humidity and atmospheric pressure are affected by geographical characteristics. The climate in Korea is cold and dry in winter because of high pressure from Siberia and hot and humid in summer because of high pressure from the North Pacific. It is affected not only by seasonal winds but also by monsoons and typhoons, and more than half of the annual precipitation is concentrated in summer.Reference Chung, Yoon and Kim14 More so than geographic features, we speculate that weight loss, which is the most direct cause of patulous Eustachian tube, and dehydration, which is common in the summer, may offer an explanation for seasonal changes in patulous Eustachian tube cases. Seasonal changes in body weight are related to the physiological changes of the body as a result of temperature as well as socio-cultural factors, such as pressure to lose weight in the summer.
In addition, the thermal environment has a significant impact on dietary intake and energy consumption. The thermoneutral zone represents an ambient temperature range that does not affect metabolic heat production or evaporative heat loss and is approximately 23.0°C for humans.Reference Yang, Han, Cho, Yoon, Cha and Lee15,Reference Yokoya and Higuchi16 If the ambient temperature is lower than the thermoneutral zone, energy consumption increases to maintain body temperature, and appetite and caloric intake increase compensatorily.Reference Westerterp-Plantenga, van Marken Lichtenbelt, Strobbe and Schrauwen17 Meanwhile, if the ambient temperature is higher than the thermoneutral zone, inhibition of heat loss and suppression of appetite and caloric intake initiates weight loss.Reference Yokoya and Higuchi16,Reference Stanojevic, Kain and Uauy18 However, impact of ambient temperature on body weight is gradual and affected by behavioural factors such as wearing appropriate clothing, amount of outdoor activity, indoor temperatures and socio-cultural factors related to the seasons of the country.
Short-term weight loss is one of the most common causes of patulous Eustachian tube, and it is usually a result of effort to lose weight. This is a socio-cultural factor, and the seasonal trend of losing weight may vary from country to country. Jung et al. collected keywords on diet from the largest internet portal site in Korea and performed tendency and network analysis of the collected data. Analysis of seasonal trends showed that the monthly frequency of key words related to diet was lowest in February and highest in July.Reference Jung and Chang19,Reference Jung and Chang20 It showed similar graph patterns to the seasonality of patulous Eustachian tube patient numbers in our study. Moreover, Pack reported that clothing becomes thinner and reveals the body more as the weather gets warmer, and attempts to lose weight actively increase in Korea.Reference Pack21 These reports strongly support the relationship between the effort of losing weight and the seasonality of patulous Eustachian tube.
Dehydration is a short-term effect, but it is one of the causes that explains the increasing number of patulous Eustachian tube patients in the summer. Dehydration is associated with sweat production and level of physical activity. The production of sweat is an important regulatory function in high temperatures, and the sweat produced evaporates and lowers the body temperature. Humidity also plays an important role, and mass transfer limitations prevent sweat from evaporating in a humid environment. This causes dehydration due to persistent temperature rise and sweat production.Reference Campbell, Nair, Miles and Webbon22 However, in buildings with controlled environmental variables, the effect of dehydration due to hot and humid conditions is reduced, even in summer. Therefore, the seasonal variation of physical activity is important, and many studies have reported on this aspect. Tucker et al. reported in a systemic review article that the level of physical activity was higher in summer than winter.Reference Tucker and Gilliland23 This also may contribute to the increase in the number of patulous Eustachian tube patients in summer.
In addition to the monthly variation, we found that the number of patulous Eustachian tube patients in Seoul is increasing year on year. This can be confirmed from a population-based study by Choi et al. using the Korean national health insurance database, which reported that the prevalence of patulous Eustachian tube in Korea increased annually by 6.73 per cent.Reference Choi, Kim, Lee, Oh, Lee and Goh4 Ward et al. reported environmental allergies, laryngopharyngeal reflux disease, stress and anxiety as novel comorbidities with a high prevalence in patients with patulous Eustachian tube.Reference Ward, Ashry and Poe9 Based on this, Choi et al. explained that the increase in allergic diseases and reflux diseases may be associated with the increase in patulous Eustachian tube.Reference Choi, Kim, Lee, Oh, Lee and Goh4 However, the number of allergic disease patients is lowest in summer and increases in spring and autumn in Korea, which contradicts our result that the number of patulous Eustachian tube patients is highest in summer.Reference Kim JS, Kim and Lim24 This suggests that the association between allergies and patulous Eustachian tube should be carefully approached, and it could be determined through extracting and analysing the monthly number of patients with known comorbidities using the national health insurance database in future studies. Meanwhile, Jung and Chang reported that the number of searched diet-related keywords on portal sites doubled in 2015 compared with that in 2010.Reference Jung and Chang19 It is also worth considering the possibility that this increased interest in health and appearance has led to a substantial increase in the population attempting rapid weight loss.
• Relative risk for patulous Eustachian tube in each month between July and October was more than 40 per cent higher compared with the risk during January
• Relative risk according to season was significantly higher in summer and autumn, and lower in winter than in spring
• Temperature, atmospheric pressure and relative humidity had a moderate positive, negative and positive correlation with patulous Eustachian tube cases, respectively
There are a few limitations to this study that should be considered. Firstly, it would have been ideal to have monthly body mass index data to enhance the research results, but this was practically impossible because of the lack of body mass index data in the national health insurance database. Thus, we indirectly estimated associations based on previous studies about seasonal trends in weight loss. This showed a pattern almost identical to the monthly frequency of key words related to diet shown in the study by Jung and Chang.Reference Jung and Chang19 Secondly, we lacked data on sex and age. The purpose of this study was not to take this into account, so we used data excluding sex and age from Korean National Health Insurance Service. However, Choi et al. reported that females in their twenties account for more than 20 per cent of the incidence and prevalence of patulous Eustachian tube.Reference Choi, Kim, Lee, Oh, Lee and Goh4 Monthly data on the sex and age of the patients would have derived interesting results, allowing us to analyse the range of fluctuation according to these variables. Thus, we will pursue this direction through further study. Third, there may be differences between the time of diagnosis and the time of symptom onset. With a low-cost national insurance system in Korea and a high concentration of medical institutions in Seoul, patients can easily visit an otolaryngologist on the day of symptom onset.Reference Kim, Byon and Yeo13 For this reason, this study was confined to the population of Seoul city only. However, depending on the individual, some patients may have visited days or weeks after symptom presentation. Big data can partially compensate for the bias caused by these outliers, but multi-centre research is needed in the future to draw more elaborate conclusions.
Despite these limitations, this study demonstrated the seasonality of patulous Eustachian tube and correlation with climatic factors, which have never been reported before. If the limitations presented above are overcome through a large-scale population-based cohort study, it will be able to elicit the causal relationship more accurately. In addition, analysing the proportion of causes that have been estimated so far could be helpful for treatment-related research.
Through this study, we showed the seasonality and association of patulous Eustachian tube with climatic factors. The number of patients was highest in summer and increased in proportion to temperature and humidity. It is assumed that this is because of the physiological changes of the body caused by the climatic factors or by trends in diet. We hope that this study will be useful for future studies in evaluating the causes of patulous Eustachian tube.
Acknowledgements
This work was supported by the Basic Science Research Program through the National Research Foundation of Korea, funded by the Ministry of Education (NRF-2018R1D1A1B07048778) and Department of Biostatistics, Biomedical Research Institute, Pusan National University Hospital. We would like to thank Editage (www.editage.co.kr) for UK English language editing.
Competing interests
None declared