Introduction
The Kalahari Red (KR) goat is native to South Africa. It was developed mainly for meat production (Kotze et al., Reference Kotze, Swart, Grobbler and Nemaangani2004; Simela and Merkel, Reference Simela and Merkel2008). There are two lines of KR goats; one line was developed from red-head Boer goats, whereas the other line was developed from unimproved indigenous goats (Campbell, Reference Campbell2003). There are further indications that the KR was a product of natural selection over a period of 20 years from unimproved indigenous goats kept by goat farmers in the Northern Cape Province and the Namibian part of the Kalahari Desert. The indigenous goats arrived in South Africa and Namibia along with the migrating tribes that traditionally kept goats (South African Indigenous Breeds. http://www.indigenousbreeds.co.za/indigenousbreeds/goat/kalahari). They feed on a vast variety of plants and are resistant to diseases and parasites and the need to be inoculated is far less than other breeds (Stonehaven, 2011). The breed has been well adapted to the arid and semi-arid savannah with good foraging and excellent mothering abilities, hence regarded as “minimum care/maximum profit” breed (Ramsay, Harris and Kotze, Reference Ramsay, Harris and Kotze2001). They are tall (54.05 cm) and long (69.8 cm) (Pieters et al., Reference Pieters, Marle-Koster, Visser and Kotze2009), which gives them excellent mobility. Their earthy (red) colour provides good camouflage that protects them from predators. Age at first breeding is 6 months, average birth weight is 2.5 kg and kids grow fast with mature buck weighing 115 kg while doe reach 75 kg (South African Indigenous Breeds. http://www.indigenousbreeds.co.za/indigenousbreeds/goat/kalahari). They are often used in cross-breeding to produce goats with uniform, solid, red colour and they have ability to kid three times in 2 years (Pieters et al., Reference Pieters, Marle-Koster, Visser and Kotze2009). According to Hauck (Reference Hauck2014) (http://www.ramhbreeders.com/red), Australia has millions of feral goats that were seen as pests in the past but have brought in the KR goats because of its hardiness, earthen red colour and productivity. Currently, the Australian feral goats are being crossed with the KR goats by farmers to improve productiveness and hardiness which have greatly boosted the goat production industry, increasing the export of chevron to 82 percent. In the RAM H farm, according to the latter author, the purebred KR goat is more expensive than the other traditional breeds in Canada due to their limited supply and market demand. The erosion of KR with red Boar goats of South Africa, as noted by Kotze et al. (Reference Kotze, Swart, Grobbler and Nemaangani2004) is a major concern among livestock breeders; little empirical information is available with no comprehensive system of monitoring special characteristics.
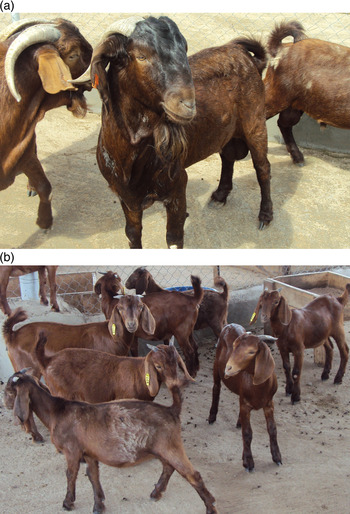
The KR goat was imported into Nigeria in 2011 by the Federal University of Agriculture, Abeokuta, Nigeria (Figures 1 and 2). Evaluation of genetic diversity in the breed will further give insight about the prospect of achieving genetic progress from selection programmes and/or cross-breeding with other local goat populations. Genetic diversity studies based on microsatellite loci have been reported for the KR breed (Kotze et al., Reference Kotze, Swart, Grobbler and Nemaangani2004; Visser et al., Reference Visser, Hefer, Marle-Koster and Kotze2004). Microsatellite loci studied were polymorphic as indicated by moderate to high number of alleles per locus and high polymorphism information content values. There is however paucity of information on analysis of mitochondrial DNA (mtDNA) marker-based genetic diversity of the breed under consideration. mtDNA is also favoured as a marker of choice because it is maternally inherited, has high mutation rate and copy number and lacks recombination unlike autosomal or X-chromosome-specific loci (Pereira, Carneiro and Asch, Reference Pereira, Carneiro and Asch2010). Many studies on different goat populations around the world have focused on analysis of the hypervariable (HV1) region of mitochondrial D-loop (Luikart et al., Reference Luikart, Gielly, Excoffier, Vigne, Bouvet and Taberlet2001; Fan et al., Reference Fan, Chen, Kijas, Liu, Yu, Zhao, Zhu, Xiong and Li2007; Naderi et al., Reference Naderi, Rezaei, Taberlet, Zundel, Rafat, Naghash, el-Barody, Ertugrul and Pompanon2007, Reference Naderi, Rezaei, Pompanon, Blum, Negrini, Naghash, Balkiz, Mashkour, Gaggiotti, Ajmone-Marsan, Kence, Vigne and Taberlet2008; Wang et al., Reference Wang, Chen, Wang and Yang2008; Amills et al., Reference Amills, Ramírez, Tomàs, Badaoui, Marmi, Acosta, Sànchez and Capote2009; Groeneveld et al., Reference Groeneveld, Lenstra, Eding, Toro, Scherf, Pilling, Negrini, Finlay, Jianlin, Groeneveld and Weigend2010; Han et al., Reference Han, Yu, Cai, Shi, Zhu and Zhou2010; Benjelloun et al., Reference Benjelloun, Pompanon, Ben Bati, Chentouf, Ibnelbachyr, El Amiri, Rioux, Boulanouar and Taberlet2011; Cinar Kul and Okan, Reference Cinar Kul and Okan2011; Zhao et al., Reference Zhao, Zhang, Zhao, Zhang, Liu and Zhang2011; Martínez et al., Reference Martínez, Ferrando, Manunza, Gómez, Landi, Jordana, Capote, Badaoui, Vidal, Delgado and Amills2012; Lin et al., Reference Lin, Odahara, Ishida, Kato, Sasazaki, Nozawa and Mannen2013). Apart from very high haplotype diversities reported by most of the authors, the weak phylogeographic structure among different populations was also observed (Luikart et al., Reference Luikart, Gielly, Excoffier, Vigne, Bouvet and Taberlet2001; Fan et al., Reference Fan, Chen, Kijas, Liu, Yu, Zhao, Zhu, Xiong and Li2007; Naderi et al., Reference Naderi, Rezaei, Taberlet, Zundel, Rafat, Naghash, el-Barody, Ertugrul and Pompanon2007, Reference Naderi, Rezaei, Pompanon, Blum, Negrini, Naghash, Balkiz, Mashkour, Gaggiotti, Ajmone-Marsan, Kence, Vigne and Taberlet2008; Amills et al., Reference Amills, Ramírez, Tomàs, Badaoui, Marmi, Acosta, Sànchez and Capote2009; Benjelloun et al., Reference Benjelloun, Pompanon, Ben Bati, Chentouf, Ibnelbachyr, El Amiri, Rioux, Boulanouar and Taberlet2011; Zhao et al., Reference Zhao, Zhang, Zhao, Zhang, Liu and Zhang2011). Insignificant geographic structuring was mainly attributed to worldwide distribution of dominant A haplogroup, which included more than 90 percent of individuals among other haplogroups (B, B1, B2, C, D, F and G) reported (Naderi et al., Reference Naderi, Rezaei, Taberlet, Zundel, Rafat, Naghash, el-Barody, Ertugrul and Pompanon2007). Owing to paucity of information on the KR breed, this study was designed to investigate the genetic diversity, maternal lineages and relationship with wild ancestors, as well as infer the demographic history of the population through analysis of mtDNA.
(a) KR bucks at the Federal University of Agriculture, Abeokuta. (b) KR weaners (females) born at the Federal University of Agriculture, Abeokuta.

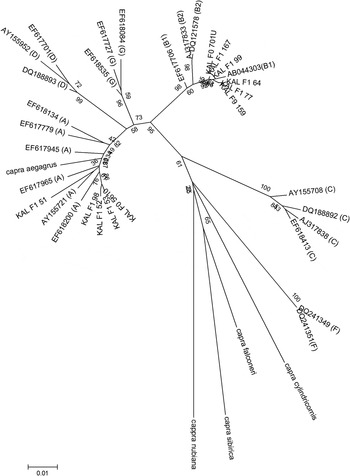
Tree topology obtained with ML phylogenetic method for 11 haplotypes and 22 reference haplotypes along with five sequences from wild goats included as out groups. Codes starting with two letters represent GeneBank Accession numbers of the 22 reference sequences. Other codes starting with KAL correspond to haplotypes belonging to the KR goat. Numbers at major clades represent bootstrap percentages computed after 1 000 replications.

Materials and methods
Blood sample collection and DNA extraction
Blood samples were collected from 38 KR goats semi-intensively managed at the Federal University of Agriculture, Abeokuta (FUNAAB), Nigeria. Figure 1a and b represent Kalahari bucks and does, respectively, maintained at the farm. To represent the genetic diversity in breed, samples were randomly drawn from unrelated individuals of the parent stock imported from South Africa, excluding offsprings born at the farm of the University's Research Institute (Institute of Food Security, Environmental Resources and Agricultural Research (IFSERAR)). The blood samples were collected from the jugular vein of the goat directly onto Whatman FTA Classic cards (Whatman Bio Science, Maidstone, UK) and allowed them to dry for 1 h at room temperature and stored until DNA extraction was carried out using standard commercial kits according to manufacturer's instructions.
Polymerase chain reaction (PCR) amplification and sequencing
The HV1 region of mtDNA D-loop was amplified and sequenced in the STABVIDA laboratory, Portugal. The primers CAP-F (5′-CGTGTATGCAAGTACATTAC-3′) and CAP-R (5′-CTGATTAGTCATTAGTCCATC-3′) were used to amplify a 579-bp DNA fragment. The PCR-cycling protocol by Luikart et al. (Reference Luikart, Gielly, Excoffier, Vigne, Bouvet and Taberlet2001) was adopted. A 481 bp segment of the PCR products was sequenced. PCR amplifications were conducted in a 25-μl volume containing 2.5 mM MgCl2, 200 µM of each dNTP, 1 µM of each primer and 1 unit of AmpliTaq Gold Polymerase (Applied Biosystems). The PCR mixture underwent 35 cycles of 30 s at 95 °C, 30 s at 50 °C and 1 min at 72 °C. PCR products were purified using the Quaquick PCR columns (Qiagen). A 481-bp segment of the PCR products was sequenced using two “internal” primers CAP-FI (5′-TCCATATAACGCGGACATAC-3′) and CAP-RI (5′ATGGCCCTGAAGAAAGAAC-3′). All sequences were obtained for both DNA strands using the ABI PRISM Dye Terminator Cycle Sequencing Ready Reaction Kit (Applied Biosystems) in a 20-μl volume containing 40–50 ng of purified DNA and 3.2 pmol of primer. Sequencing reactions underwent 25 cycles of 30 s at 96 °C, 30 s at 58 °C and 4 min at 72 °C on a thermocycler (PE 2400, PE 9600 or PE 9700; Perkin–Elmer). Excess dye terminators were removed by spin-column purification. Sequencing reactions were electrophoresed for 6 h on an ABI 3700 PRISM DNA sequencer (Applied Biosystems) in a 5 percent Long Ranger gel (FMC). All sequences were deposited in the GenBank with accession numbers: KJ466263–KJ466273.
Data analyses
Genetic diversities and phylogenetic analyses were carried out using a 453 bp region shared by 38 mitochondrial sequences in the present study and 22 reference sequences retrieved from GeneBank (Naderi et al., Reference Naderi, Rezaei, Taberlet, Zundel, Rafat, Naghash, el-Barody, Ertugrul and Pompanon2007) representing the diversity of six haplogroups (A, B, C, D, F and G) found worldwide. ChromasPro 1.7.5 (http://www.technelysium.com.au/ChromaSpro.html) was used for viewing and editing of the sequences. Multiple alignments of the sequences were performed using Clustal W in MEGA 5.2.2 (Tamura et al., Reference Tamura, Peterson, Peterson, Stecher, Nei and Kumar2011). The polymorphisms in the analysed regions, nucleotide diversity (π) and haplotype diversity (h) were estimated using DnaSP v5.10.01 software (Librado and Rozas, Reference Librado and Rozas2009). Maximum-likelihood (ML) tree was created with MEGA 5.2.2 software (Tamura et al., Reference Tamura, Peterson, Peterson, Stecher, Nei and Kumar2011) to classify the population into maternal lineages according to the reference sequences with accession numbers (AY155721), (EF618134), (EF617779), (EF618200), (EF617945), (EF617965), (ABO44303), (EF617706), (AJ317833), (DQ121578), (AY155708), (AJ317833), (EF618413), (DQ188892), (AY155992), (EF617701), (DQ188893), (DQ241349), (DQ241351), (EF618084), (EF618535) and (EF617727) (Naderi et al., Reference Naderi, Rezaei, Taberlet, Zundel, Rafat, Naghash, el-Barody, Ertugrul and Pompanon2007). Reliability of the phylogenetic tree was assessed using bootstrap percentages computed after 1 000 replications. The D-loop region sequences of Capra aegagrus (EF989163) (Naderi et al., Reference Naderi, Rezaei, Pompanon, Blum, Negrini, Naghash, Balkiz, Mashkour, Gaggiotti, Ajmone-Marsan, Kence, Vigne and Taberlet2008), Capra caucasica (AJ317875), Capra sibirica (AJ317874), Capra cylindricornis (AJ317870), Capra nubiana (AJ317871) and Capra falconeri (AJ317872) (Luikart et al., Reference Luikart, Gielly, Excoffier, Vigne, Bouvet and Taberlet2001) were also included as out groups to ascertain relationship of KR with wild goats. Two different approaches were used to examine traces of population expansion. Fu's F s statistic (Fu, Reference Fu1997) as well as Tajima's D estimate were obtained with DnaSP v5.10.01 (Librado and Rozas, Reference Librado and Rozas2009). Mismatch distributions (pairwise sequence-difference distributions) for the population were also carried out to test departures from the null hypothesis of a constant population size under the neutral model.
Results and discussion
Sequence diversity
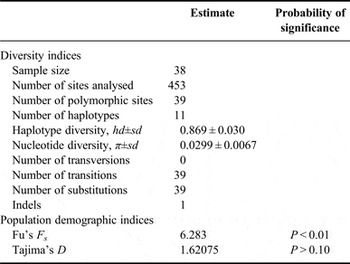
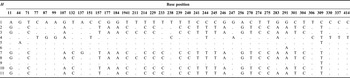
The HV1 sequences from the KR breed were highly polymorphic (Table 1). Most mutations were single nucleotide substitutions including 39 transitions and 39 transversions, with one insertion/deletion detected. The nucleotide changes identified from 38 sequences were grouped into 11 haplotypes (Table 2). The distribution of the haplotypes was such that two groups that were in majority were each represented by nine individuals, whereas other haplotypes had representation ranging from one to five individuals. Haplotype and nucleotide diversities were 0.869 ± 0.030 and 0.0299 ± 0.0067, respectively, which compared favourably with high estimates reported from several studies on different breeds of goats around the world (Luikart et al., Reference Luikart, Gielly, Excoffier, Vigne, Bouvet and Taberlet2001; Naderi et al., Reference Naderi, Rezaei, Taberlet, Zundel, Rafat, Naghash, el-Barody, Ertugrul and Pompanon2007; Wang et al., Reference Wang, Chen, Wang and Yang2008; Amills et al., Reference Amills, Ramírez, Tomàs, Badaoui, Marmi, Acosta, Sànchez and Capote2009; Benjelloun et al., Reference Benjelloun, Pompanon, Ben Bati, Chentouf, Ibnelbachyr, El Amiri, Rioux, Boulanouar and Taberlet2011; Cinar Kul and Okan, Reference Cinar Kul and Okan2011; Zhao et al., Reference Zhao, Zhang, Zhao, Zhang, Liu and Zhang2011). High genetic diversity may partly result from high mutation rate of the control region, multiple maternal wild ancestor (Naderi et al., Reference Naderi, Rezaei, Taberlet, Zundel, Rafat, Naghash, el-Barody, Ertugrul and Pompanon2007) and capture of large part of the wild diversity during domestication (Benjelloun et al., Reference Benjelloun, Pompanon, Ben Bati, Chentouf, Ibnelbachyr, El Amiri, Rioux, Boulanouar and Taberlet2011). Consistent with the current observation, analysis of microsatellite-based genetic diversity of the KR goats similarly showed high genetic polymorphism in terms of high number of alleles and average heterozygosity (Kotze et al., Reference Kotze, Swart, Grobbler and Nemaangani2004; Visser et al., Reference Visser, Hefer, Marle-Koster and Kotze2004).
Diversity indices, Fu's F s and Tajima's D statistics of the KR goat imported into Nigeria.

Mitochondrial HV1 sequence variations among the KR goats.

H, represents haplotypes; Dot (.), represents the identical nucleotide with the type 1 sequence.
Maternal lineages and relationship of goats with wild ancestors
Tree topology (Figure 2) obtained with the ML phylogenetic method for the observed haplotypes (11) and 22 reference sequences (Naderi et al., Reference Naderi, Rezaei, Taberlet, Zundel, Rafat, Naghash, el-Barody, Ertugrul and Pompanon2007) grouped the KR goat population into two distinct mtDNA lineages, A and B. Lineage A had five haplotypes, whereas lineage B had six haplotypes. Lineage A is widely reported in different studies around the world as predominant (Luikart et al., Reference Luikart, Gielly, Excoffier, Vigne, Bouvet and Taberlet2001; Naderi et al., Reference Naderi, Rezaei, Taberlet, Zundel, Rafat, Naghash, el-Barody, Ertugrul and Pompanon2007; Wang et al., Reference Wang, Chen, Wang and Yang2008; Han et al., Reference Han, Yu, Cai, Shi, Zhu and Zhou2010; Benjelloun et al., Reference Benjelloun, Pompanon, Ben Bati, Chentouf, Ibnelbachyr, El Amiri, Rioux, Boulanouar and Taberlet2011; Zhao et al., Reference Zhao, Zhang, Zhao, Zhang, Liu and Zhang2011; Martínez et al., Reference Martínez, Ferrando, Manunza, Gómez, Landi, Jordana, Capote, Badaoui, Vidal, Delgado and Amills2012; Lin et al., Reference Lin, Odahara, Ishida, Kato, Sasazaki, Nozawa and Mannen2013). According to Fan et al. (Reference Fan, Chen, Kijas, Liu, Yu, Zhao, Zhu, Xiong and Li2007), lineage A was possibly derived from Tibetan founders and was further subject to domestication in Northern China, some of them were dispersed to Southern China, whereas others remained. The distribution to other locations has been attributed to human migration.
The B lineage, according to Luikart et al. (Reference Luikart, Gielly, Excoffier, Vigne, Bouvet and Taberlet2001) is mostly found in whole Asia with very few individuals from Sub-Saharan Africa and one European goat from Greece. Since the KR goats were developed from two lines (red-head boar and “unimproved indigenous” goats) (Campbell, Reference Campbell2003), it is not surprising that haplogroups A and B were represented in the breed, thereby supporting the hypothesis of multiple maternal origins (Luikart et al., Reference Luikart, Gielly, Excoffier, Vigne, Bouvet and Taberlet2001). The B lineage is likely to have arisen in Asia, according to the latter authors, while distribution to other locations has been attributed to human migration (Naderi et al., Reference Naderi, Rezaei, Taberlet, Zundel, Rafat, Naghash, el-Barody, Ertugrul and Pompanon2007). Han et al. (Reference Han, Yu, Cai, Shi, Zhu and Zhou2010) further suggested that lineage B, including B1 and B2 probably originated from China, thereby supporting the hypothesis that China may be one of the goat domestication centres. In another study by Lin et al. (Reference Lin, Odahara, Ishida, Kato, Sasazaki, Nozawa and Mannen2013), the frequency of lineage B was higher in mountain areas than in plain areas of Myanmar and Cambodia. In addition, morphological examinations by the latter authors revealed that the frequencies of the Roman profile and pendent ears were significantly higher in plain areas than in mountain areas and a significant correlation was observed between frequency of lineage B and these morphological traits, which are also typical characteristics of the KR breed under consideration. Bezoar-type goat with concave facial profile and prick ear in mountain area has high frequency of lineage B in Southeastern Asia, although the mitochondria lineages are definitely not responsible for the phenotypes (Lin et al., 2012). Generally, haplogroups B, C, D, F and G were rare or absent (Luikart et al., Reference Luikart, Gielly, Excoffier, Vigne, Bouvet and Taberlet2001; Naderi et al., Reference Naderi, Rezaei, Taberlet, Zundel, Rafat, Naghash, el-Barody, Ertugrul and Pompanon2007; Amills et al., Reference Amills, Ramírez, Tomàs, Badaoui, Marmi, Acosta, Sànchez and Capote2009).
To determine the relationship of KR with wild goats, the ML phylogenetic tree (Figure 2) revealed that all goats from haplogroups A and B were identified on the same branch with C. aegagrus (EF989193), among the five wild ancestors considered. This shows that the KR goats possess ancient haplotypes similar to those of C. aegagrus. A review by Cinar Kul and Ertugrul (Reference Cinar Kul and Ertugrul2011) attests to the fact that domestic goat (Capra hircus) originated from wild species (C. aegagrus, C. caucasica, C. sibirica, C. cylindricornis, C. nubiana and C. falconeri.
Demographic history of the population
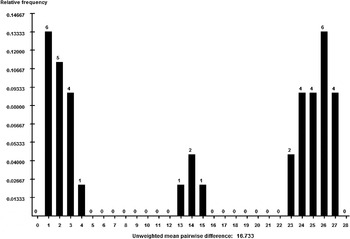
Fu's Fs and Tajima's D estimates are provided in Table 1. Tajima's D value was positive and insignificant (1.621; P > 0.10), whereas Fu's F s was positive and significant (6.283; P < 0.01). Fu's F s statistic, which is based on the probability of having a number of alleles greater or equal to the observed number in a sample drawn from a stationary population (Fu, Reference Fu1997), is considered to be more sensitive in detecting population expansion (Liao et al., Reference Liao, Kuo, Lin, Ho, Lin and Hwang2010). It is indicative from the significant and positive Fu's F s value and the mismatch distribution (Figure 3) that KR population has experienced reduction in population size. This outcome is expected in view of the concern already noted among breeders that the KR goat is being eroded (Kotze et al., Reference Kotze, Swart, Grobbler and Nemaangani2004). Contrary to the mismatch distribution and significantly positive Fu's F s observed for KR population, bell-shaped mismatch distributions reported for human population (Rogers et al., Reference Rogers, Fraley, Bamshad, Watkins and Jorde1996) and different goat breeds around the world (Luikart et al., Reference Luikart, Gielly, Excoffier, Vigne, Bouvet and Taberlet2001; Zhao et al., Reference Zhao, Zhang, Zhao, Zhang, Liu and Zhang2011), as well as significantly negative Fu' F s value (Zhao et al., Reference Zhao, Zhang, Zhao, Zhang, Liu and Zhang2011; Martínez et al., Reference Martínez, Ferrando, Manunza, Gómez, Landi, Jordana, Capote, Badaoui, Vidal, Delgado and Amills2012) are consistent with a demographic population expansion, such as would be expected for populations expanding after the domestication of relatively few founder-individuals (reviewed by Luikart et al., Reference Luikart, Gielly, Excoffier, Vigne, Bouvet and Taberlet2001). According to Martínez et al. (Reference Martínez, Ferrando, Manunza, Gómez, Landi, Jordana, Capote, Badaoui, Vidal, Delgado and Amills2012), cryptic bottleneck genetic signatures might be relatively frequent in domestic species because population declines are usually smooth and sustained, rather than drastic and instantaneous, and also because many concomitant factors, such as population subdivision, selection and migration, can alter their shape.
Mismatch distributions for mtDNA haplogroups in the KR goat.

Conclusions
The genetic diversity of the KR goat population was high as revealed by the mtDNA analysis. Phylogenetic analysis revealed that the breed clustered with C. aegagrus as its wild ancestor and belongs to two mtDNA lineages (A and B), further supporting the possibility of multiple maternal origins. There is evidence of mitochondrial footprint that reflects past population decline based on positive and significant Fu's F s estimate and the mismatch distribution. However, the mtDNA genetic variability of the KR breed has not been drastically reduced as a result of population decline. The information obtained will be useful in utilization and conservation of the KR population.
Acknowledgements
This study was partly funded by the research grant from Tertiary Education Trust Fund, an initiative of the Federal Government of Nigeria, through the Directorate of Grant Management of FUNAAB for which we are grateful. The authors are also grateful to the Management of the Institute of Food Security, Environmental Resources and Agricultural Research of FUNAAB for providing the experimental animals. We thank the Veterinary Officers, Security Officers and Technical Staff of the Institute for their immense assistance; the initiative of the former Vice-Chancellor of FUNAAB, Professor O.O. Balogun to import the Kalahari Red goat from South Africa to Nigeria; Biosciences Eastern and Central Africa (BecA-ILRI Hub) for supporting the Scientific Paper-writing Workshop that encouraged the writing of this paper; and Dr. Chris Beadle (CSIRO Ecosystem Sciences, Australia) for his constructive comments.
Statement of interest
None.